XRP on the Verge of a Major Breakout, but in Which Direction? (Ripple Price Analysis)
Ripple’s price has been consolidating against USDT during the past few weeks while remaining clearly bearish against BTC. Analyzing both pairs might provide clues on the future price trend.
Technical Analysis
By TradingRage
Ripple Price Analysis: The USDT Chart
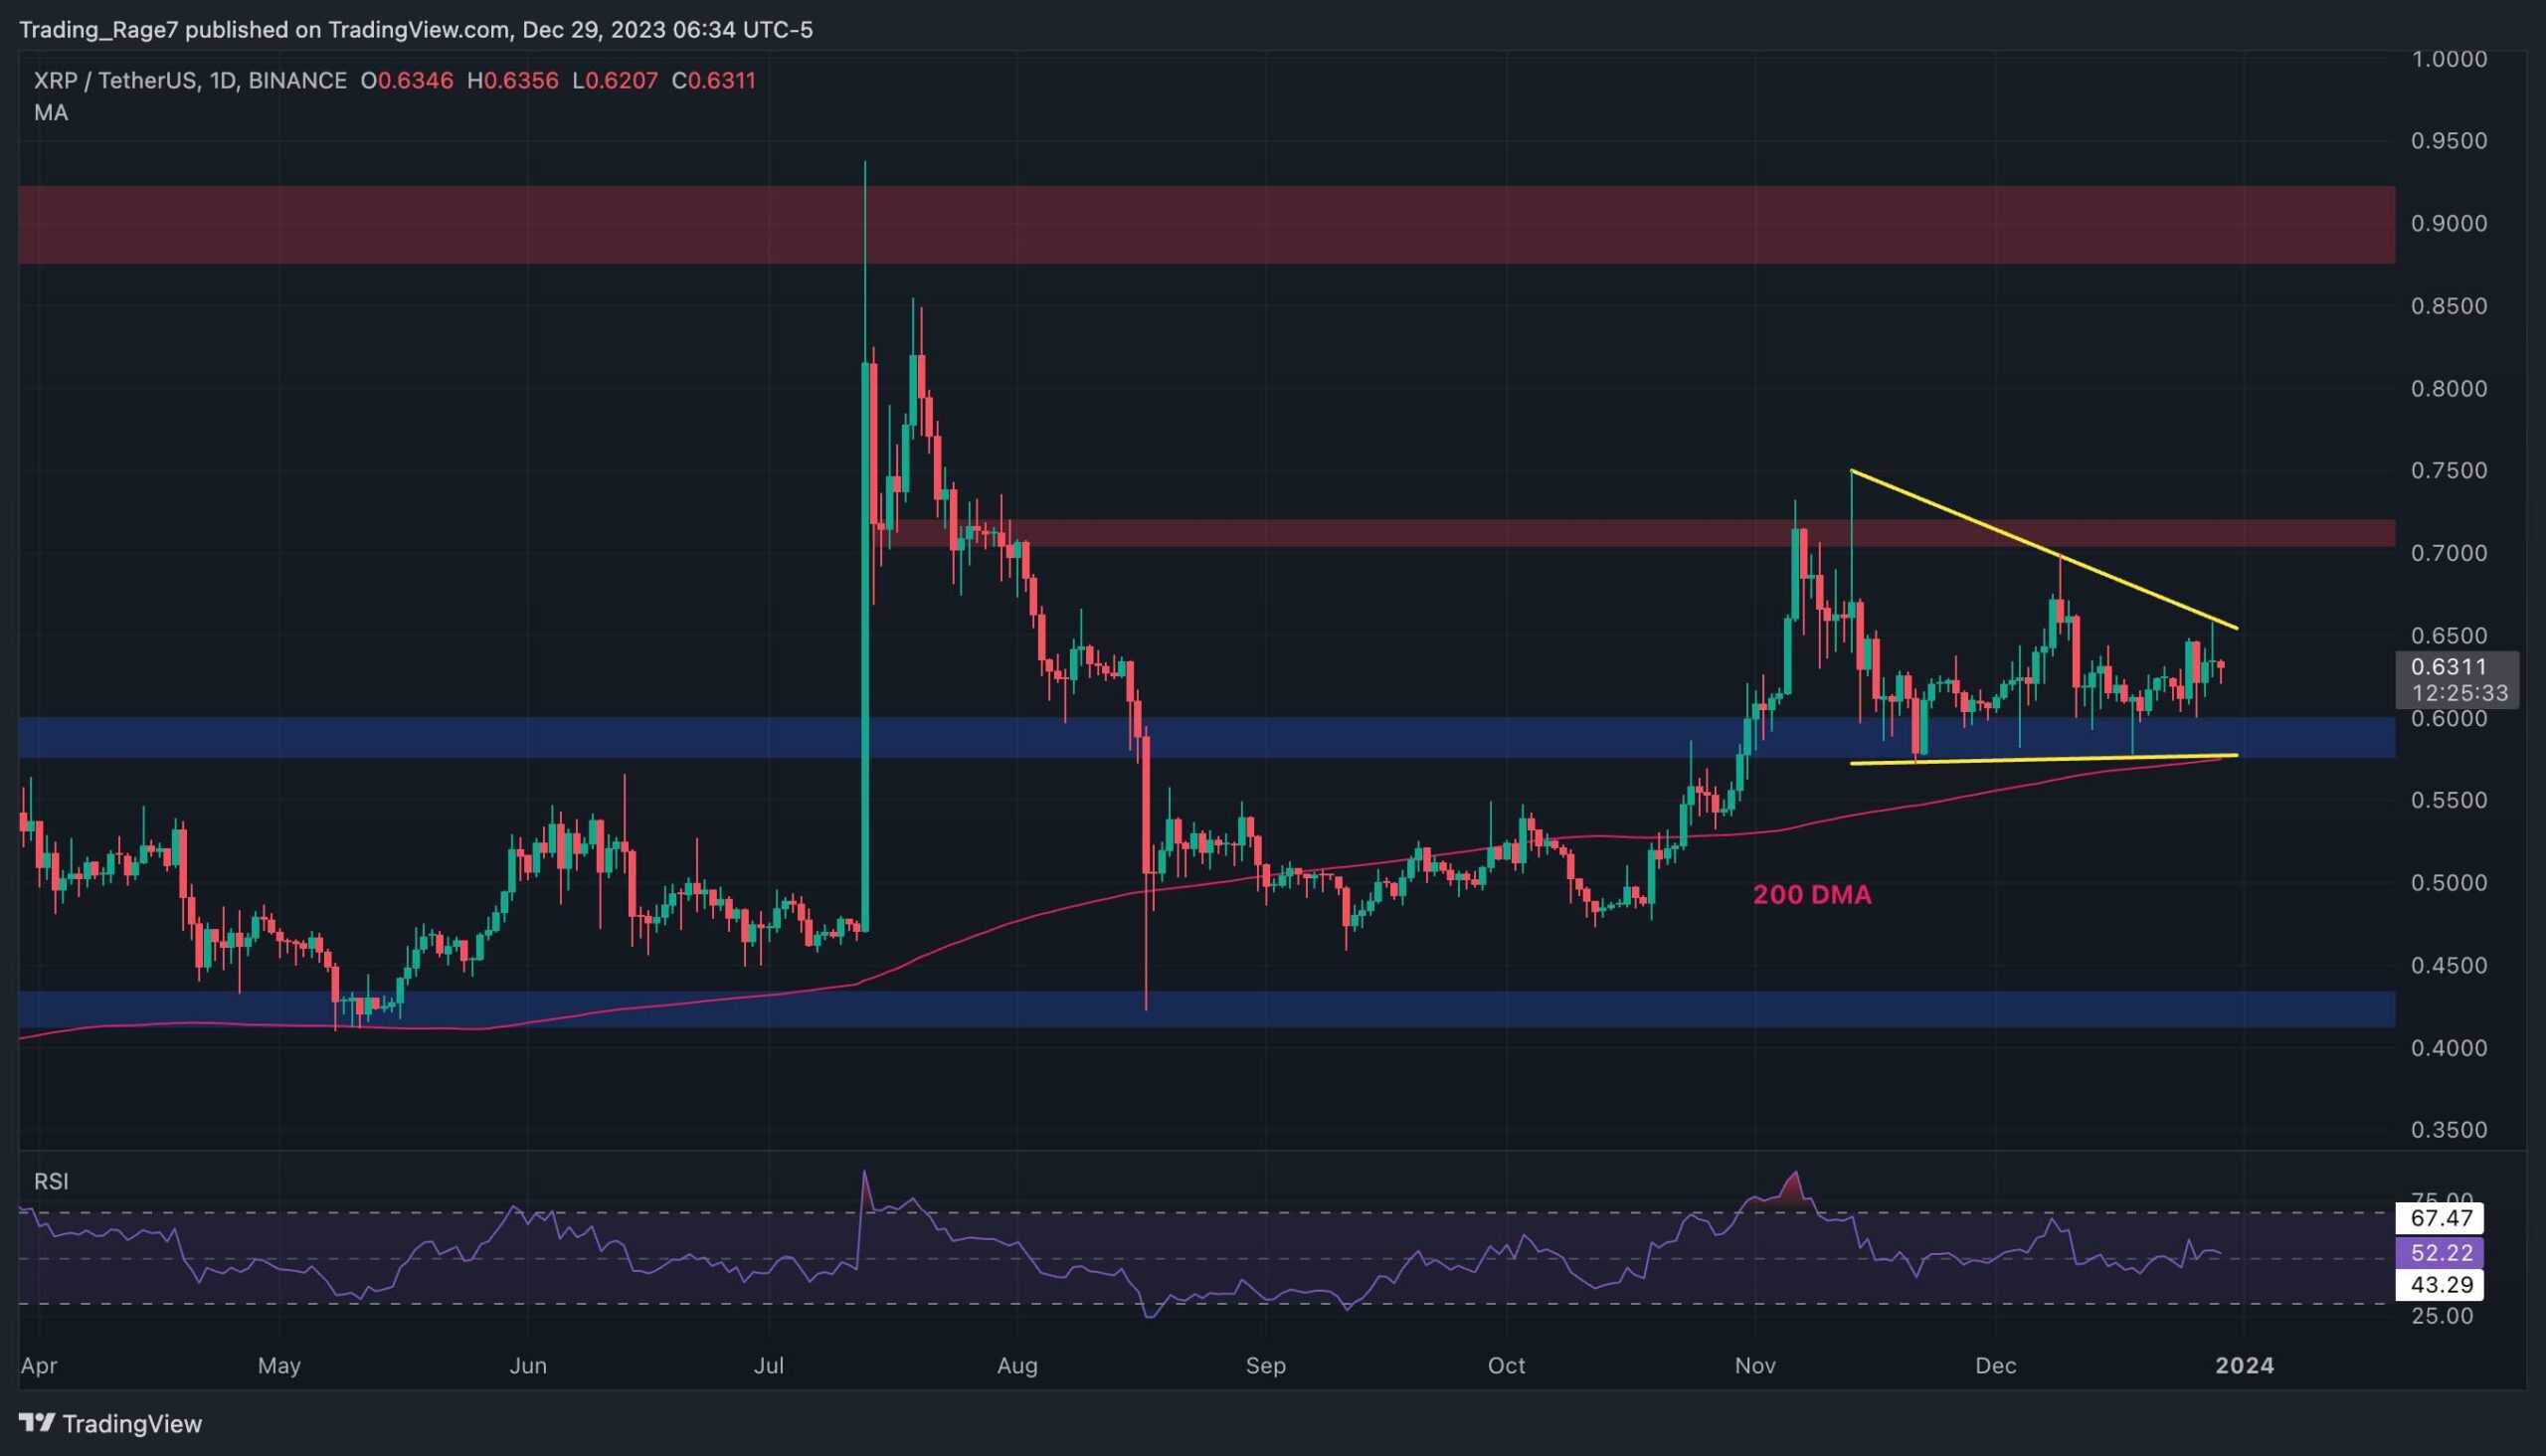
Against USDT, the price has been trapped inside a triangle pattern since November and is yet to break out. While the $0.6 support level has been providing support and preventing a more profound decline, the price has not been able to rebound to the upside and reach the $0.7 resistance zone.
The relative strength index also hovers around the 50% level, offering little insight into the future price direction. Therefore, a breakout to either side would determine whether the price will drop or rally higher.
The BTC Paired Chart
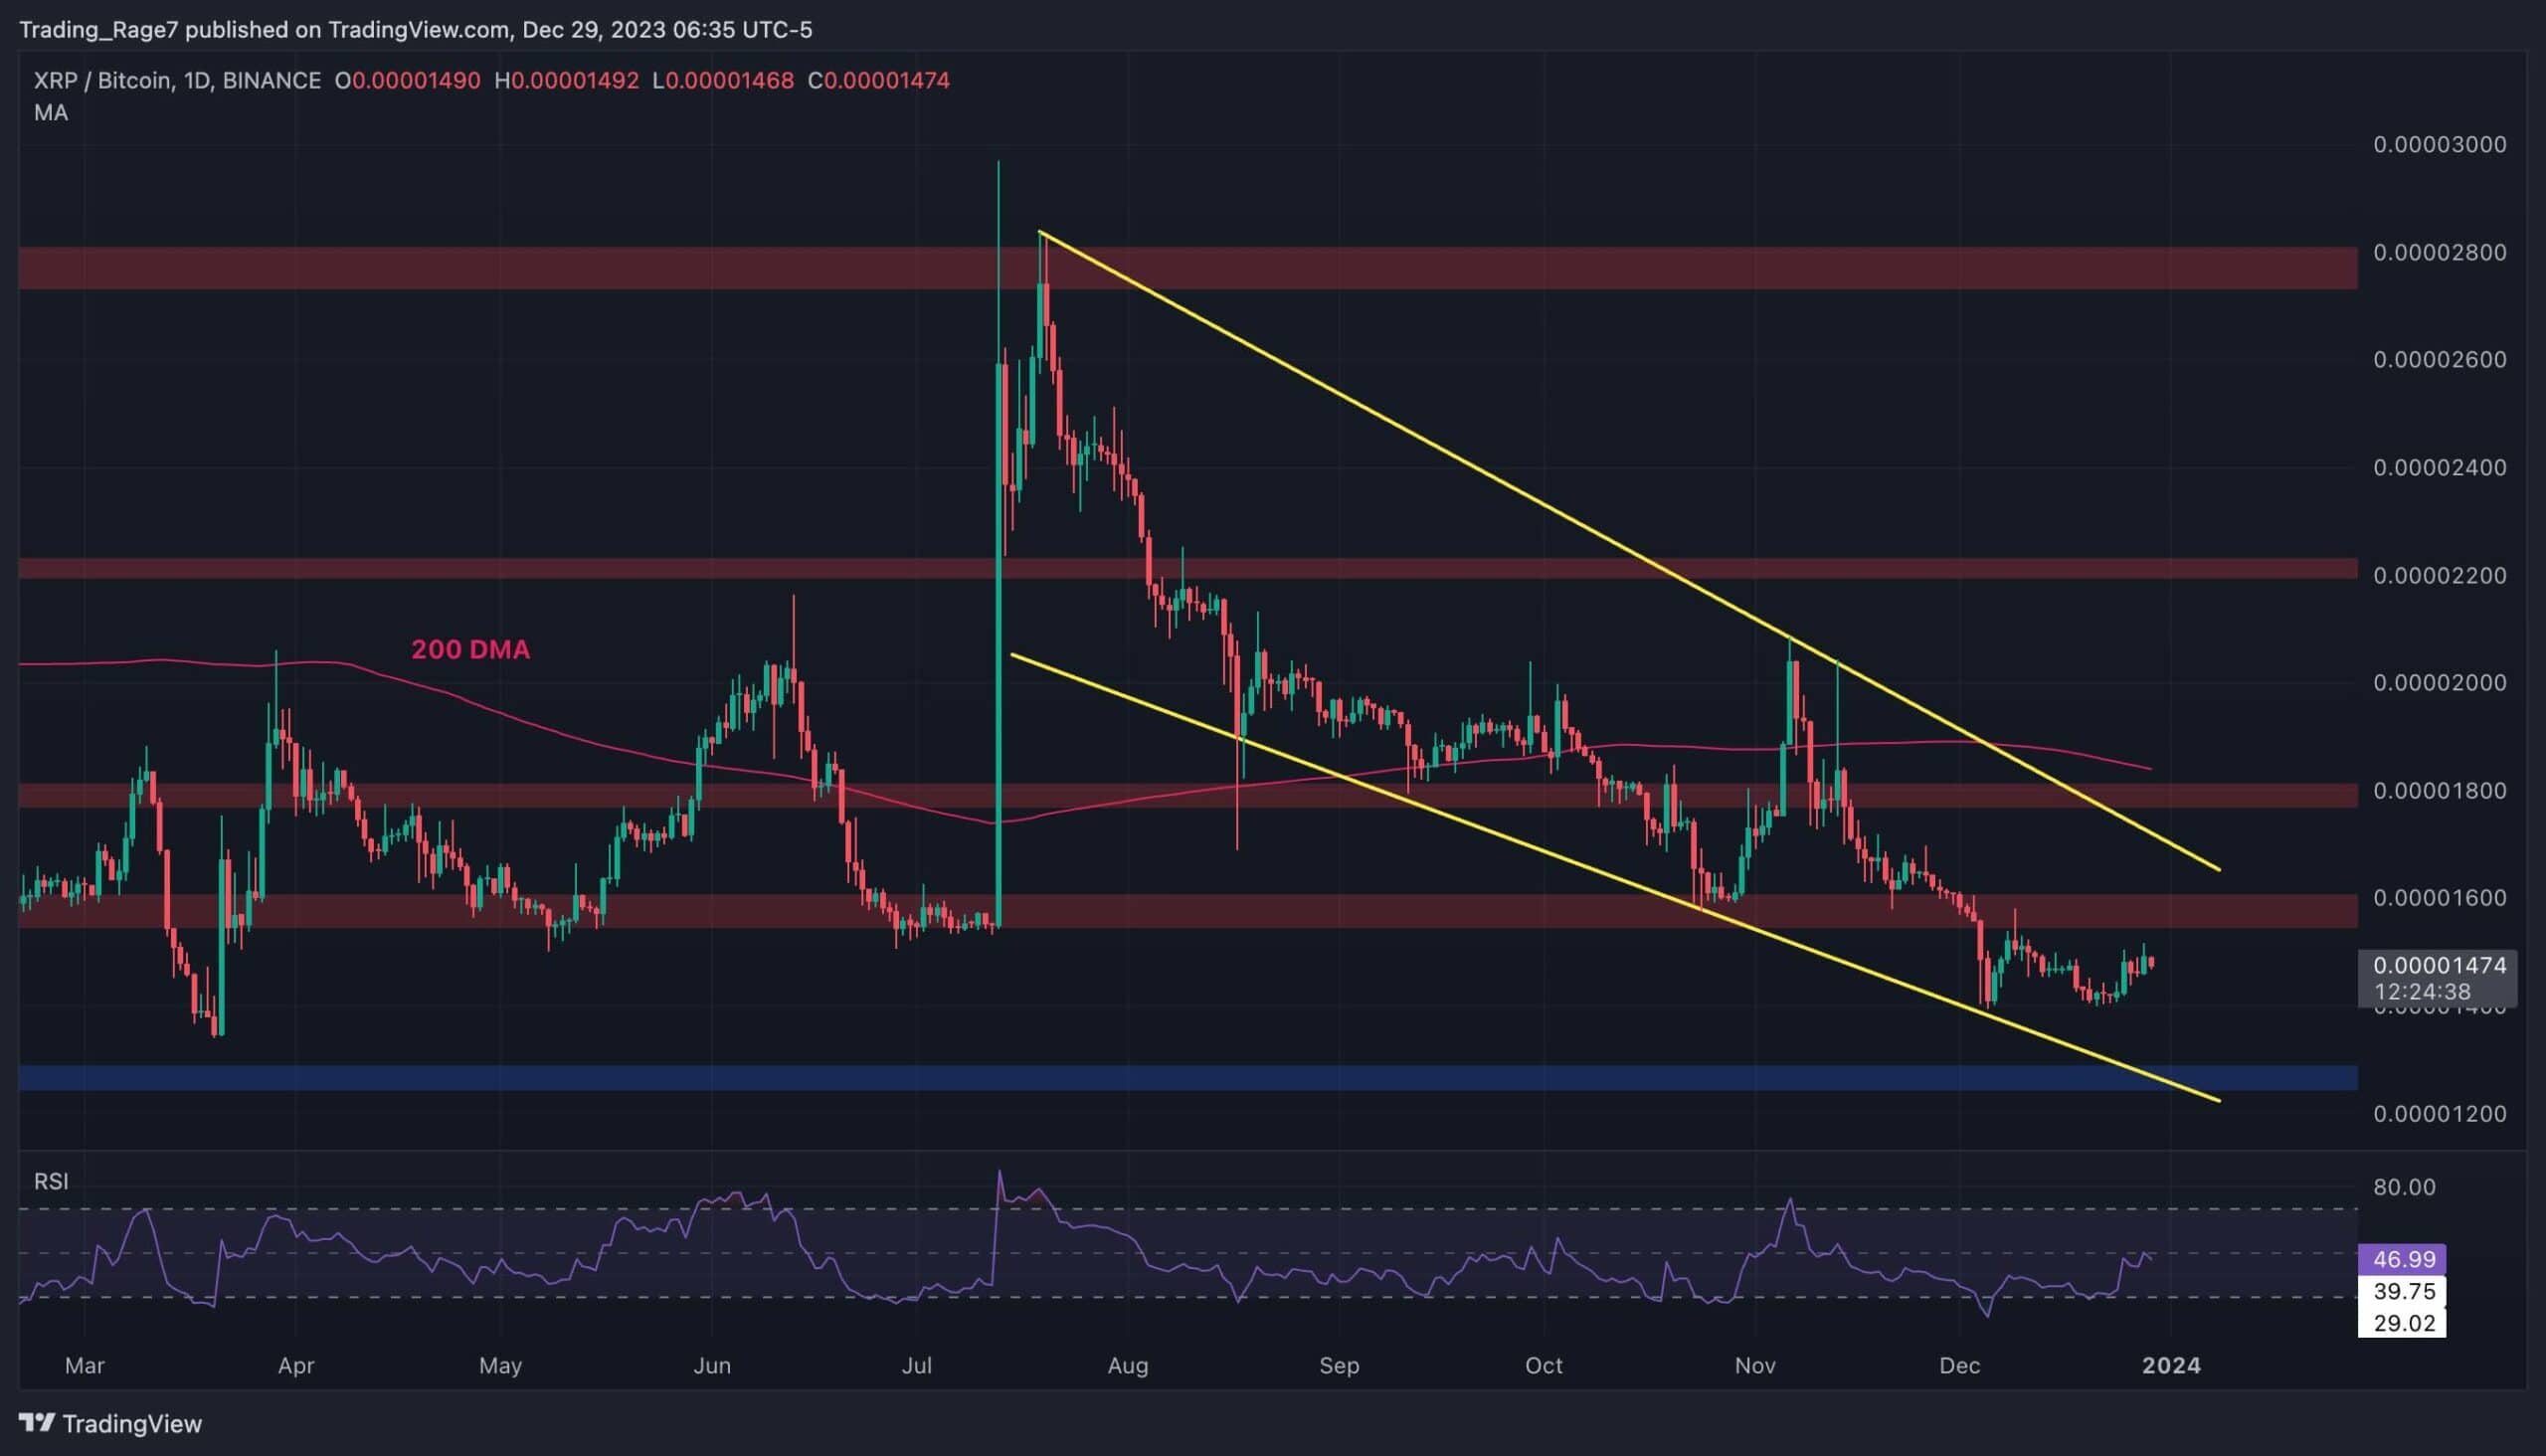
The BTC chart shows that the price has been making lower highs and lows inside a large descending channel. Several support levels have also been broken to the downside, with the 1300 SAT level being the only support zone intact.
Therefore, a break below this level would be disastrous for XRP, as it would significantly depreciate against Bitcoin. On the other hand, a bullish trend would only begin if the price breaks the channel to the upside.
The post XRP on the Verge of a Major Breakout, but in Which Direction? (Ripple Price Analysis) appeared first on CryptoPotato.