XRP Bears Eye $0.48 as the Wors Might Not be Over Yet: Ripple Price Analysis
The recent market movements have subjected Ripple’s price to increased selling pressure, precipitating a descent below the significant 100-day and 200-day moving averages and concluding a pullback.
Despite this, indications point toward a sustained downward trajectory in the mid-term.
XRP Analysis
By Shayan
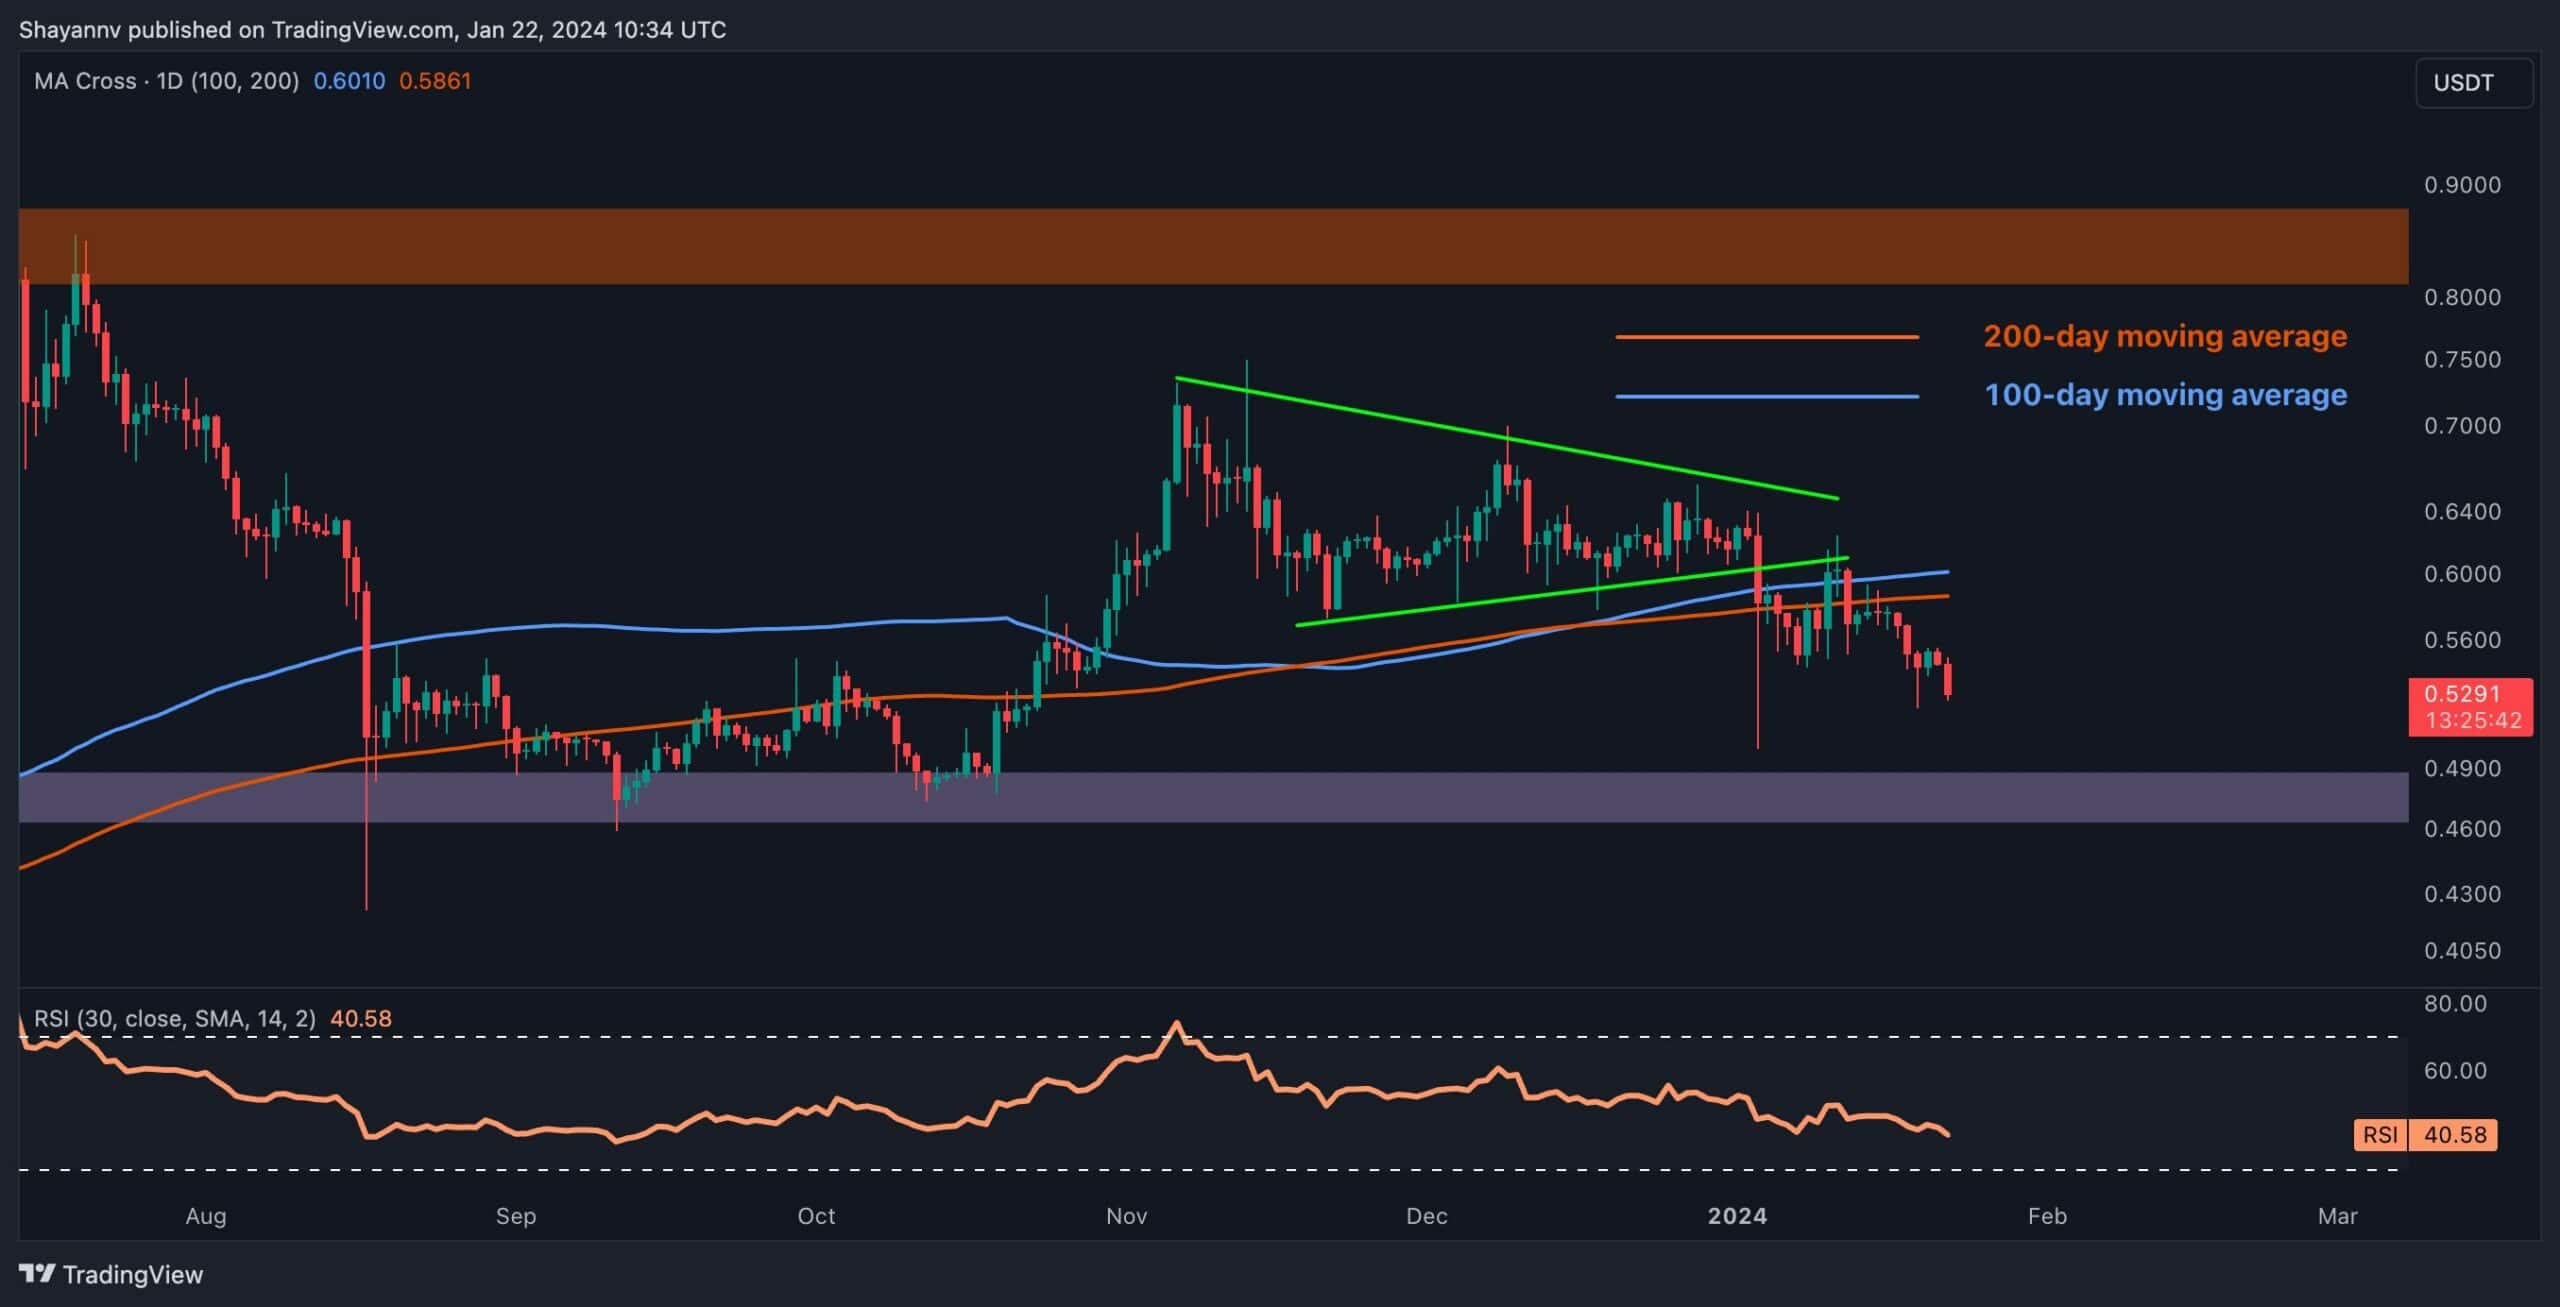
Ripple Price Analysis: The Daily Chart
A thorough examination of the daily chart unveils a notable decline in Ripple’s price, breaching its multi-month sideways consolidation range and successfully completing a pullback. Intensified selling pressure also led to the breaking of a substantial support zone, encompassing the 100 and 200-day moving averages, prompting concerns about Ripple’s mid-term direction.
Considering the prevailing price action and market conditions, the likelihood of the recent descent persisting is high, with the aim of breaching the significant multi-month support region at $0.48. A successful break below this critical range could potentially set Ripple on a prolonged downward trajectory, instigating fear and uncertainty in the market.
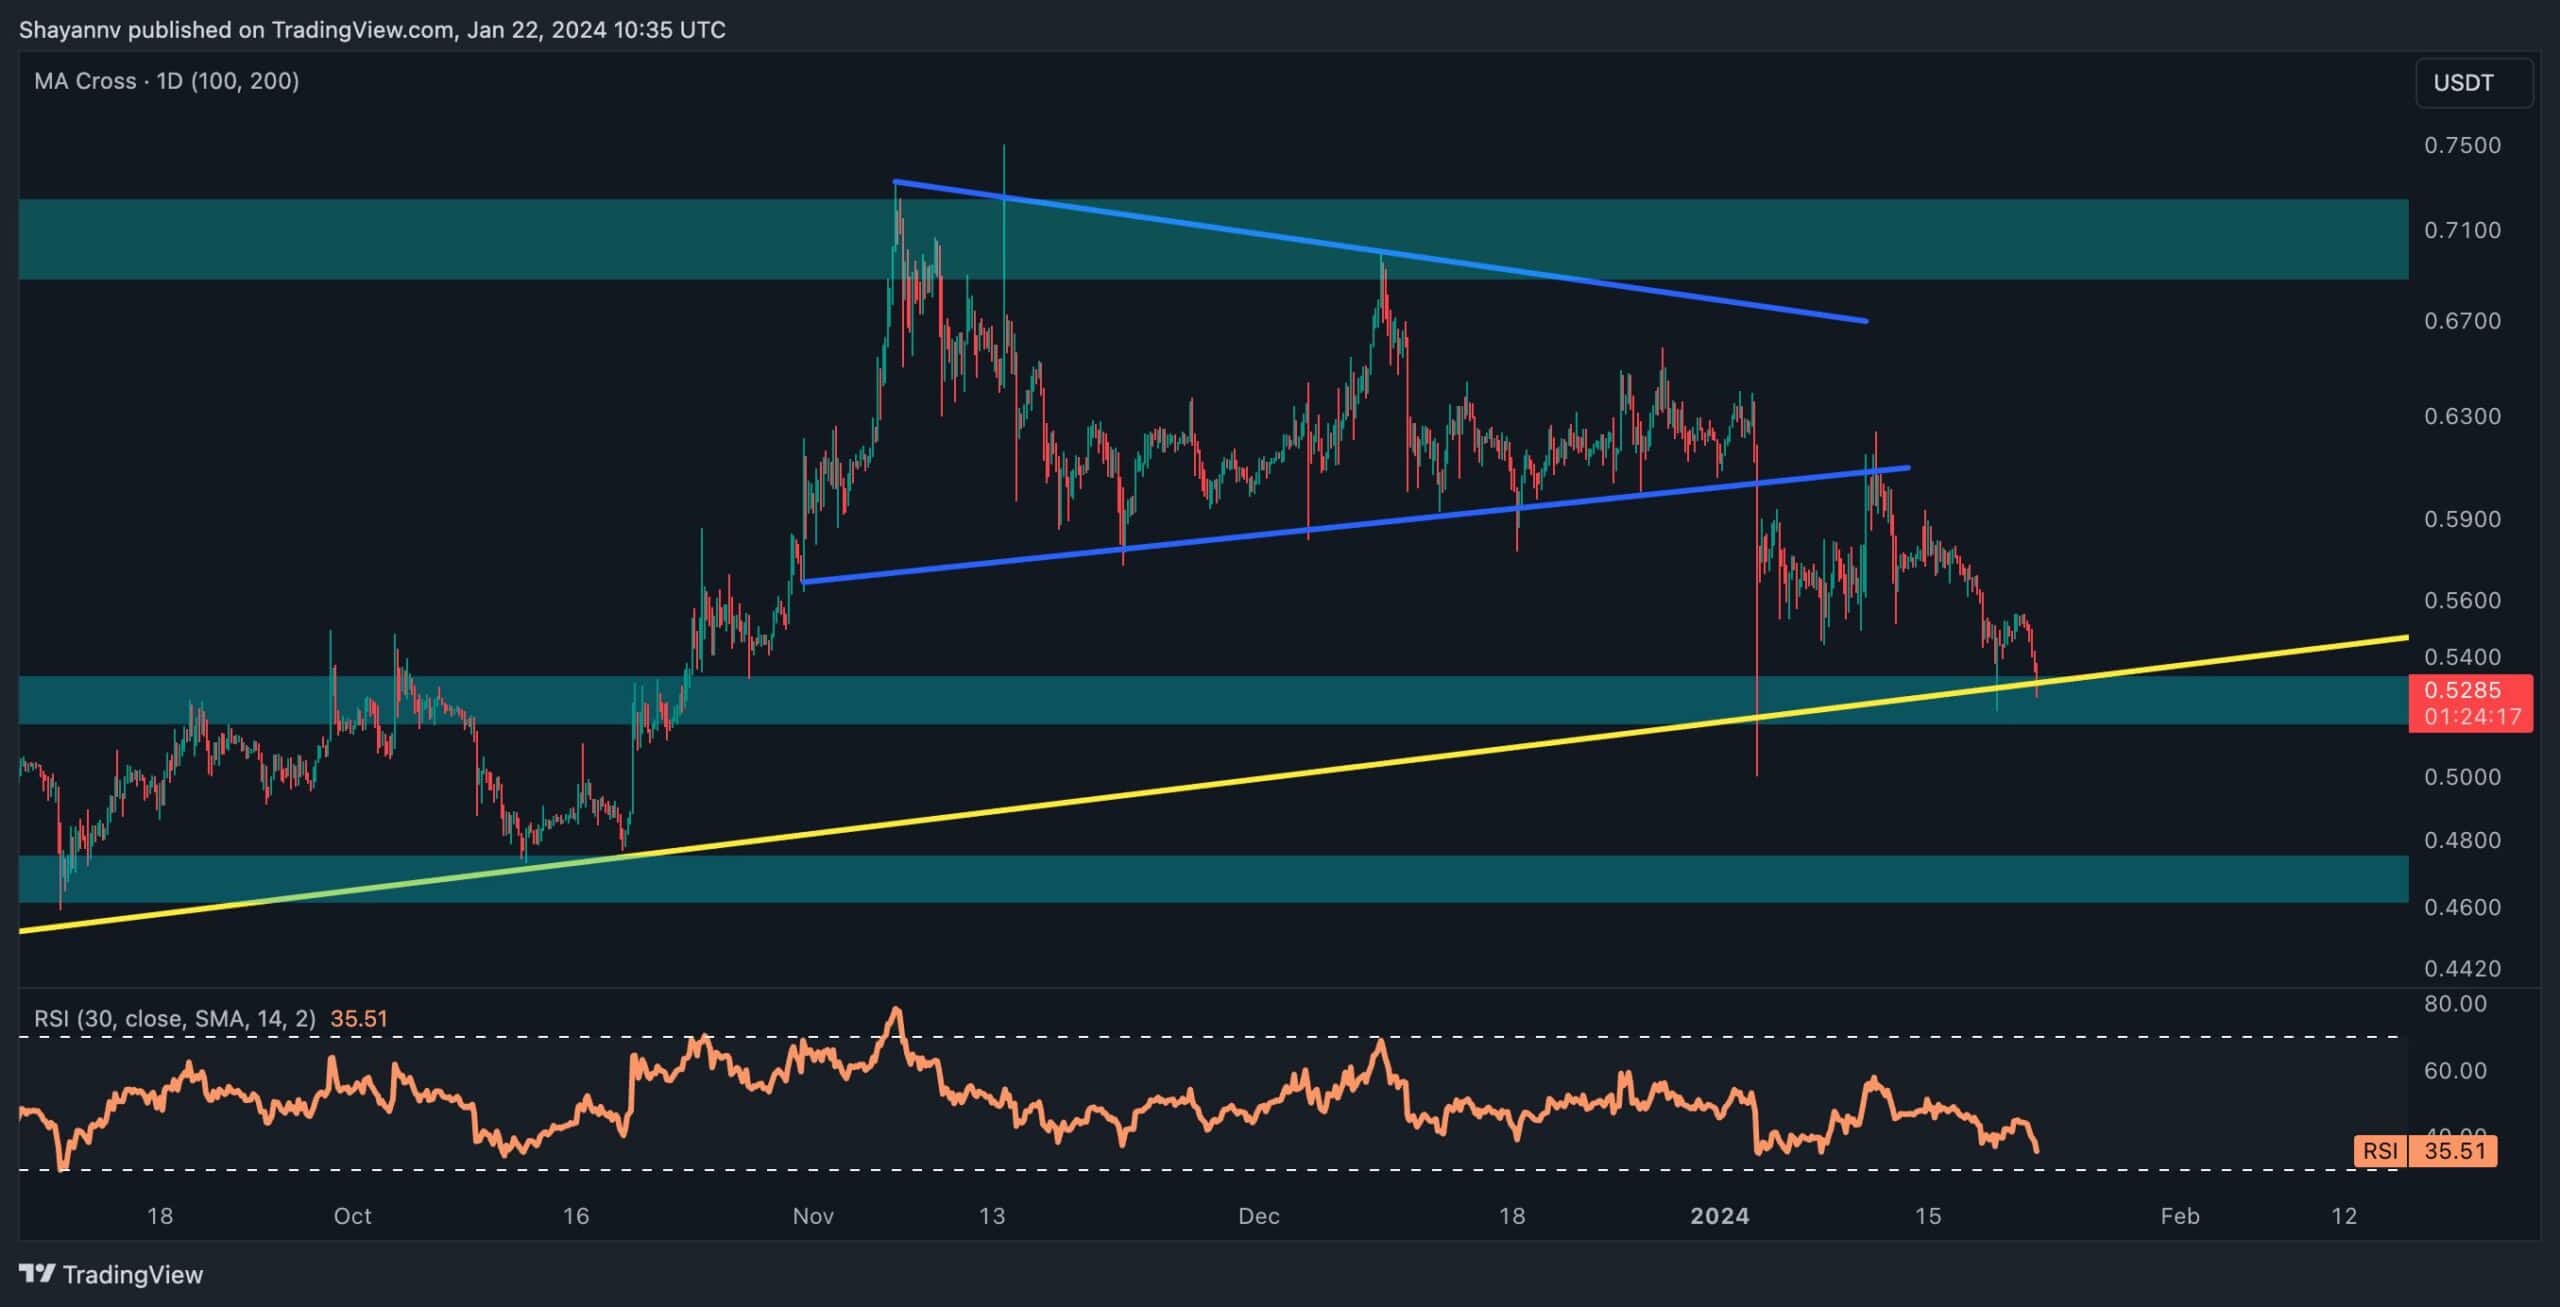
The 4-Hour Chart
A closer analysis of the 4-hour chart reveals an impulsive breach below the lower boundary of the multi-week sideways wedge, underscoring the dominance of sellers in the market. However, the price has reached a pivotal support region determined by the multi-month ascending trendline.
This trendline has proven to be a robust support, halting multiple downward attempts. Presently, as the price intersects this crucial trendline and the static support zone at $0.52, there is a notable potential for a reversal, leading to a sideways consolidation phase.
Nonetheless, given the prevailing strength of sellers in the current market conditions, the possibility of a break below this crucial support region persists, potentially prolonging the ongoing downward trend. In such a scenario, the next critical support level for the price would be at $0.48.
The post XRP Bears Eye $0.48 as the Wors Might Not be Over Yet: Ripple Price Analysis appeared first on CryptoPotato.