XRP Approaches Critical Support, Can it Bounce Back Toward $0.8? (Ripple Price Analysis)
Ripple is currently experiencing a prolonged correction phase in its price action due to encountering significant resistance at the $0.85 level.
However, there is a potential for a short-term interruption in the downtrend as the price approaches a robust support region.
Technical Analysis
By Shayan
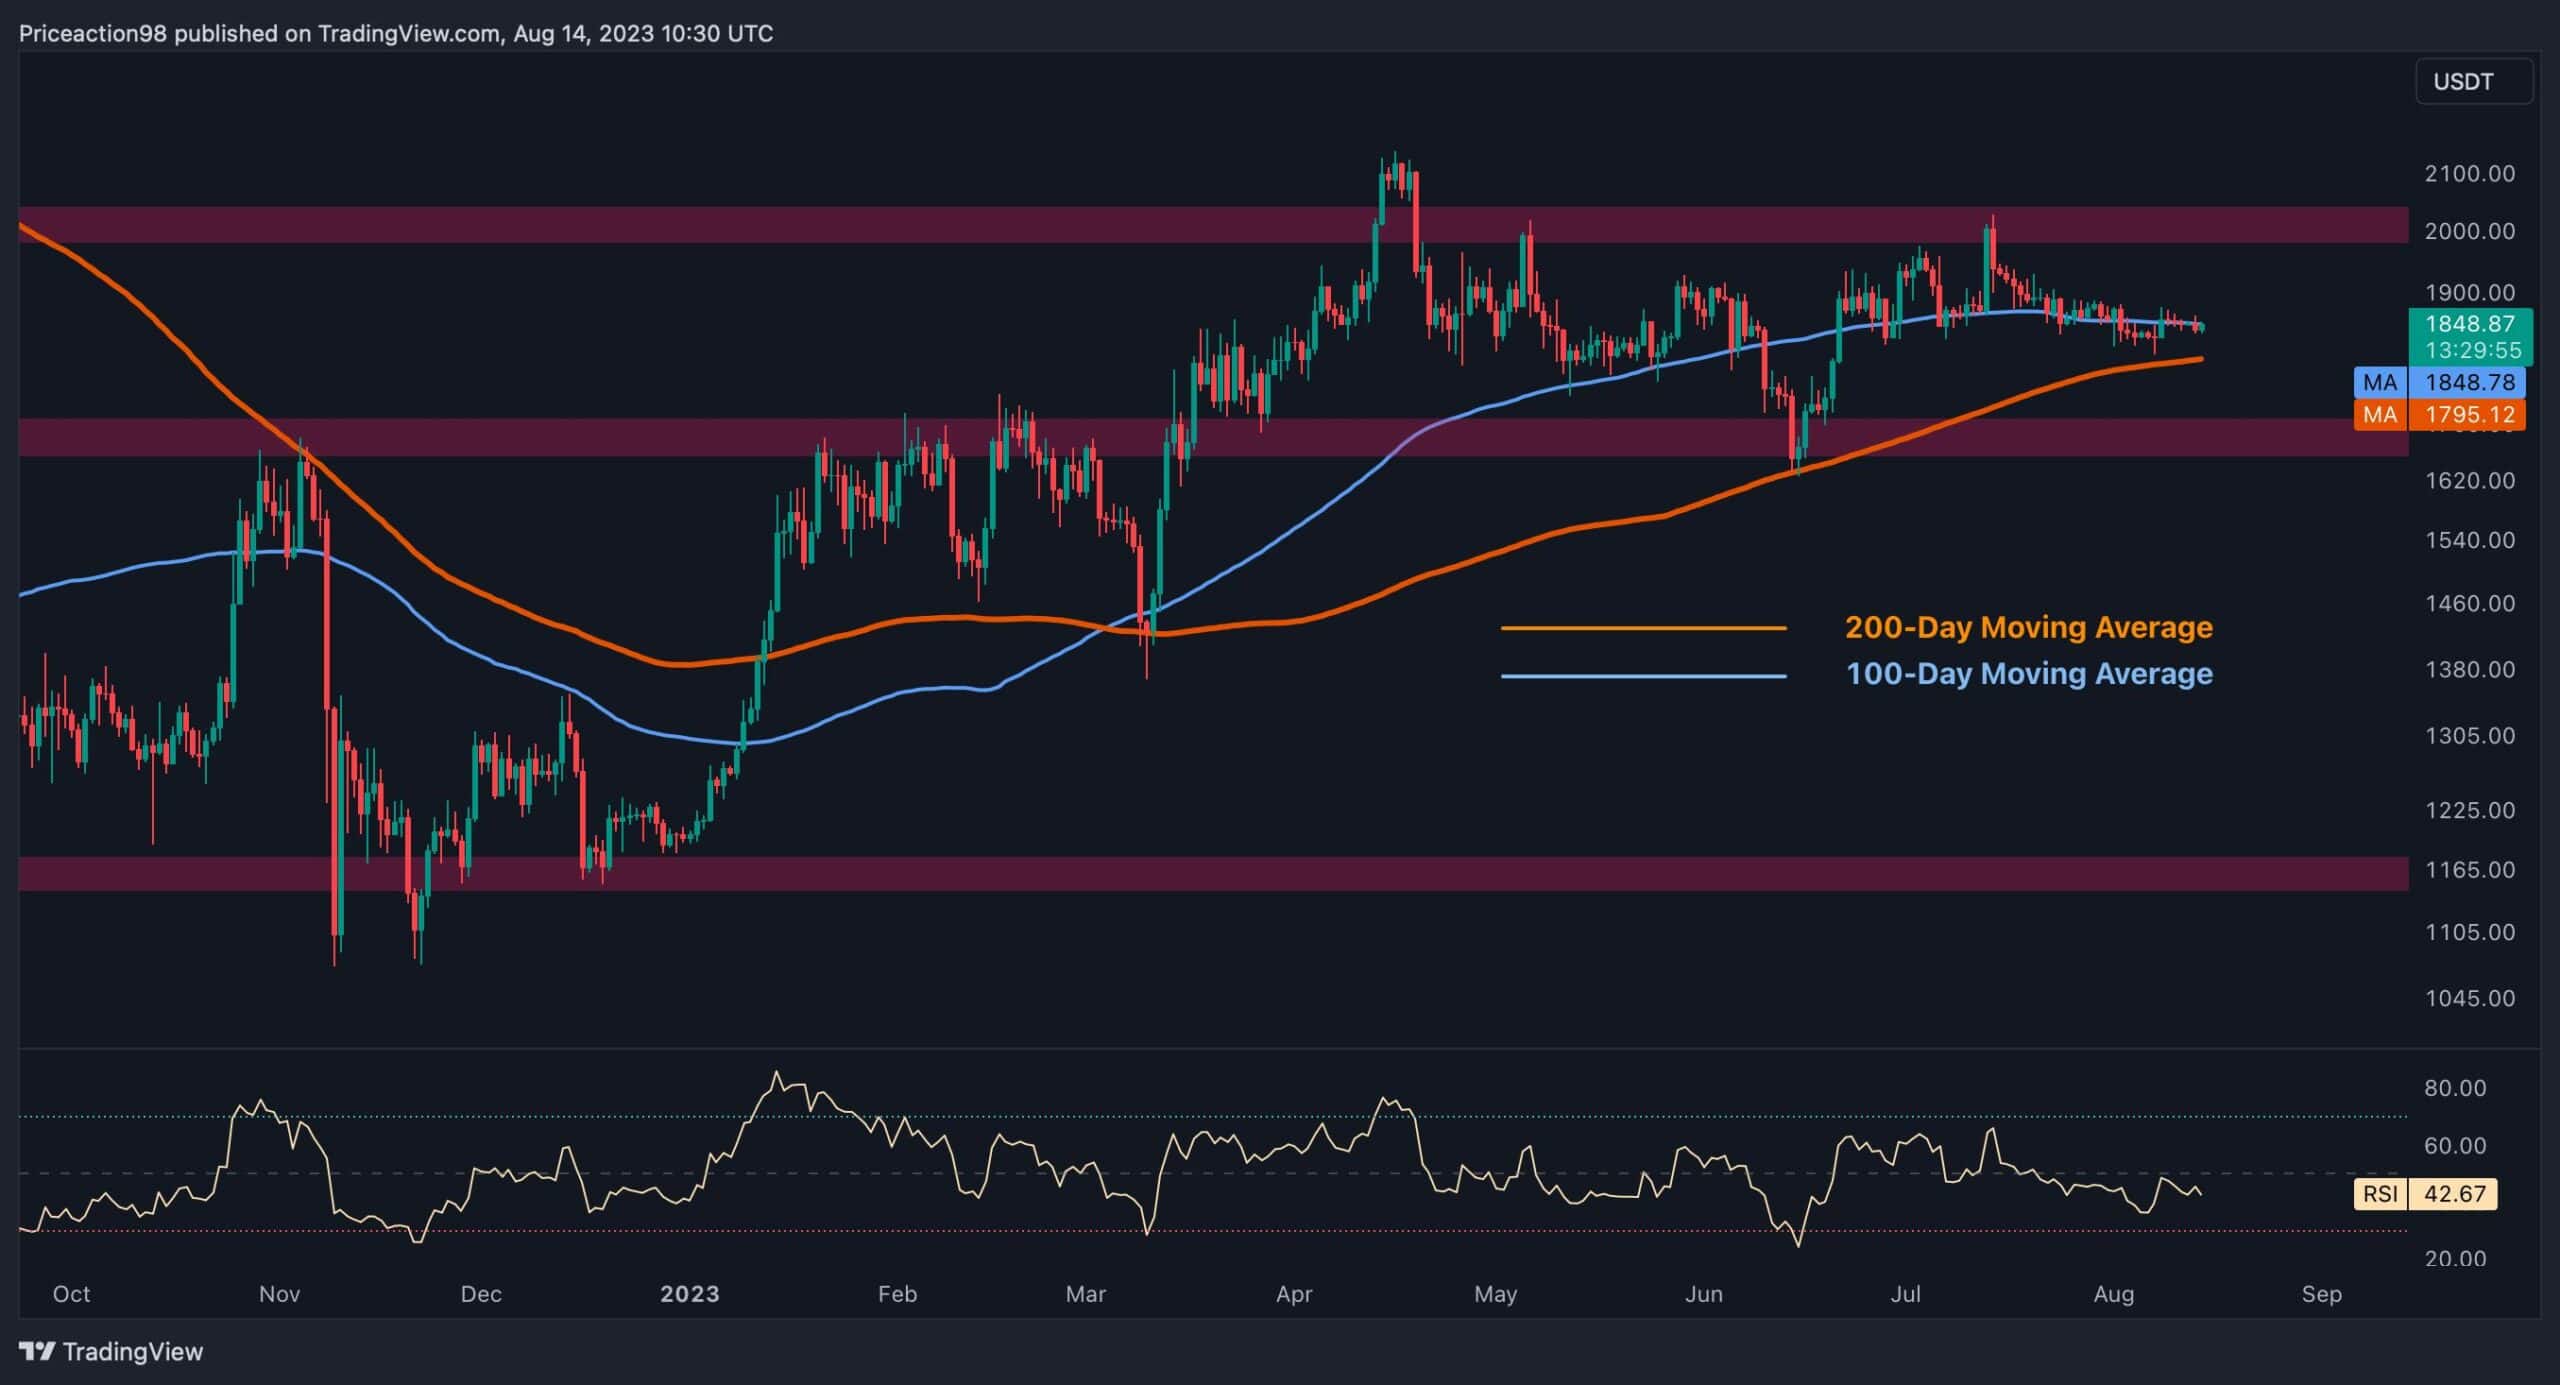
The Daily Chart
A careful examination of the daily chart reveals the presence of selling pressure and notable supply in the vicinity of the $0.8 price range.
This has effectively halted the earlier bullish upswing and resulted in an extended rejection. The outcome of this rejection could take one of two paths: it may either evolve into a bearish trend with further price plunges or serve as a corrective phase, leading to a retracement towards the previously breached $0.55 price zone.
Yet, XRP is presently edging closer to a significant support zone encompassing the pivotal $0.55 support level and the substantial 100-day moving average. This zone holds the potential to stop further downward movement and possibly initiate an upward rally toward the crucial $0.8 threshold.
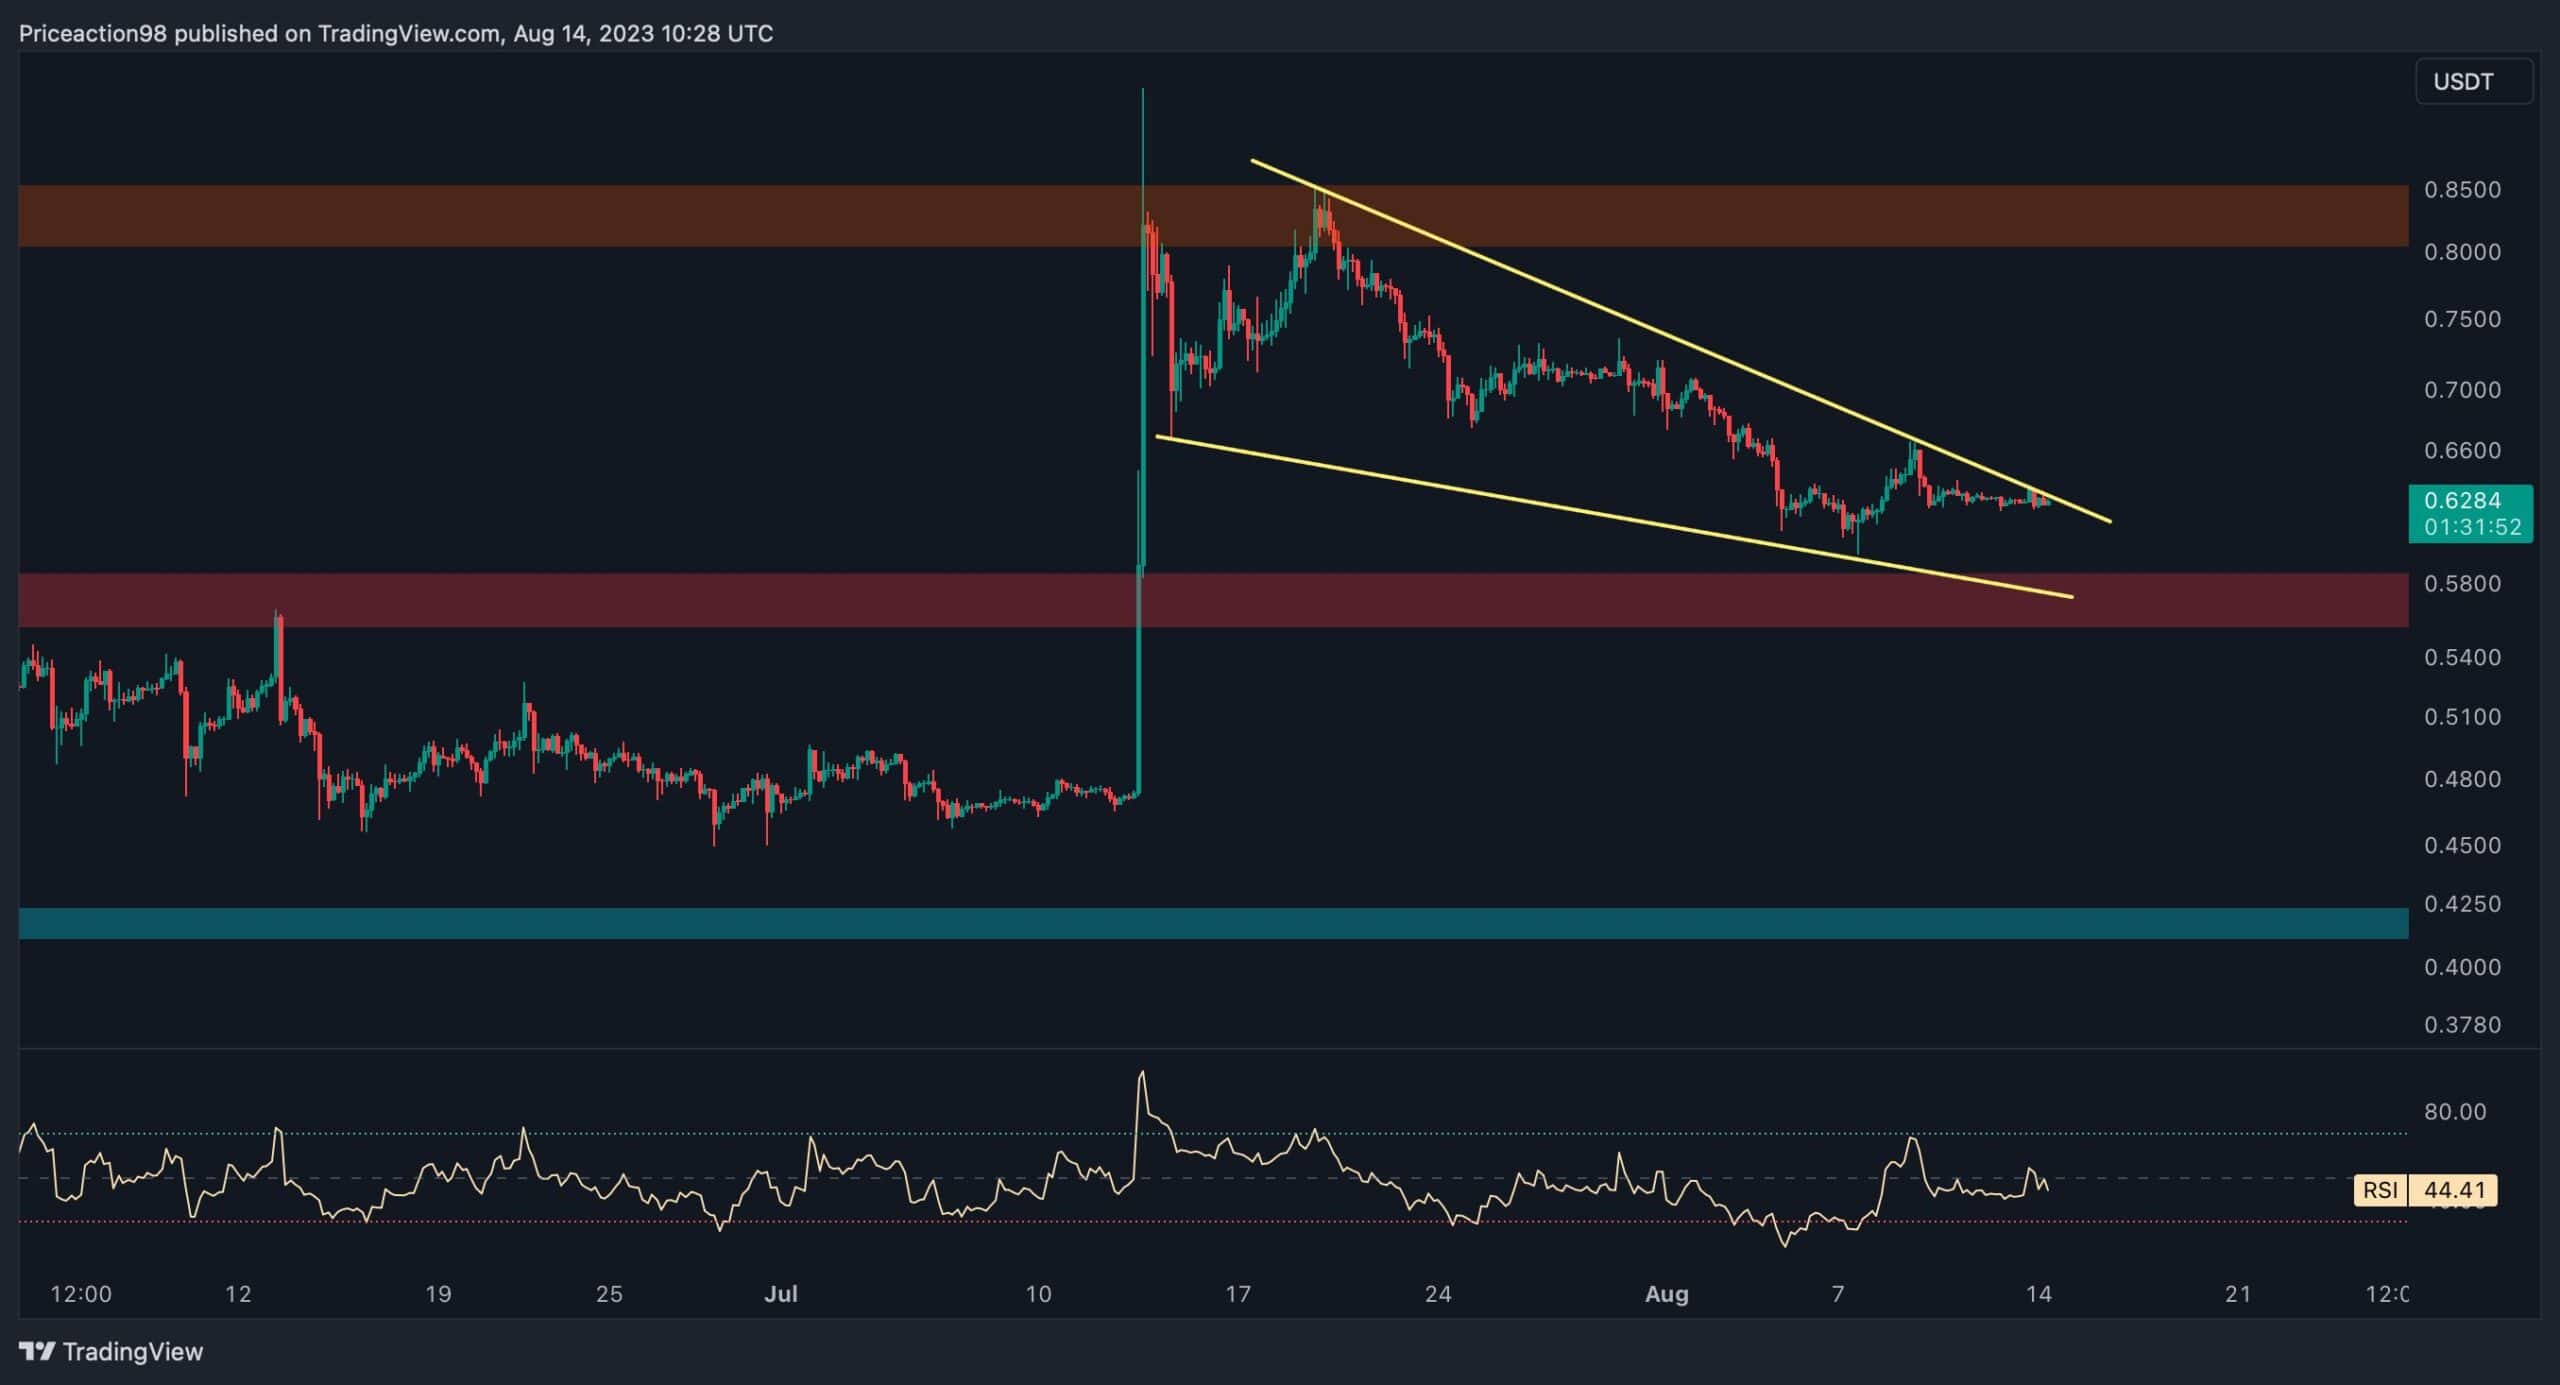
The 4-Hour Chart
In the 4-hour chart, it can be observed that the price has been in the midst of a corrective phase, manifesting as consolidation within a descending wedge pattern. This specific pattern is recognized as a bullish continuation pattern, and its confirmation hinges on the price breaching the upper trendline and subsequently retesting it as a pullback.
However, there exists a critical support region around the static $0.55 level, which assumes a pivotal role as it aligns with the lower boundary of the wedge pattern.
Should the $0.55 level manage to provide support for the price, traders can anticipate the possibility of another bullish surge, with the objective of breaking through the upper trendline of the wedge.
Conversely, if sellers successfully drive the price below this crucial level, it has the potential to trigger a cascading effect, thereby intensifying market volatility. In either scenario, close attention to price movements is advisable, as the interplay between these support and resistance levels will likely define the immediate future trajectory of Ripple’s price action.
The post XRP Approaches Critical Support, Can it Bounce Back Toward $0.8? (Ripple Price Analysis) appeared first on CryptoPotato.