Up $100: Bitcoin Price Indicators Grow Increasingly Bullish
Bitcoin (BTC) looks likely to inch higher toward $6,800 in the near-term, as the technical indicators have grown increasingly bullish in the last 24 hours.
Notably, the 14-day relative strength index (RSI), which measures the speed and change of price movements, has jumped to 59.04 – the highest level since Sept. 4.
A reading above 50 indicates that bullish forces are acting on the security. So, it seems safe to say that the leading cryptocurrency is looking most bullish in two months.
At press time, BTC is changing hands at $6,510 on Coinbase, representing a $100 or 1.5 percent gain on a 24-hour basis.
The current position of the RSI is indeed encouraging for the bulls. Technical analysts, however, may argue that calling a bullish move on the basis of RSI alone is a risky business, as the indicator occasionally produces fake signals.
While that is true, in BTC’s case, other indicators are also biased toward the bulls. Hence, we can confidently place our trust in the RSI.
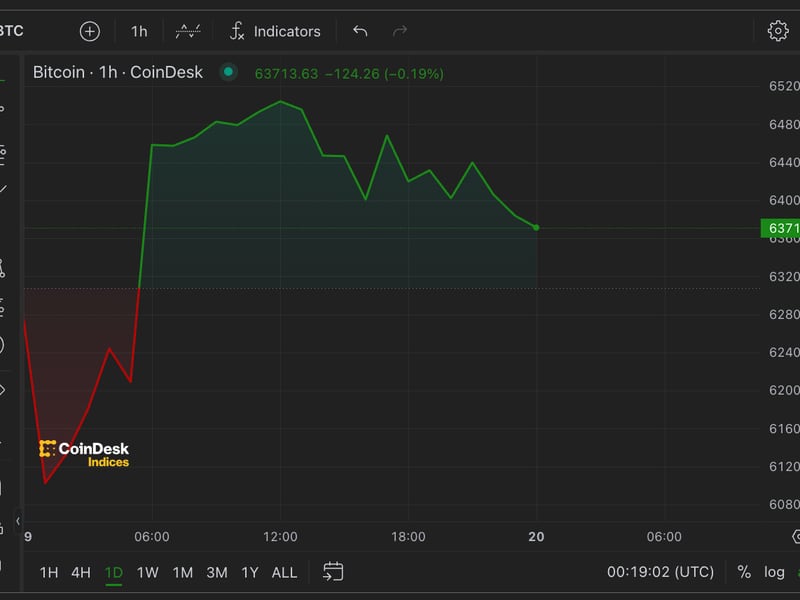
Daily chart

As can be seen above, BTC has cleared the stiff 50-day exponential moving average (EMA) hurdle today, having witnessed a bullish symmetrical triangle breakout over the weekend.
The 5-day and 10-day EMAs are trending north, indicating a bullish setup.
Further, BTC is currently trading above the upper Bollinger band of $6,500 and a breakout would be confirmed if prices see a UTC close above that level.
What’s more, the moving average convergence divergence (MACD) histogram is rising, indicating scope for further gains.
To sum up, both price action and the technical indicators are validating the bullish signals given by the RSI.
View
- The odds are stacked in favor of a rally to $6,800 in the near-term.
- A break above 50-day simple moving average (SMA) of $6,642 on the 3-day chart would mark the beginning of the long-awaited bullish reversal, as discussed yesterday.
- A UTC below the ascending (bullish) 10-day EMA of $6,400 would weaken the bullish pressure.
Disclosure: The author holds no cryptocurrency assets at the time of writing.
Bitcoin image via CoinDesk archives; Charts by Trading View
Join 10,000+ traders who come to us to be their eyes on the charts and sign up for Markets Daily, sent Monday-Friday. By signing up, you agree to our terms & conditions and privacy policy
The leader in blockchain news, CoinDesk is a media outlet that strives for the highest journalistic standards and abides by a strict set of editorial policies. CoinDesk is an independent operating subsidiary of Digital Currency Group, which invests in cryptocurrencies and blockchain startups.