Traders Anticipate an XRP Bull Run Following the Surge to $0.65 (Ripple Price Analysis)
Ripple’s price has finally shown some positive signs, making investors optimistic that the new XRP bull run is on the horizon.
Technical Analysis
By TradingRage
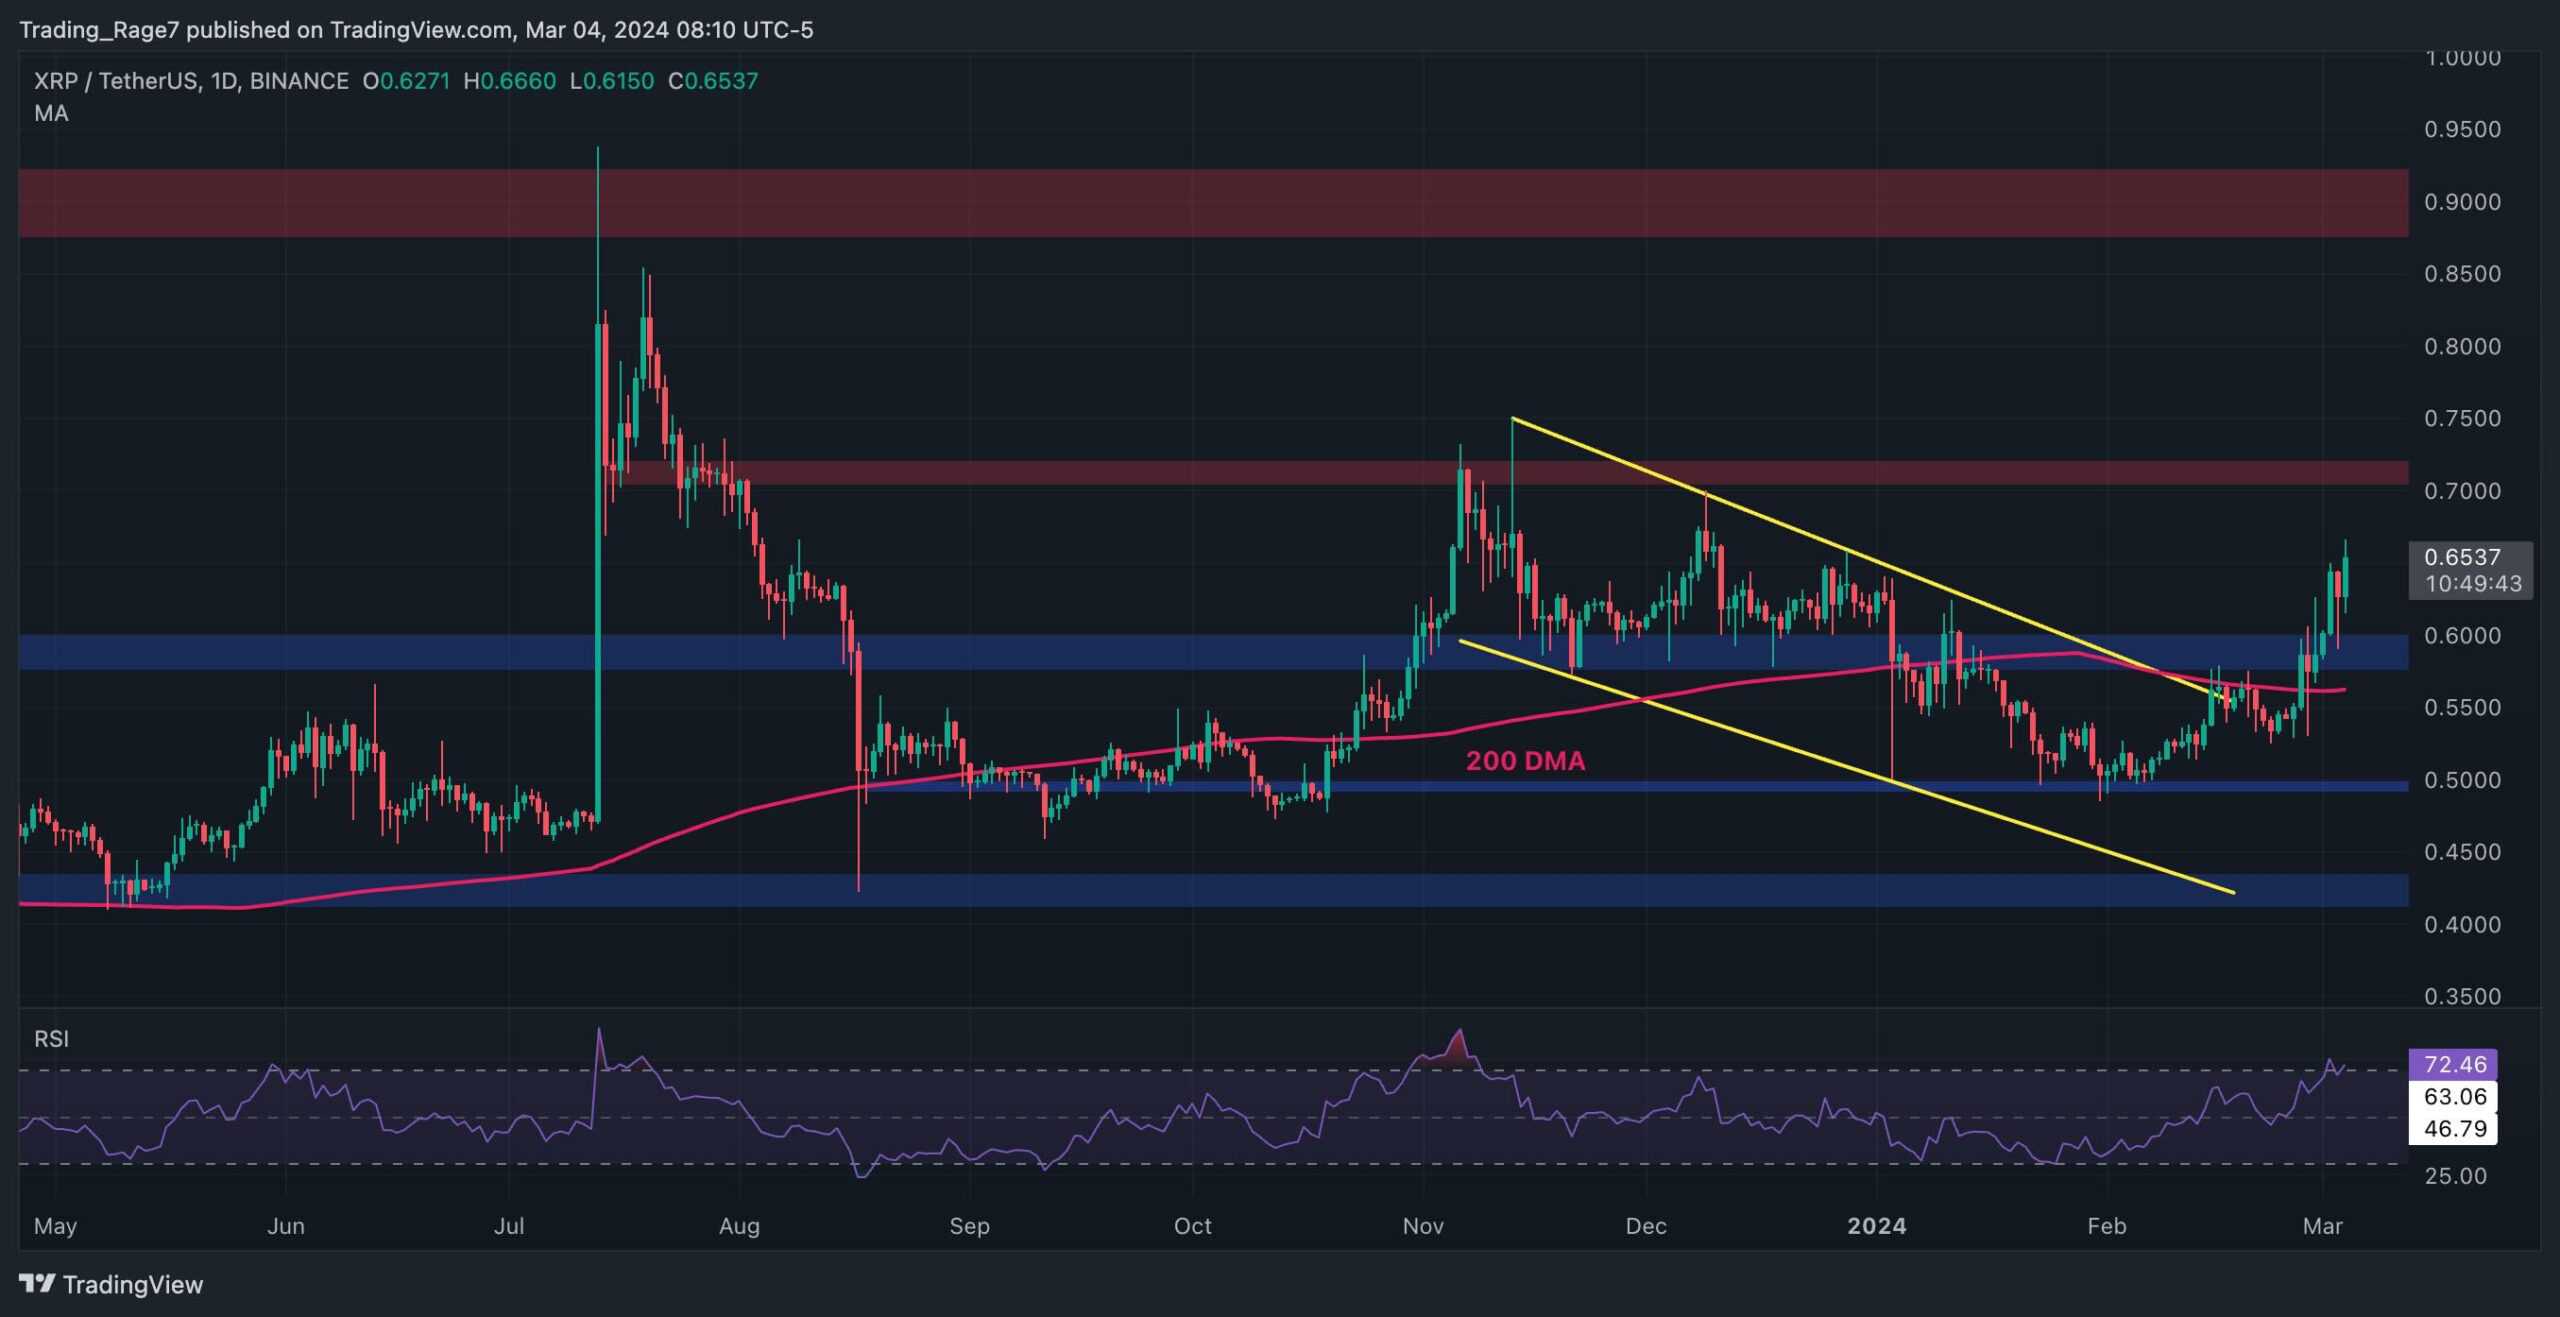
The USDT Paired Chart
The Daily chart of the XRP/USDT pair demonstrates a bullish shift in market structure, as the price has broken above the large descending channel and the 200-day moving average at last.
As a result, the $0.7 level is a probable target before a longer-term destination of $0.9.
Yet, as the RSI has recently entered the overbought region, a short-term pullback to the $0.6 level and the 200-day moving average located nearby is possible before a further bullish continuation.
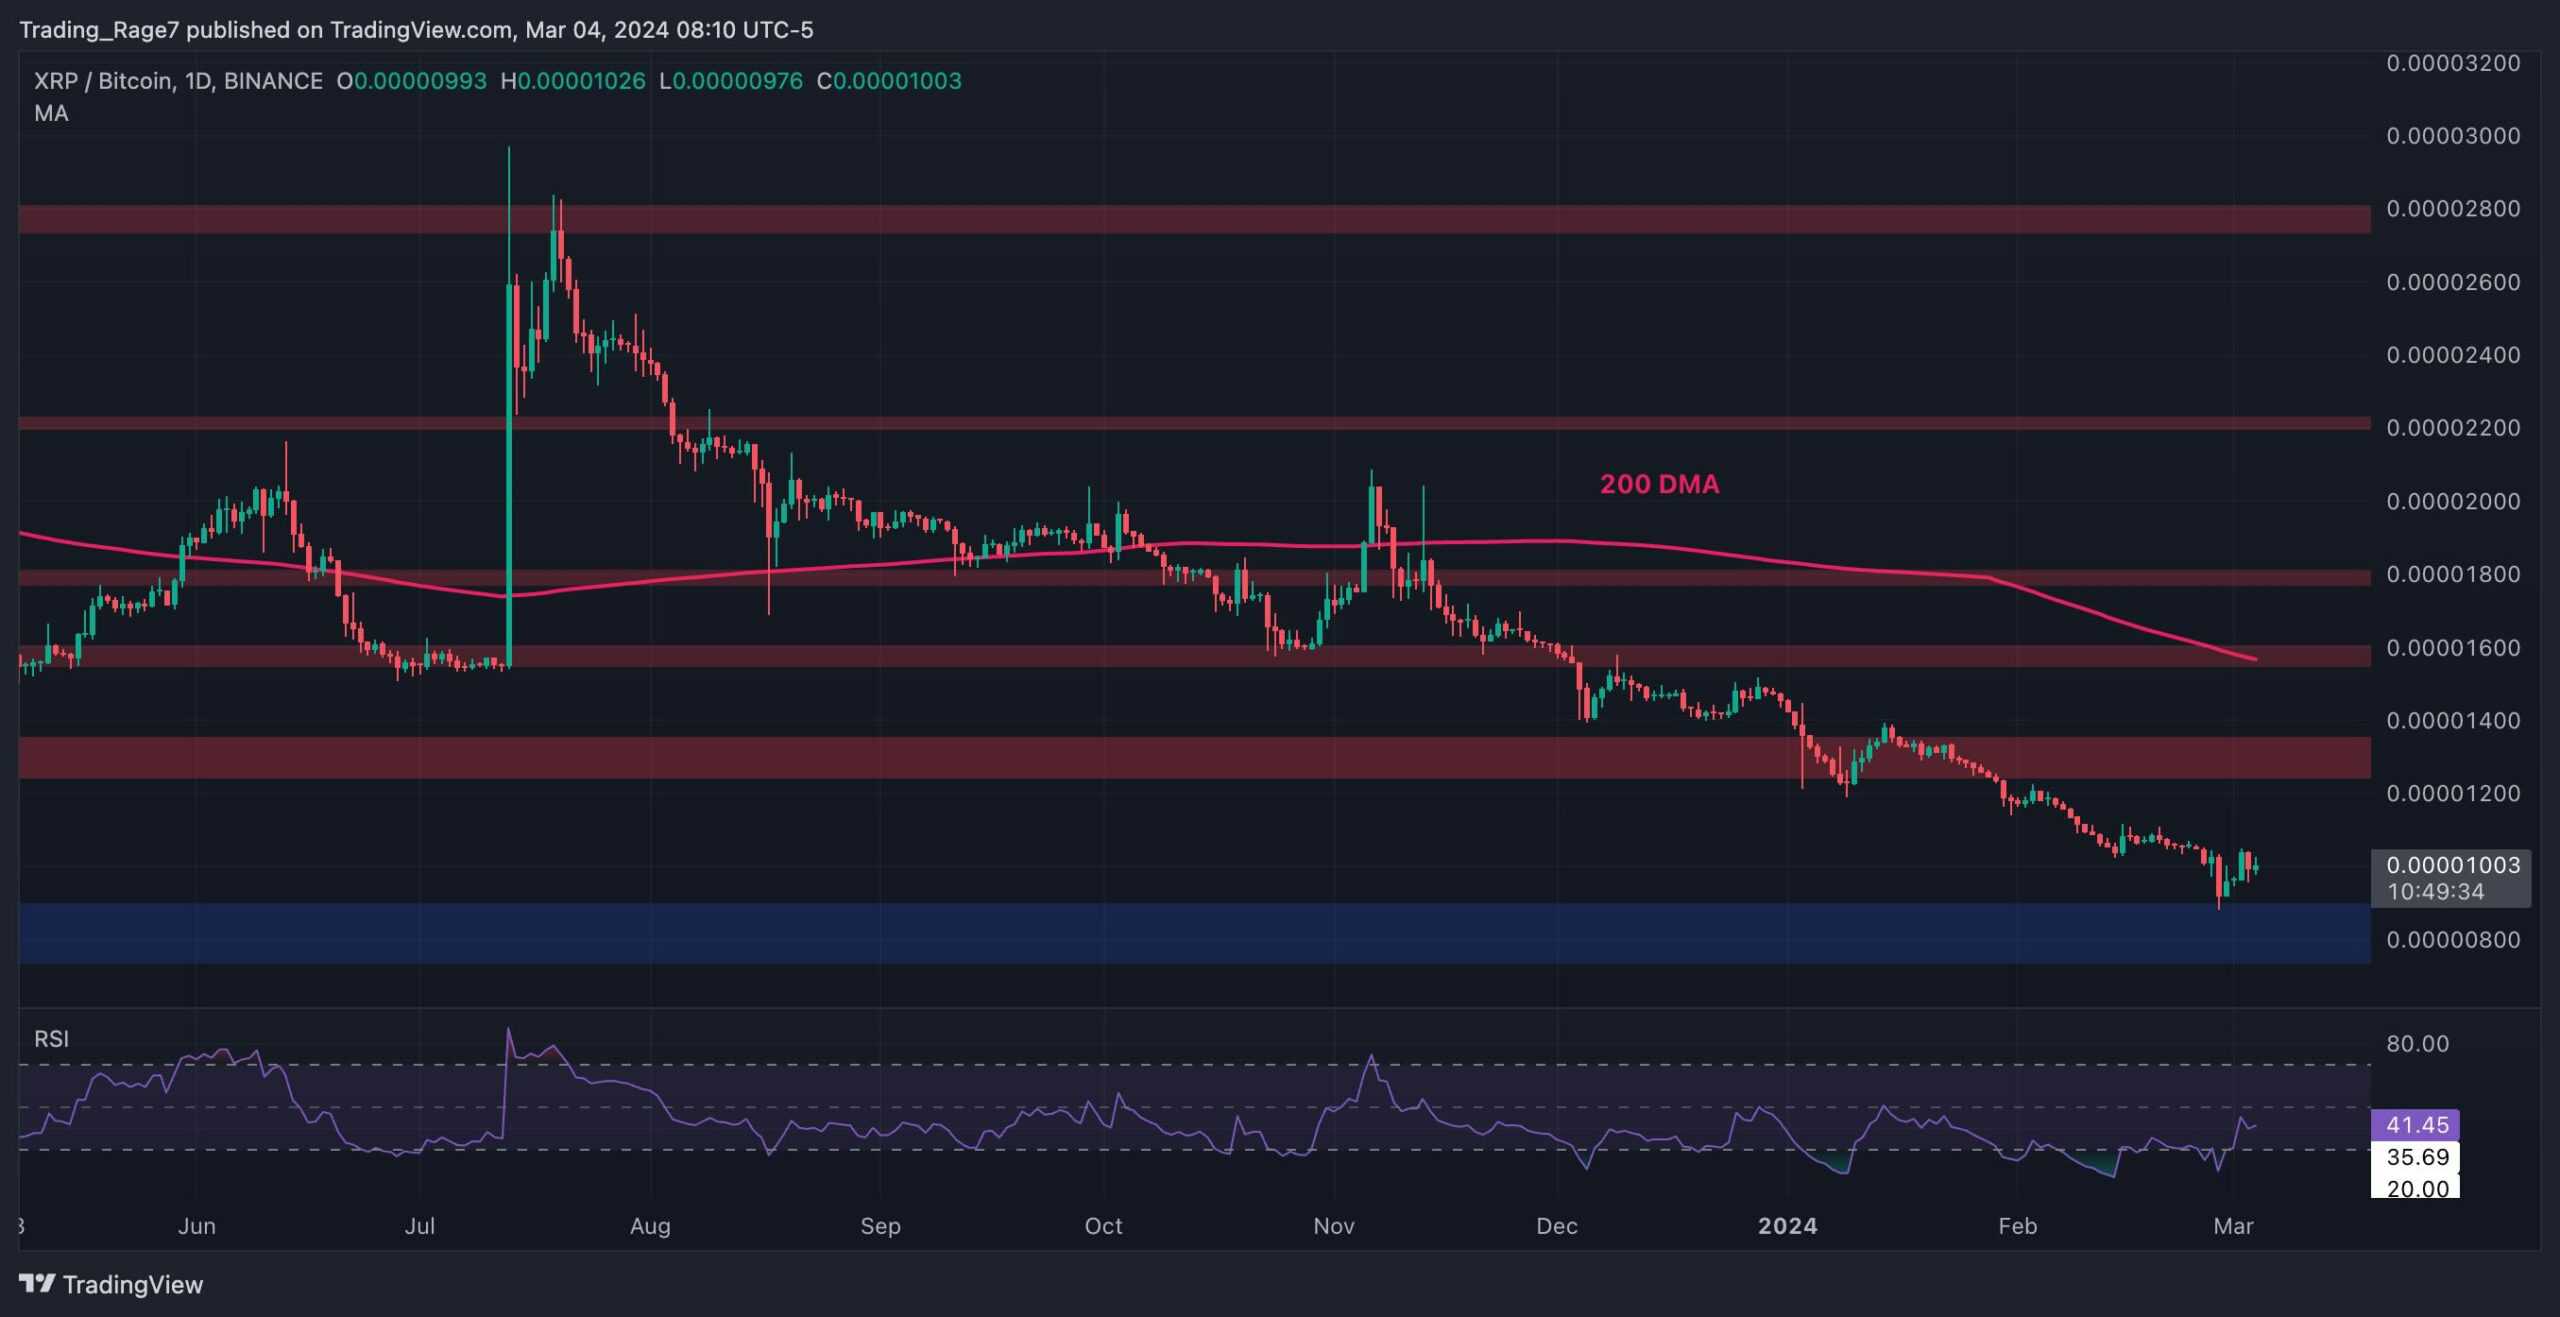
The BTC Paired Chart
On the Bitcoin pair, things look quite different in the grand scheme of things. Yet, the price is showing some signs of recovery.
The market has recently tested the 800 SAT long-term support area and rebounded slightly higher. If the price finds a bottom around this zone, the first target for a potential uptrend would be the 1300 SAT resistance zone, followed by the 200-day moving average located around the 1600 SAT area.
If these two levels get broken to the upside, investors can expect Ripple to outperform Bitcoin for a while.
The post Traders Anticipate an XRP Bull Run Following the Surge to $0.65 (Ripple Price Analysis) appeared first on CryptoPotato.