This is ETH’s Last Line of Defense Before a Major Potential Crash (Ethereum Price Analysis)
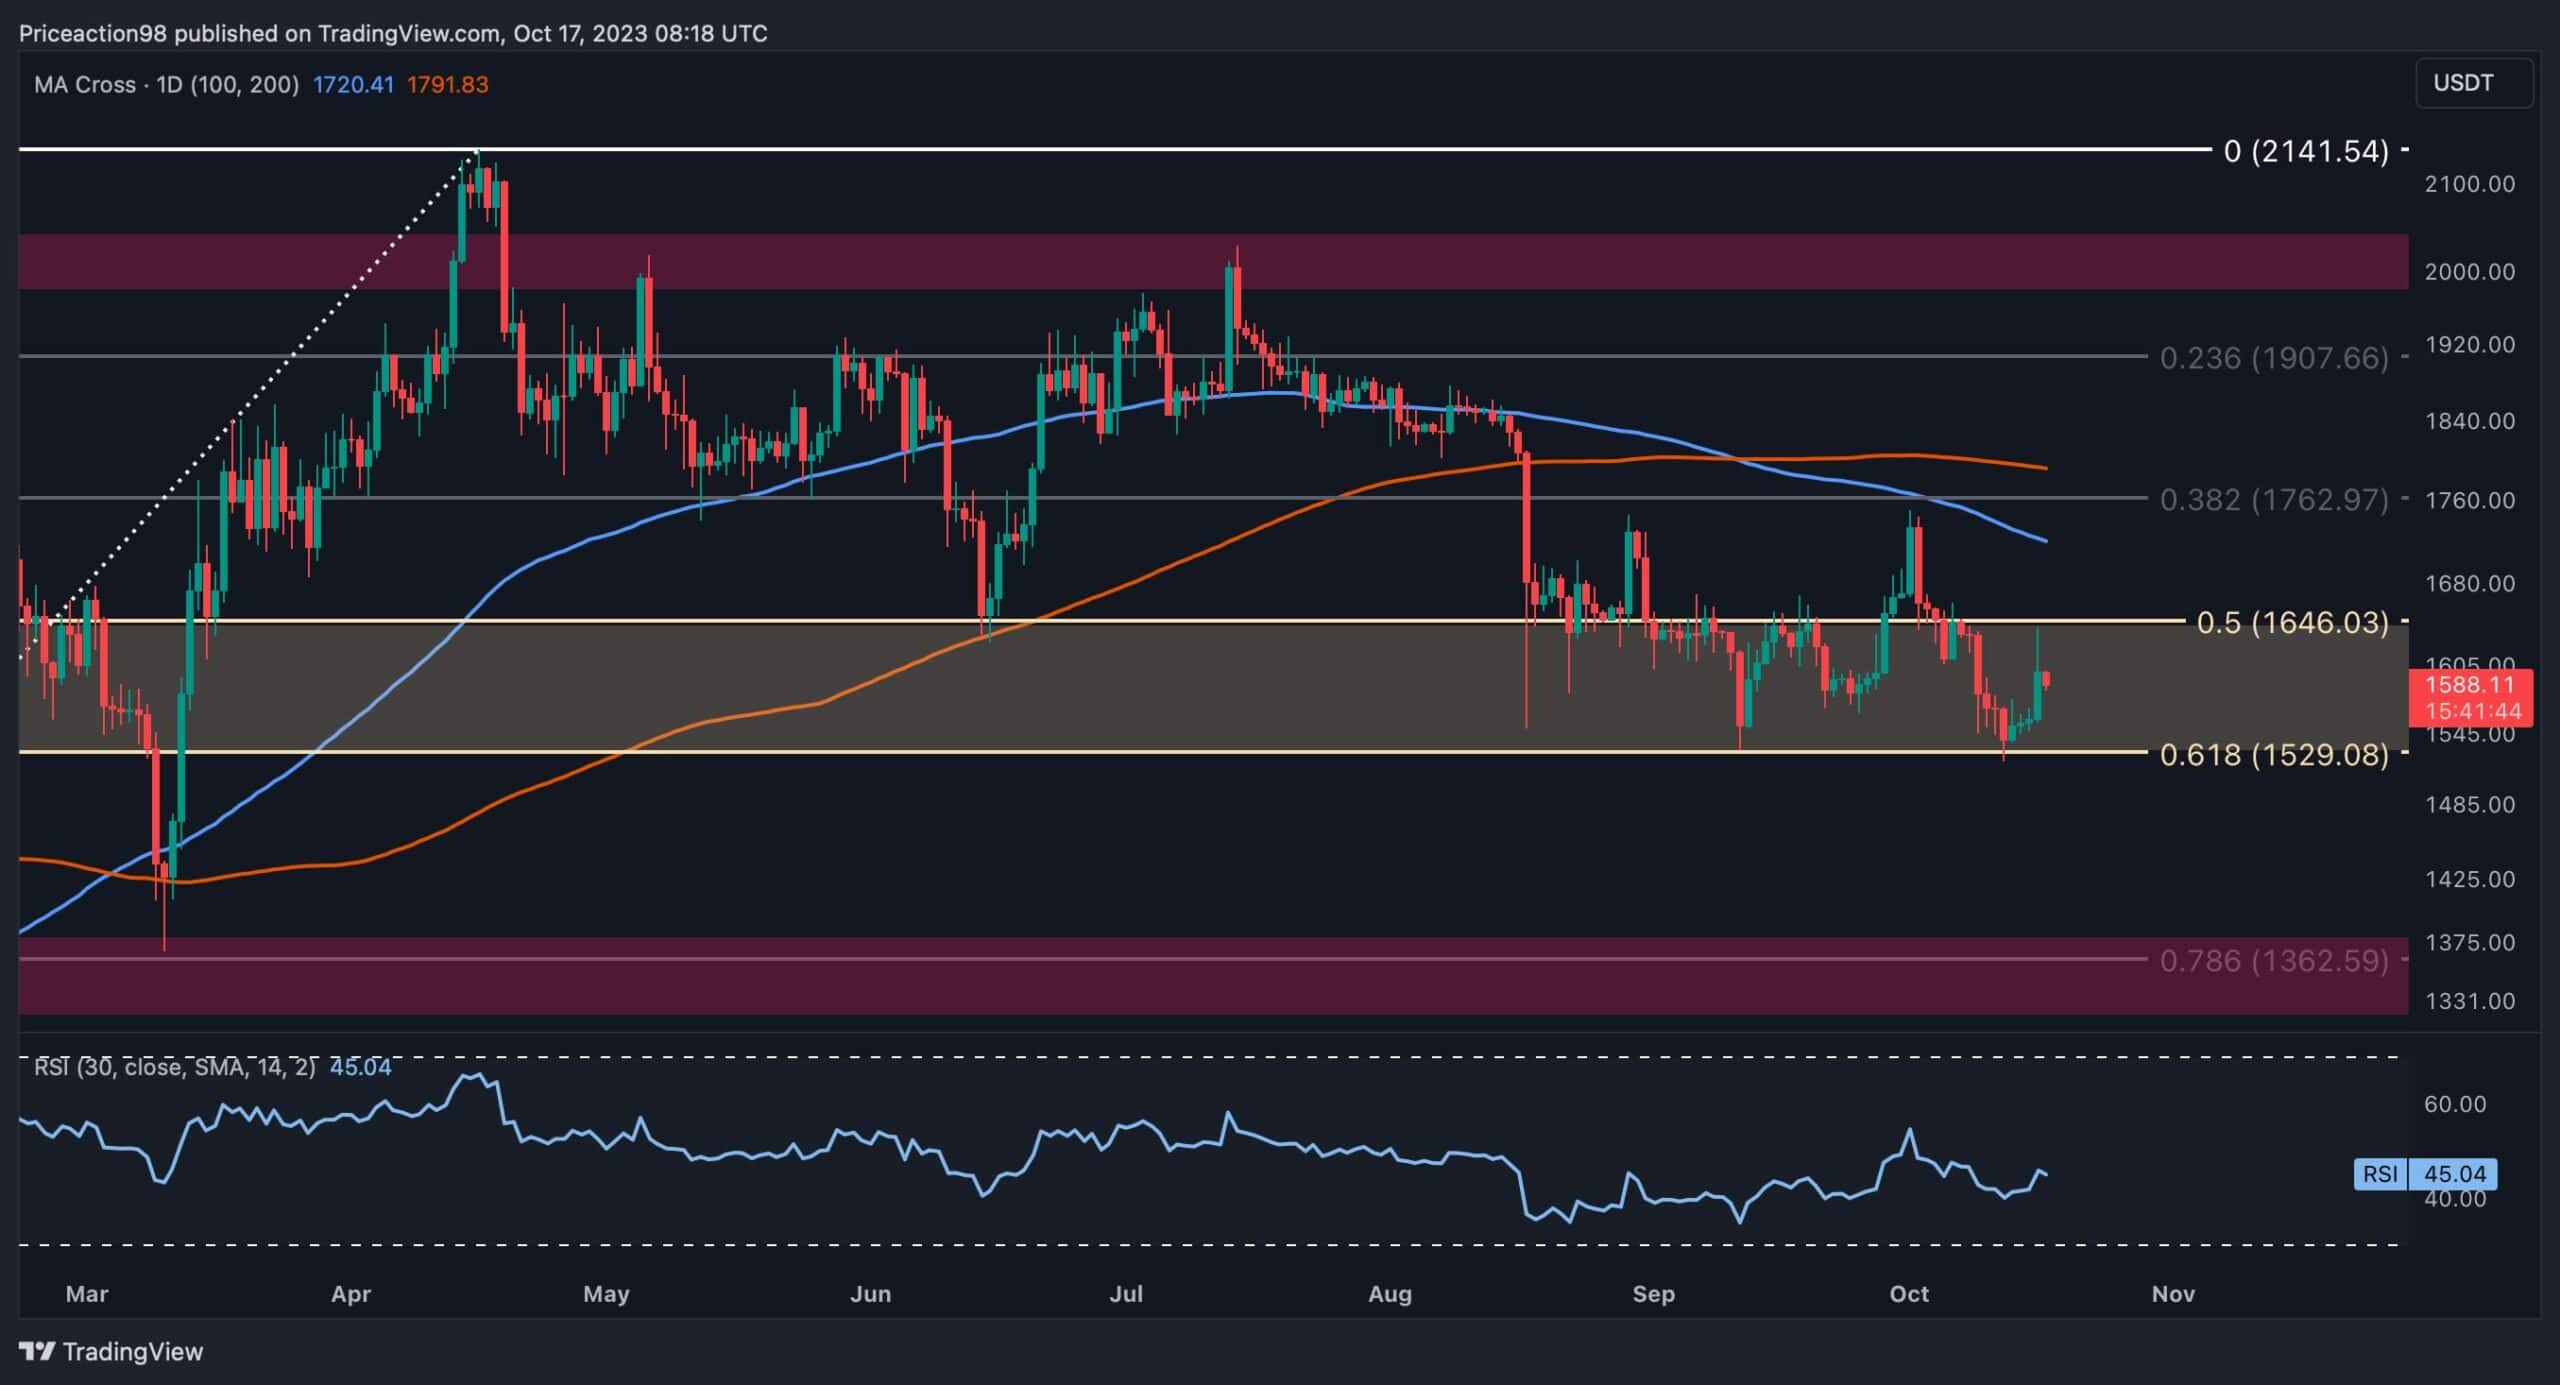
After being forcefully rejected from the 100-day moving average, Ethereum experienced a rapid decline, finding support at the critical level of the 61.8% Fibonacci retracement.
This level coincides with the previous major swing low at $1529, serving as a last line of defense for the bulls. A breach below this point could trigger a rapid market cascade.
Technical Analysis
By Shayan
The Daily Chart
Examining the daily chart, Ethereum’s trajectory turned highly bearish after the rejection from the 100-day moving average at around $1.7K. It completed a pullback and validated the breakout, ultimately landing at the 61.8% Fibonacci threshold, where it found support.
The recent rebound signals a potential bullish shift, but this scenario will only materialize if demand substantially increases, leading to the formation of larger bullish candles. The viability of this potential bullish reversal depends on the resurgence of buyer dominance in the market.
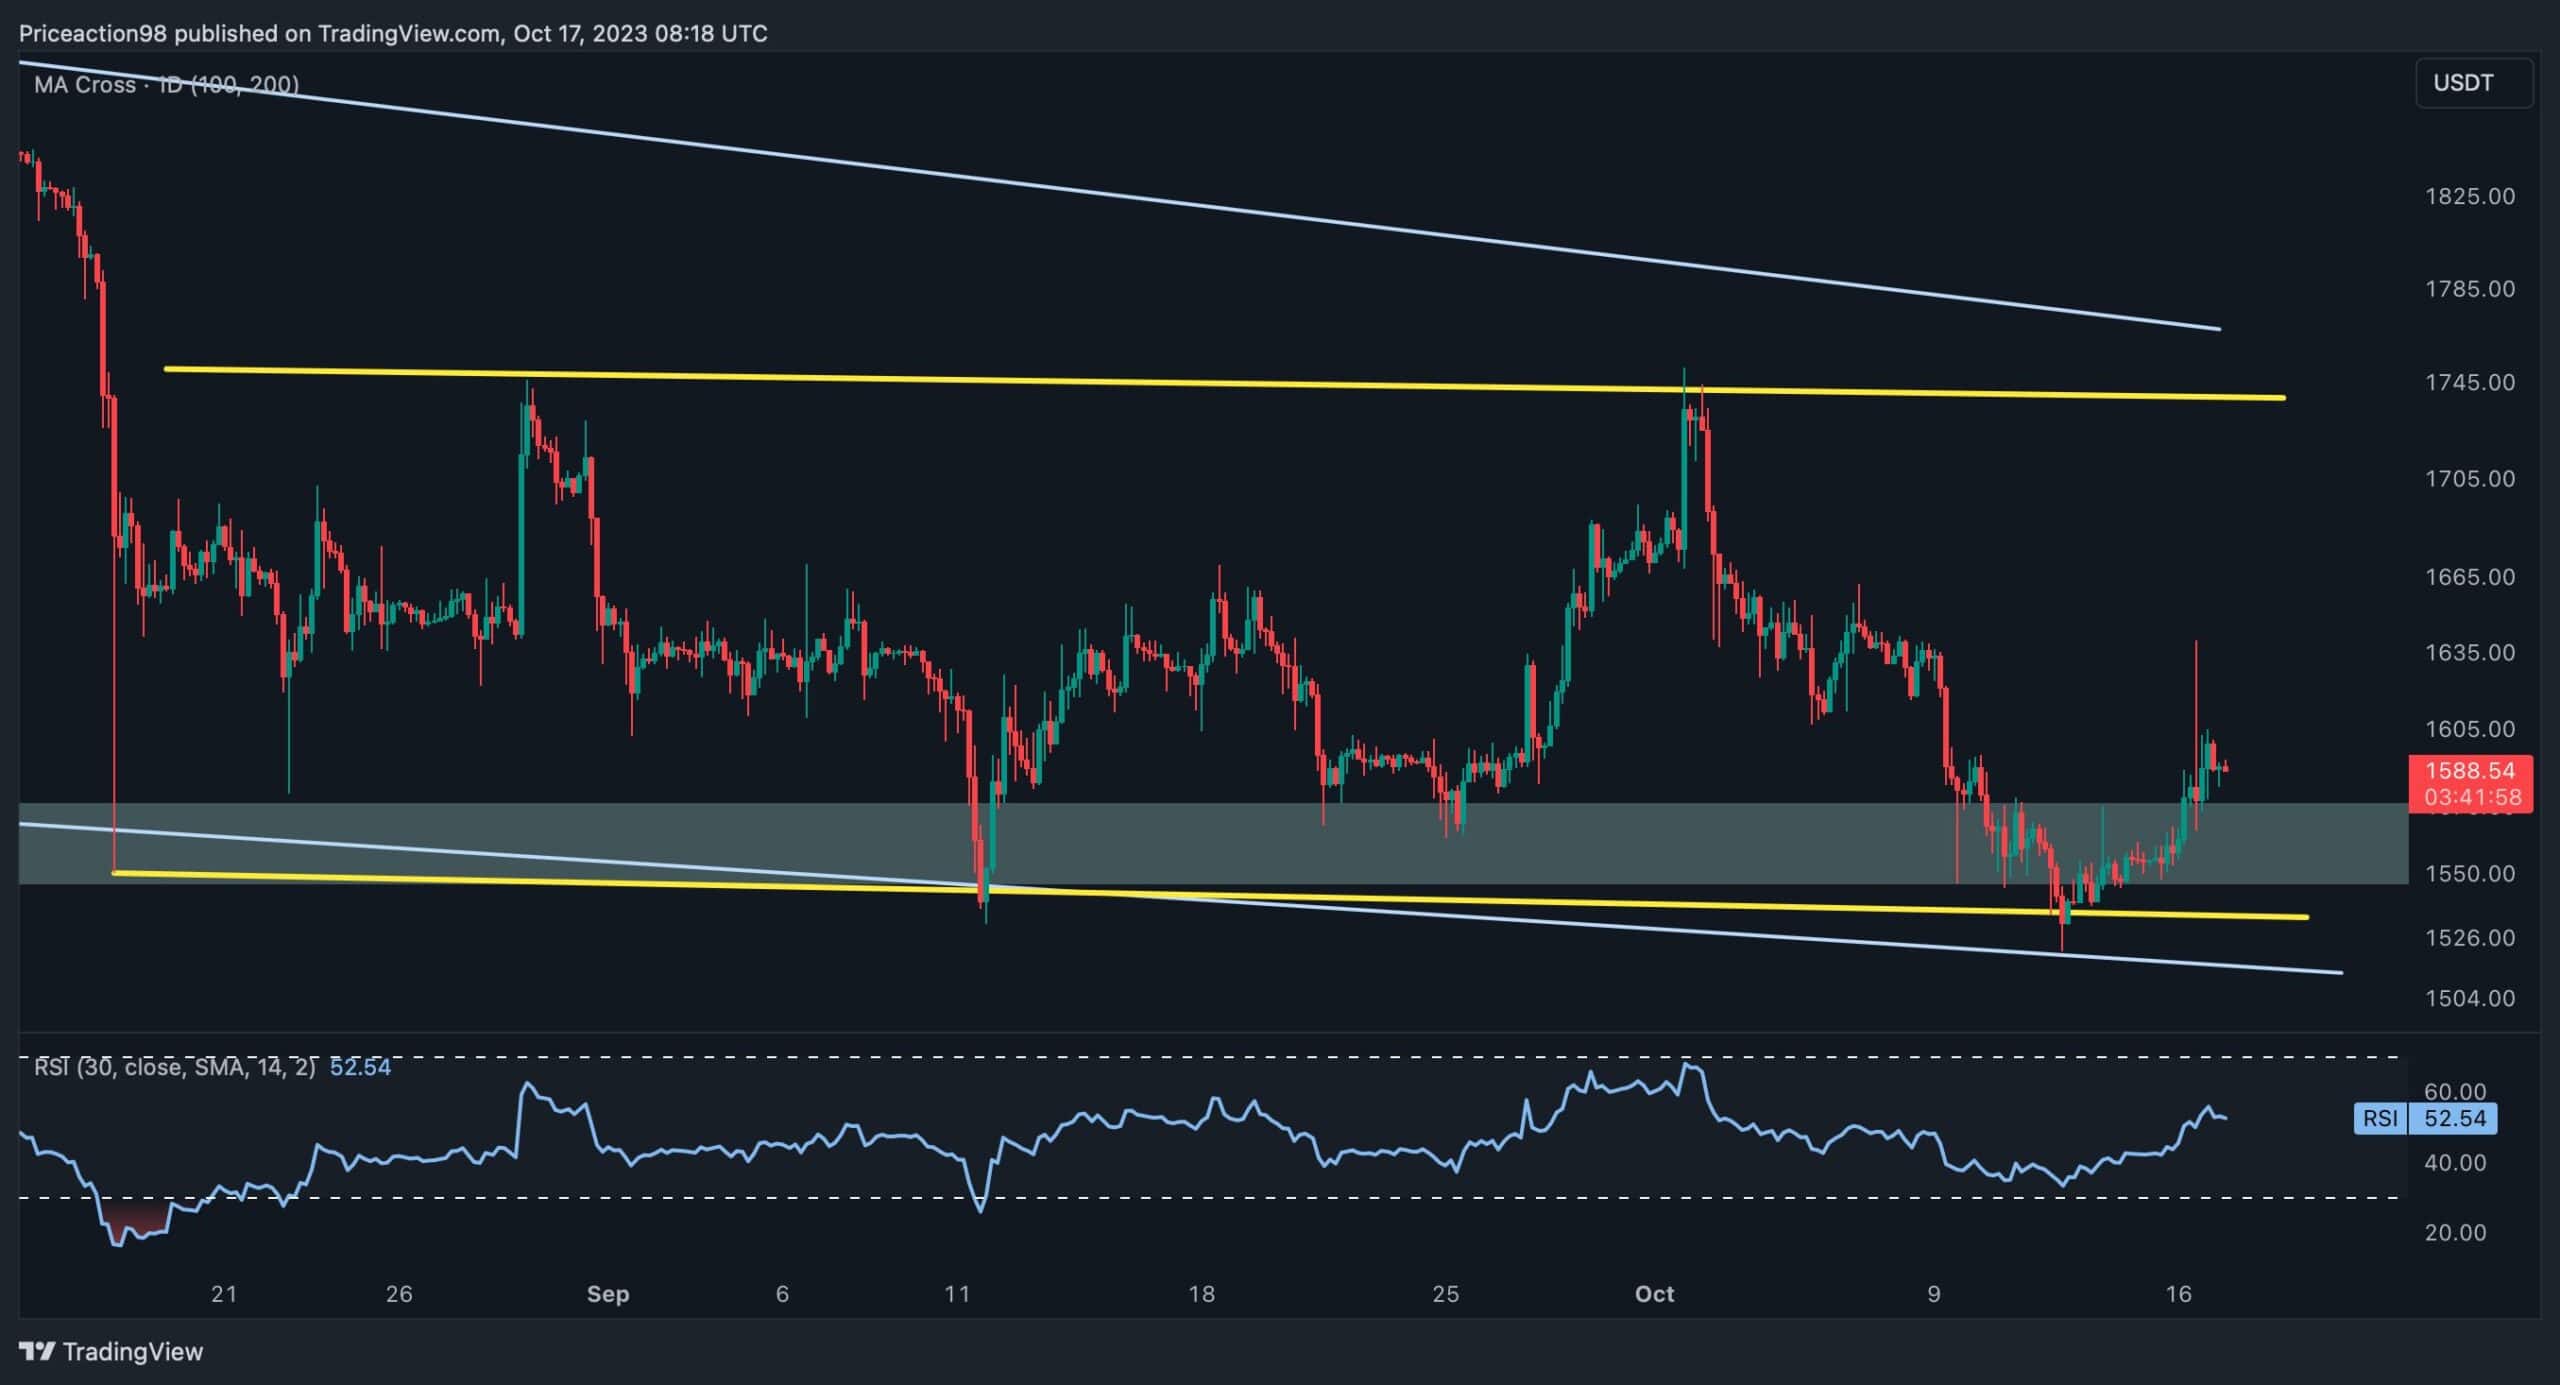
The 4-Hour Chart
Analyzing the 4-hour chart, a period of sideways consolidation is visible, marked by a descending wedge pattern. This consolidation range is confined by the significant $1.5K support and the notable $1.7K resistance. Following a recent downward movement that touched the lower threshold of the wedge, the price found support, resulting in a slight rebound.
However, given Ethereum’s overall bearish prospects and the current rebound lacking significant bullish momentum, a true bullish reversal would require a notable increase in buying pressure, leading to buyer dominance in the market. If buyers manage to overpower sellers, a sudden reversal could occur, potentially leading to the liquidation of numerous short positions.
Regardless of the outcome, closely monitoring price action in the coming days is crucial. Mid-term volatility is expected to rise significantly, shaping the market’s direction. Traders should stay vigilant and prepared for any market shifts to make informed trading decisions.
On-chain Analysis
By Shayan
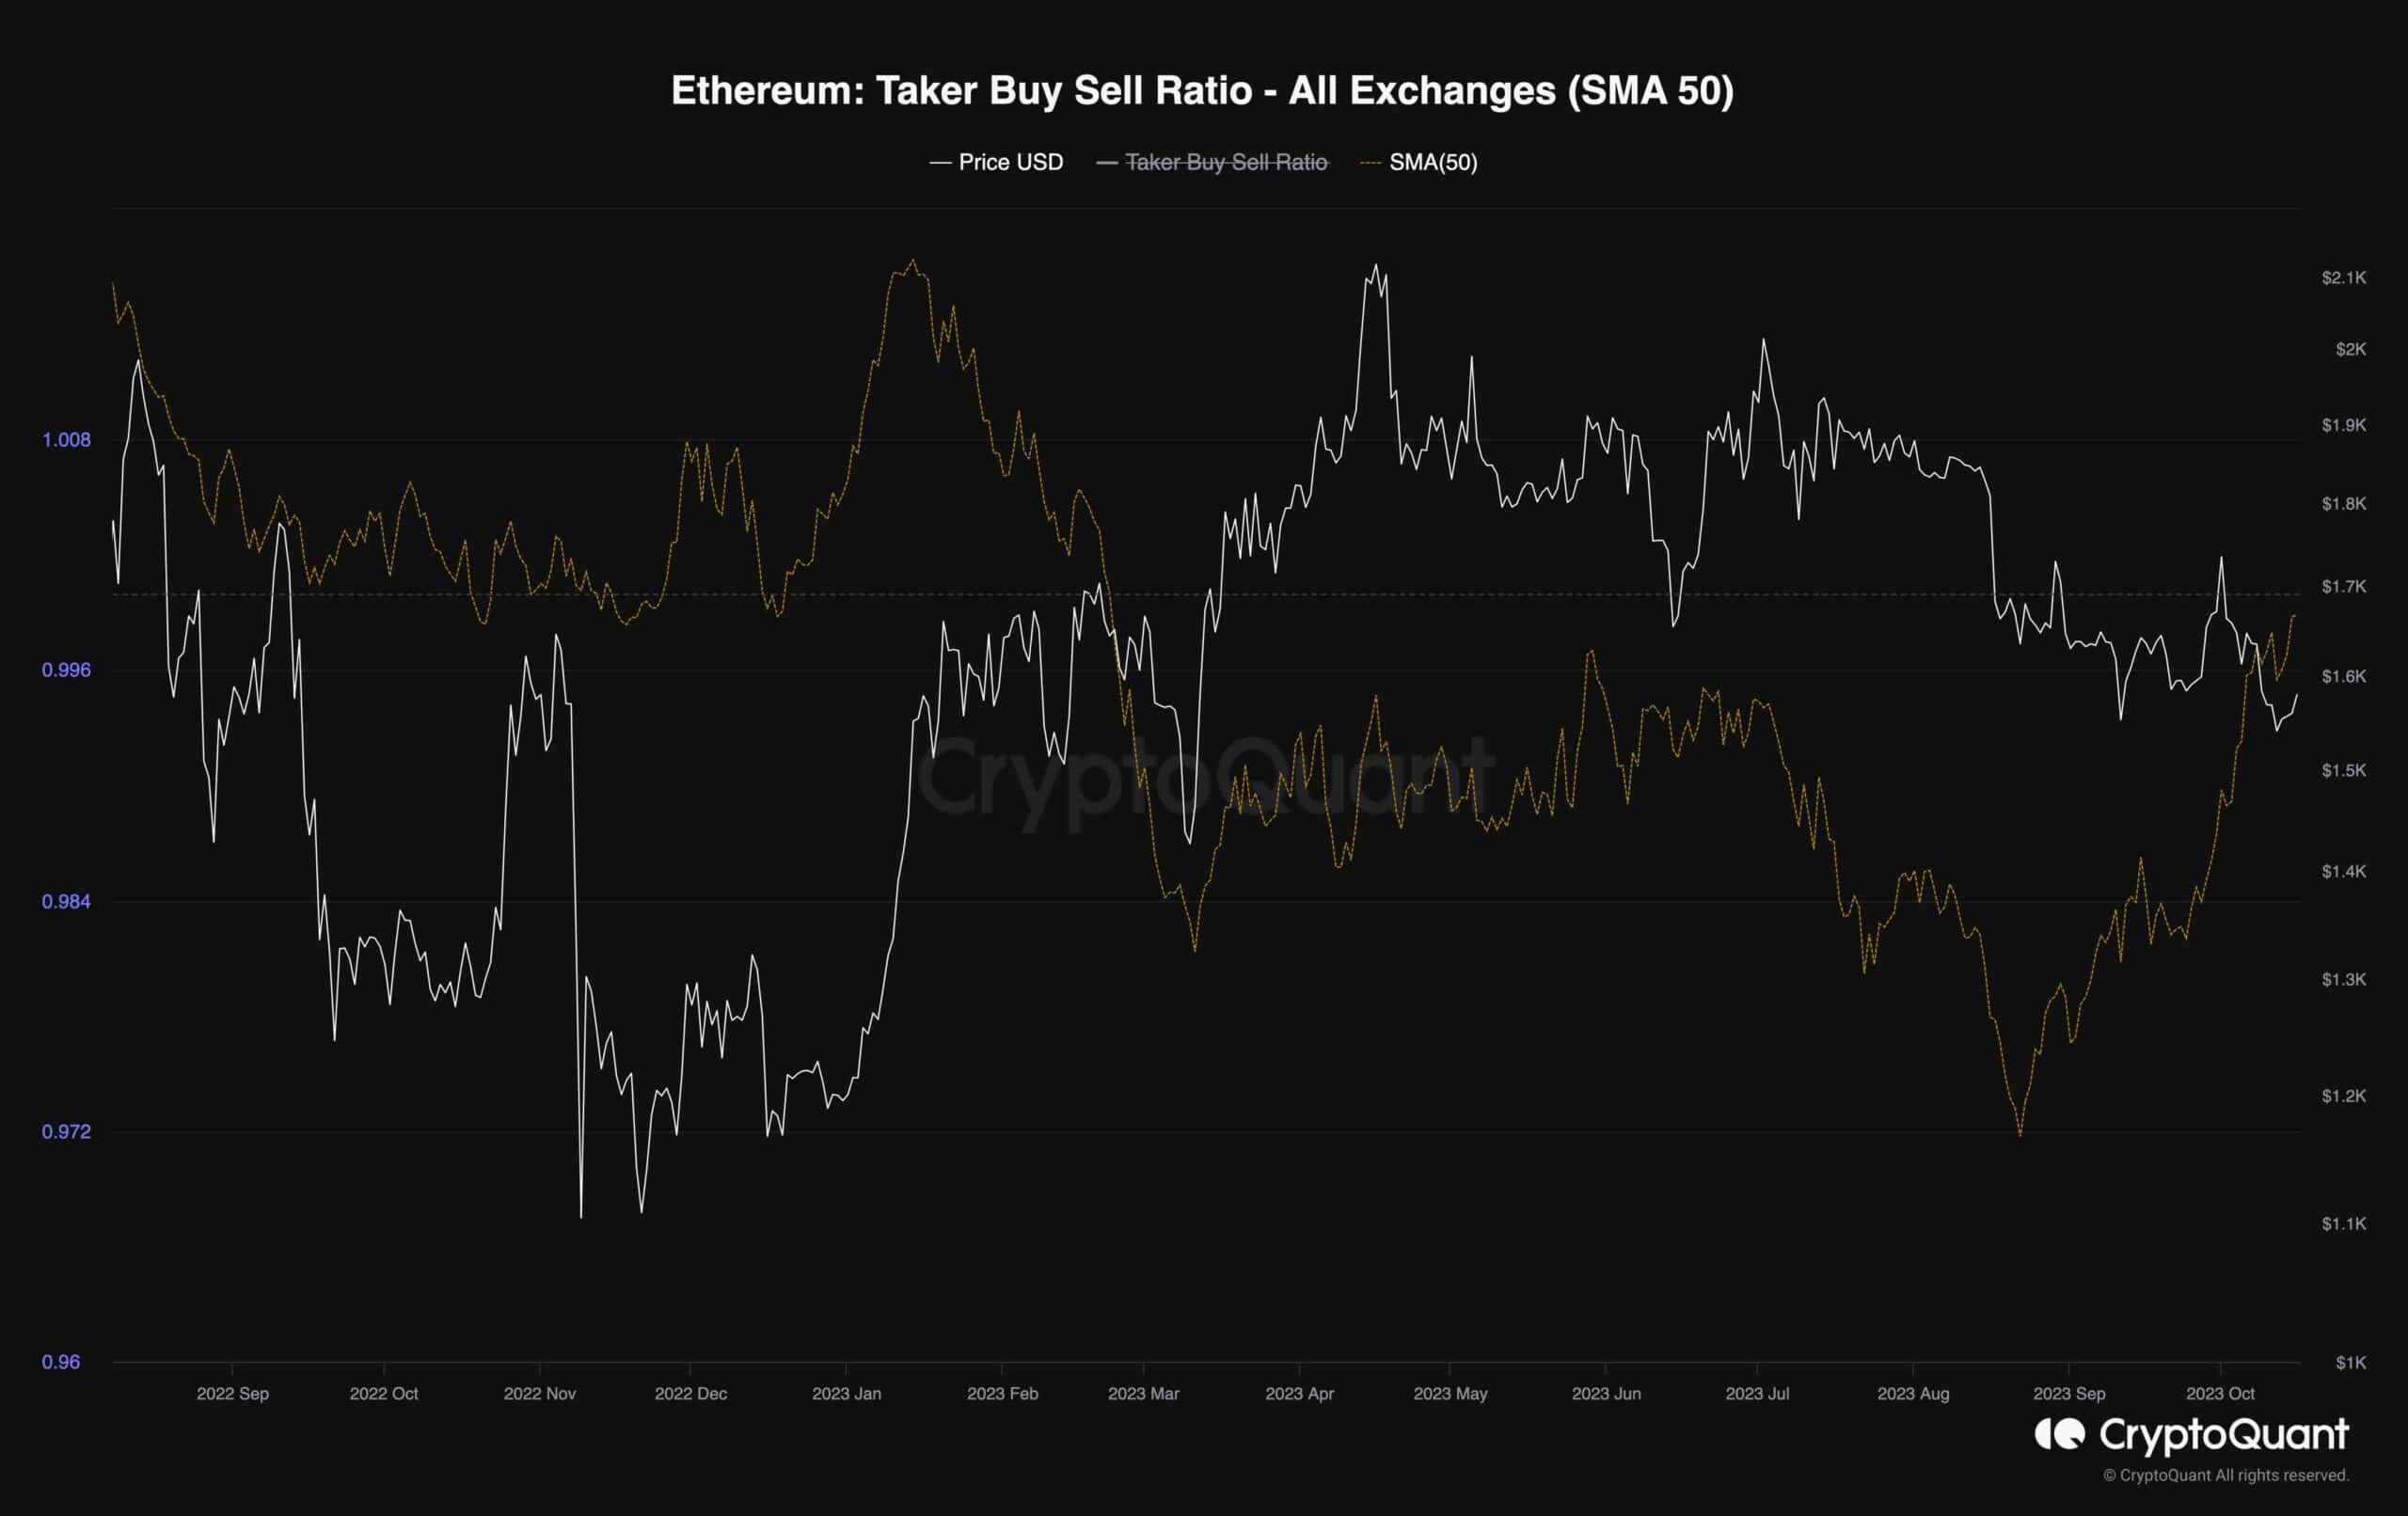
Despite Ethereum’s recent downward trend following its inability to breach the $1.7K resistance region, an intriguing development in the futures market signals a notable bullish sentiment.
The chart depicts the taker buy-sell ratio, a crucial metric for evaluating sentiment in the futures market as it gauges whether buyers or sellers are executing more aggressive market orders.
During the recent price decline, the taker buy-sell ratio has experienced a rapid surge, moving closer to the 1 mark. This suggests that market participants view the price depreciation as an opportunity to accumulate and invest in the Ethereum market. If this metric continues to rise above 1, it could pave the way for a bullish market reversal, with the price setting its sights on levels above $2K in the coming months.
This shift in sentiment is significant and suggests that traders and investors have found the current market conditions attractive for long positions. It is crucial to closely monitor this metric as it could provide valuable insights into Ethereum’s future price movements and potential opportunities for traders.
The post This is ETH’s Last Line of Defense Before a Major Potential Crash (Ethereum Price Analysis) appeared first on CryptoPotato.