These Bearish Signs Spell Trouble for Bitcoin Amid Rollercoaster at $26K (BTC Price Analysis)
Bitcoin’s price has once again been supported at a key level. However, the downtrend may not be over yet, as there are some very bearish signs on the chart.
Technical Analysis
By Edris
The Daily Chart
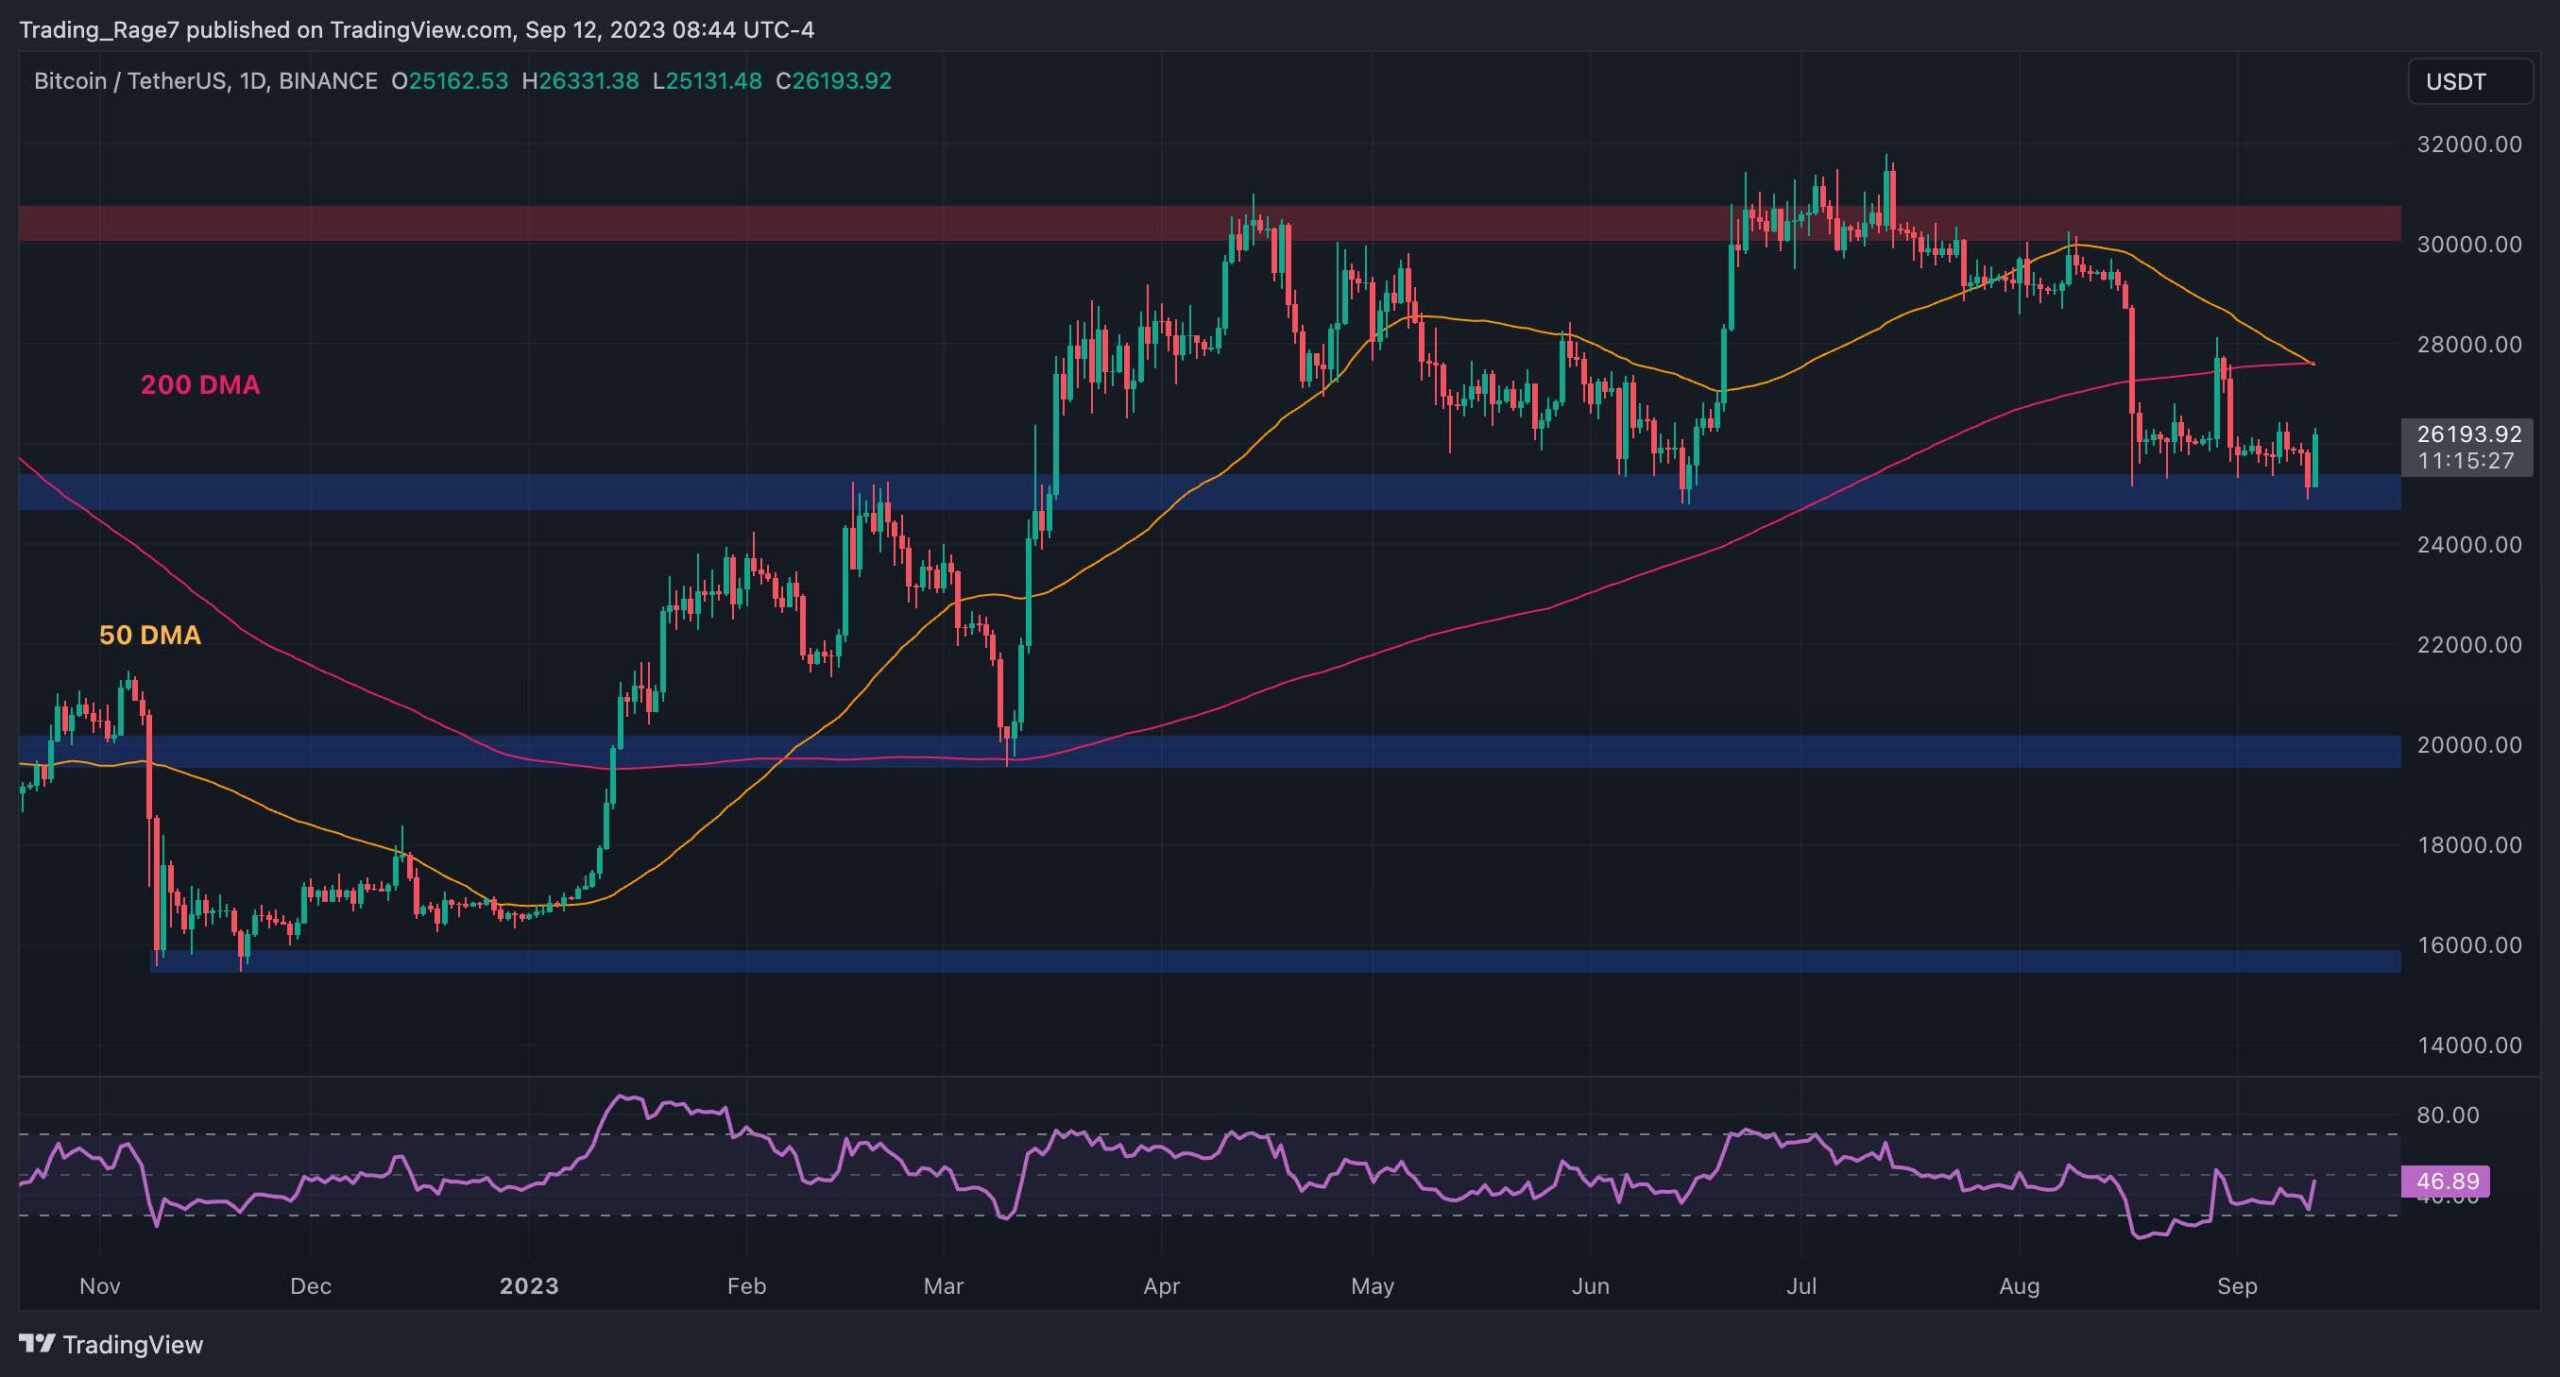
On the daily timeframe, the price has been grappling with the $25K support level for quite a while now. It has rejected the price once more, and the market is seemingly targeting the 50-day and 200-day moving averages.
These indicators have finally demonstrated a bearish crossover around the $28K mark, with the 50-day dropping below the 200-day. This is a strong negative trend shift signal, and the price might finally break below $25K and even decline toward $20K.
The 4-Hour Chart
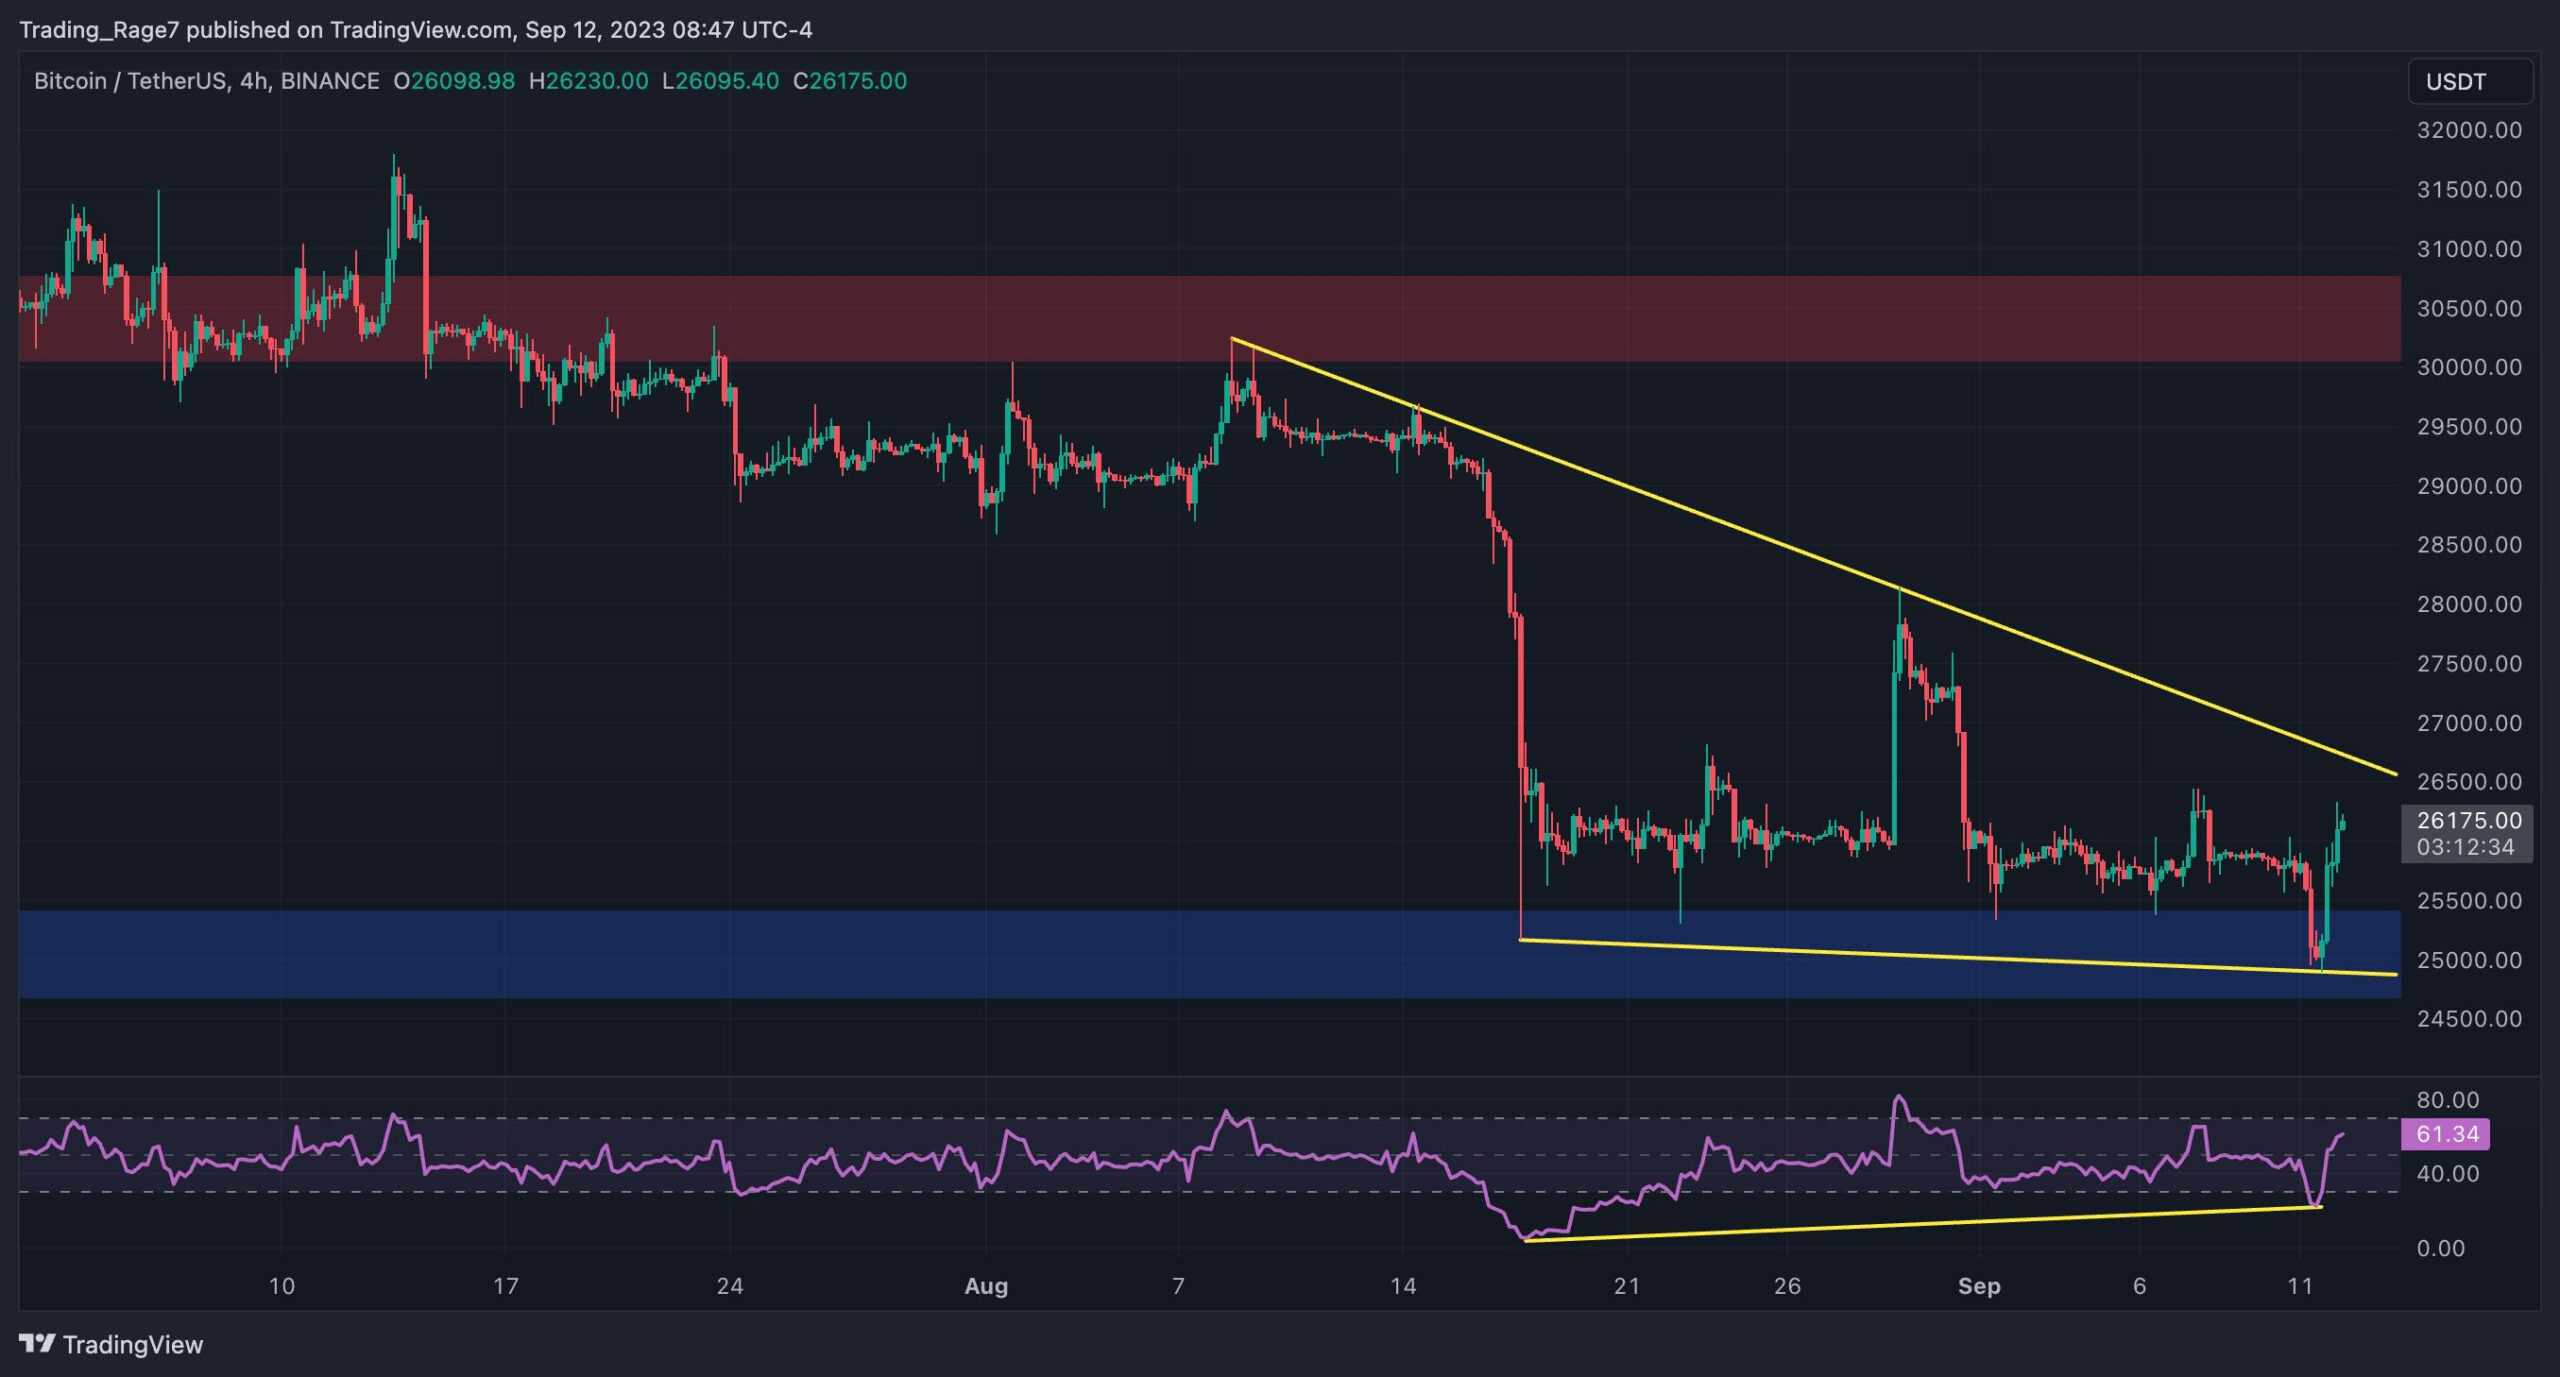
On the 4-hour timeframe, things look a bit better for BTC. The price has been forming a large falling wedge pattern with the lower boundary located at the $25K support level. The price is currently trending toward the higher trendline of the pattern, and in case a bullish breakout occurs, a rise back to the $30K resistance zone will be highly probable.
The RSI indicator is also showing a clear bullish divergence between the two recent price lows, adding to the probability of a bullish move in the short term.
While the signals on the two timeframes analyzed in this post contradict each other, the higher timeframe is always stronger than the lower one. Moreover, Bitcoin’s market trend cannot be considered bullish again until it breaks the $30K level to the upside.
Onchain Analysis
By Shayan
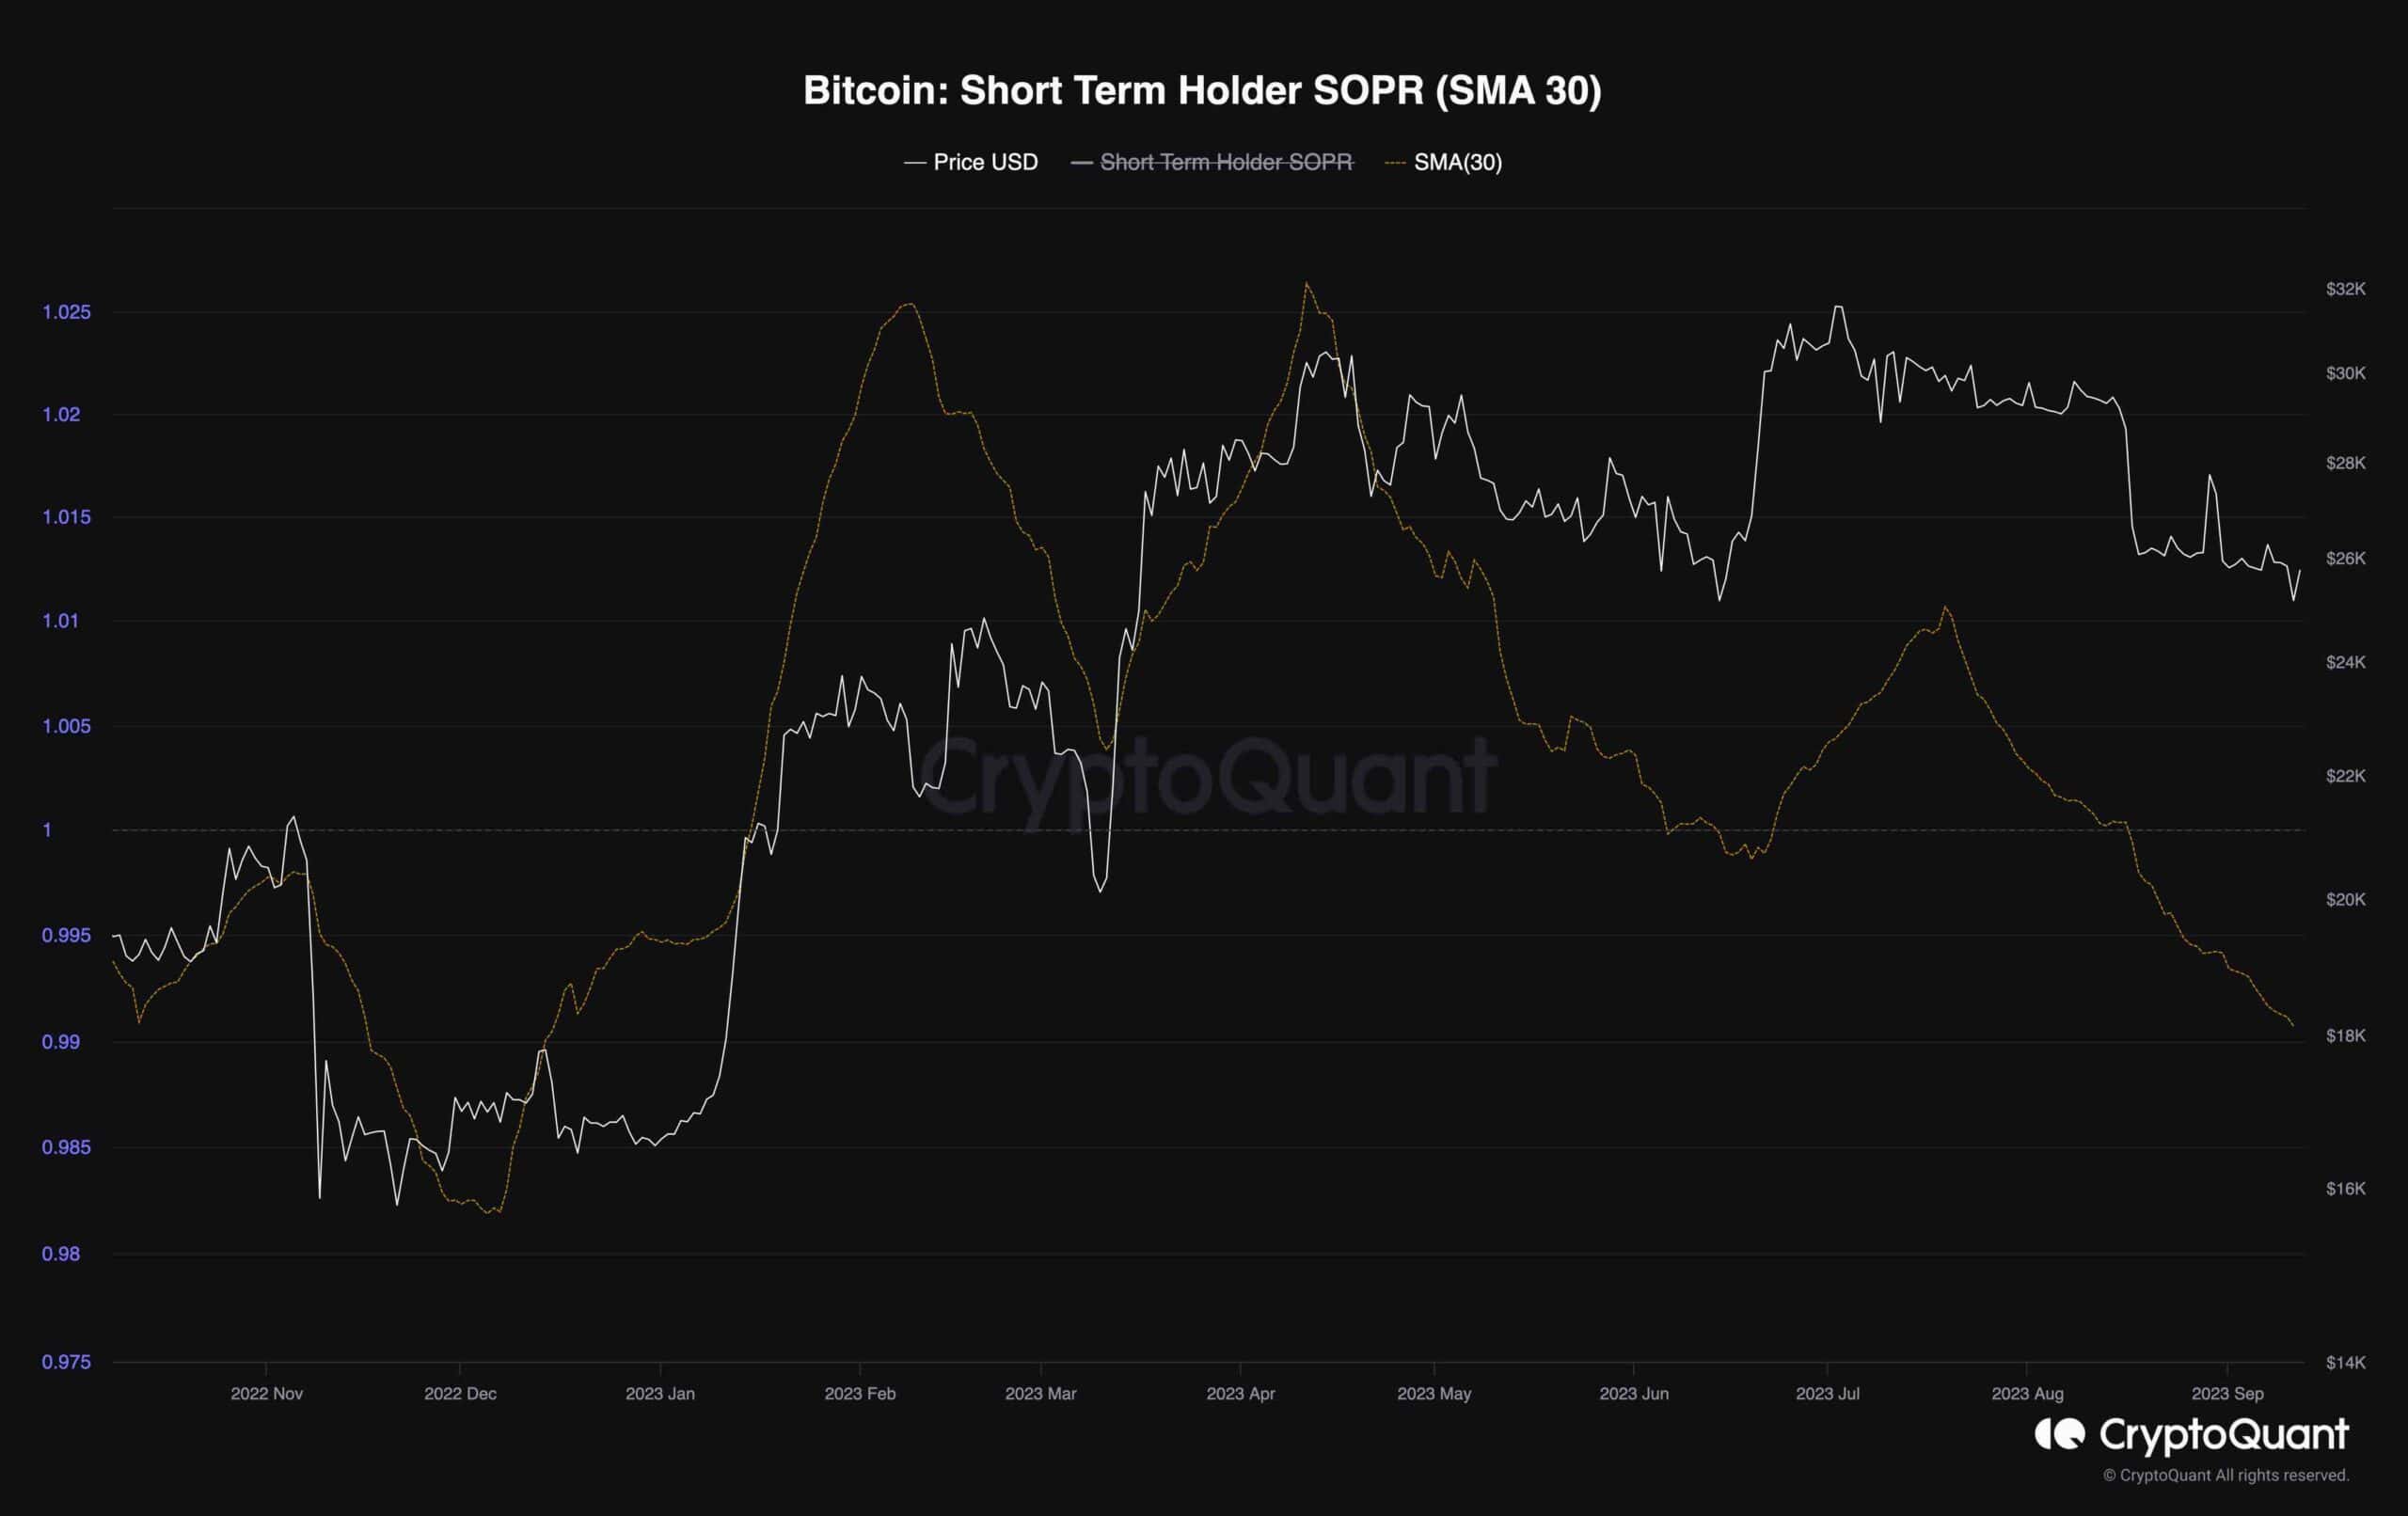
Despite a substantial 100% rally in Bitcoin’s price, it is notable that short-term holders are currently offloading their coins at a loss. The magnitude of these losses is comparable to what was observed a few months ago when Bitcoin was trading around the $17K range.
According to the STH-SOPR indicator, opportune times to accumulate Bitcoin typically coincide with a majority of short-term holders parting with their assets at a loss. Historical data has shown that during periods when these investors realize significant losses, often indicated by values within 0.95-0.98, it has paved the way for substantial returns in the future.
The last instance of the indicator reaching such a point was back in July 2022, coinciding with Bitcoin hitting a new low at the $19K mark. Should Bitcoin’s price continue to dip below the $25K mark, it is expected that more short-term holders will sell at even greater losses, with the SOPR indicator potentially targeting the values within the above-mentioned range. Hence, before a new upward trend materializes, it is conceivable that the market might witness further bearish sentiment.
The post These Bearish Signs Spell Trouble for Bitcoin Amid Rollercoaster at $26K (BTC Price Analysis) appeared first on CryptoPotato.