The Current Bear Market Officially Becomes The Longest Bear Market in Bitcoin’s 10 Years History
TL;DR
- Bitcoins price history shows that January 31st, 2019 marked the same length of time as the 2013/2014 bear market
- The pattern also indicates that bull and bear market cycles are getting longer, which suggests that volatility is decreasing and the market might be in the process of maturing
If the endless comparison between the Bitcoin chart of 2014 and that of 2018 is somehow correct, we may see soon the reversal point which signals the end of the bear market.
Day trader Jonny Moe observed a pattern from the 2013-2014 bear market that resembled what we see today:
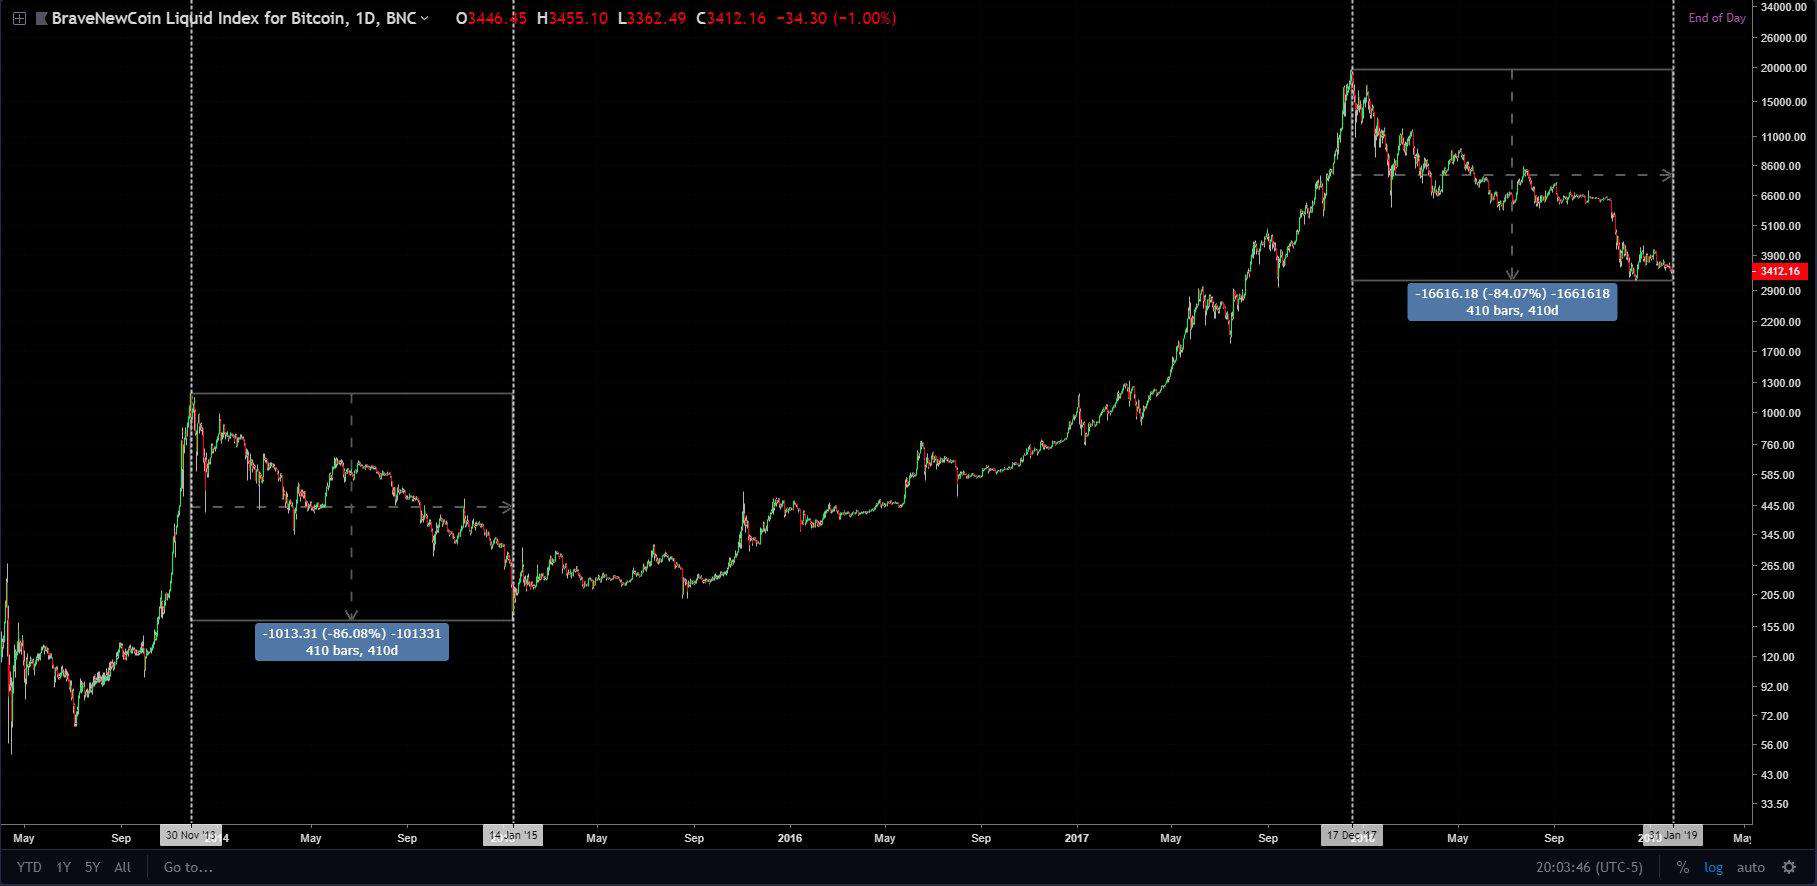
As can be seen, after slightly more than a year-long downtrend that started in November 2013, the market finally reversed on January 14th, 2015. This doesn’t mean that the market had turned bullish: There was a long consolidation year before the rally started.
The total period for the bear market of 2014 was 410 days, and within that period, the price of bitcoin dropped by 86.08%.
If we observe the current bear market, which started on December 2017 following Bitcoin’s high of $20,000, the bear market had continued since then, while Bitcoin records the price of 84.07% decline from its highest point.
Market Cycles Last Longer
We can also notice that bull and bear market cycles will become longer and less volatile over time. This is a typical sign one sees in a maturing market. In the beginning, when an asset is hard to value there is extreme volatility. However, over time as traders become accustomed to seeing the asset valued at a certain price range, it takes longer for that asset to break above or below the price range, leading to longer market cycles.
This is made clear by the fact that the upside move for Bitcoin between 2015 and 2017 took longer than it did between 2011 and 2013.
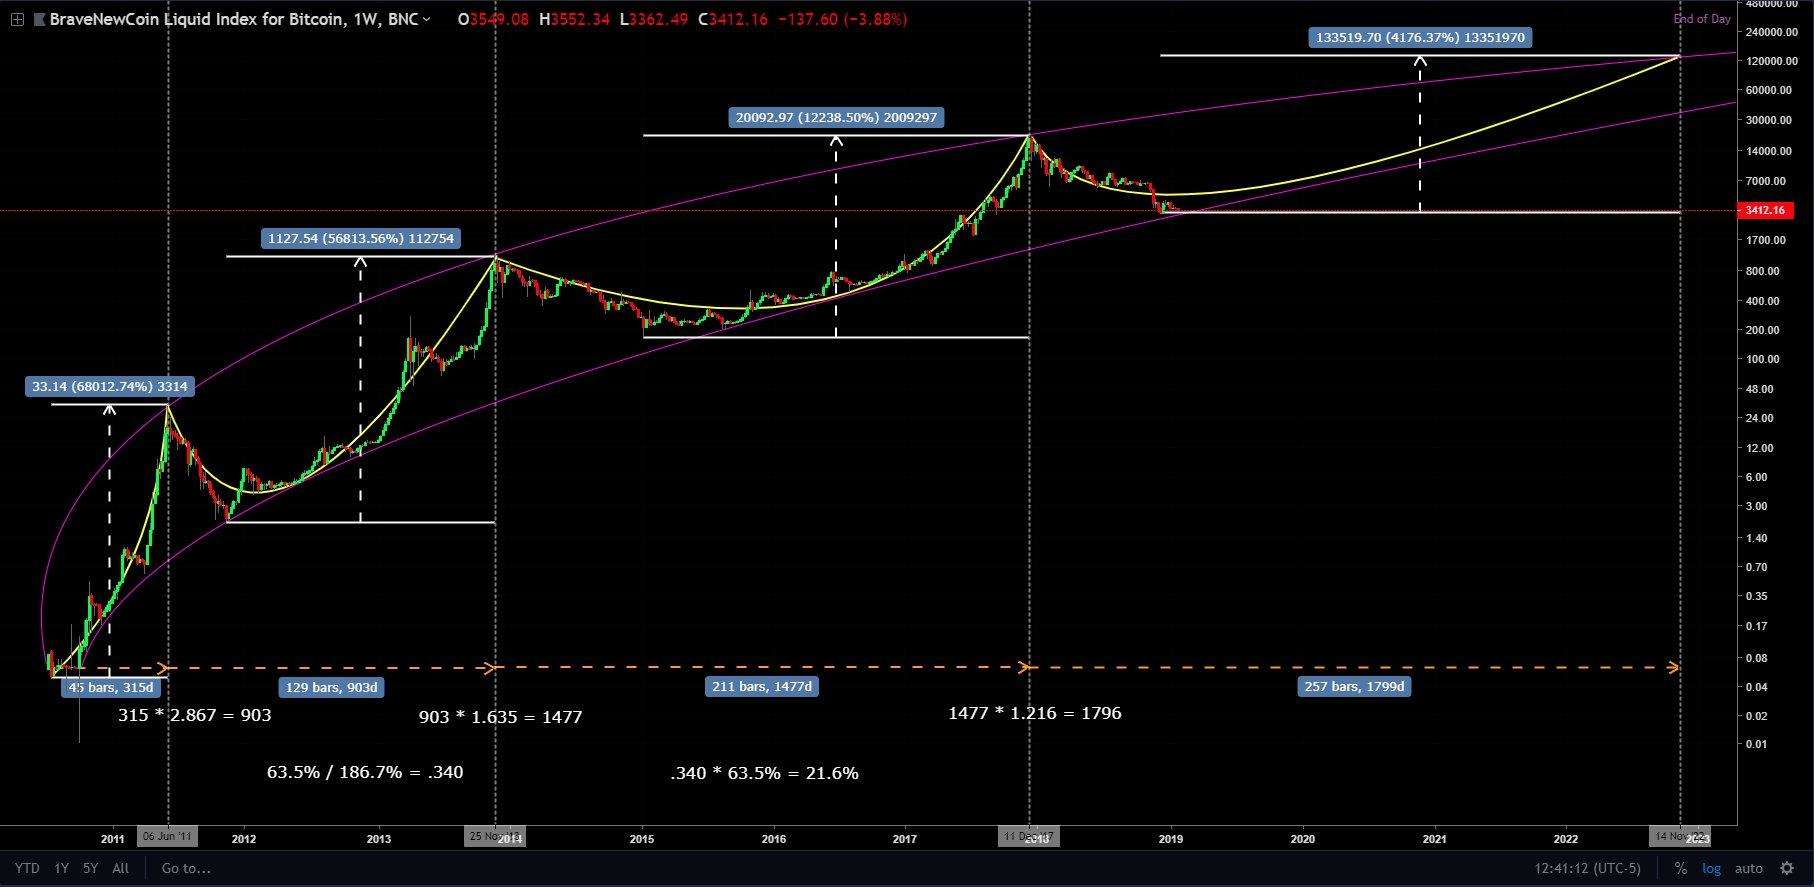
Ultimately, if we are to follow the patterns shown, it means we may be in for a gradual but healthy bull run over the next few years. Though it might not be the most exciting news for day traders, it would be great news for the crypto markets overall.
The post The Current Bear Market Officially Becomes The Longest Bear Market in Bitcoin’s 10 Years History appeared first on CryptoPotato.