SOL Explodes 60% Weekly But How High Can it Reach? (Solana Price Analysis)
Solana’s price doubled since the end of December, and bulls continue to be in control of the price action.
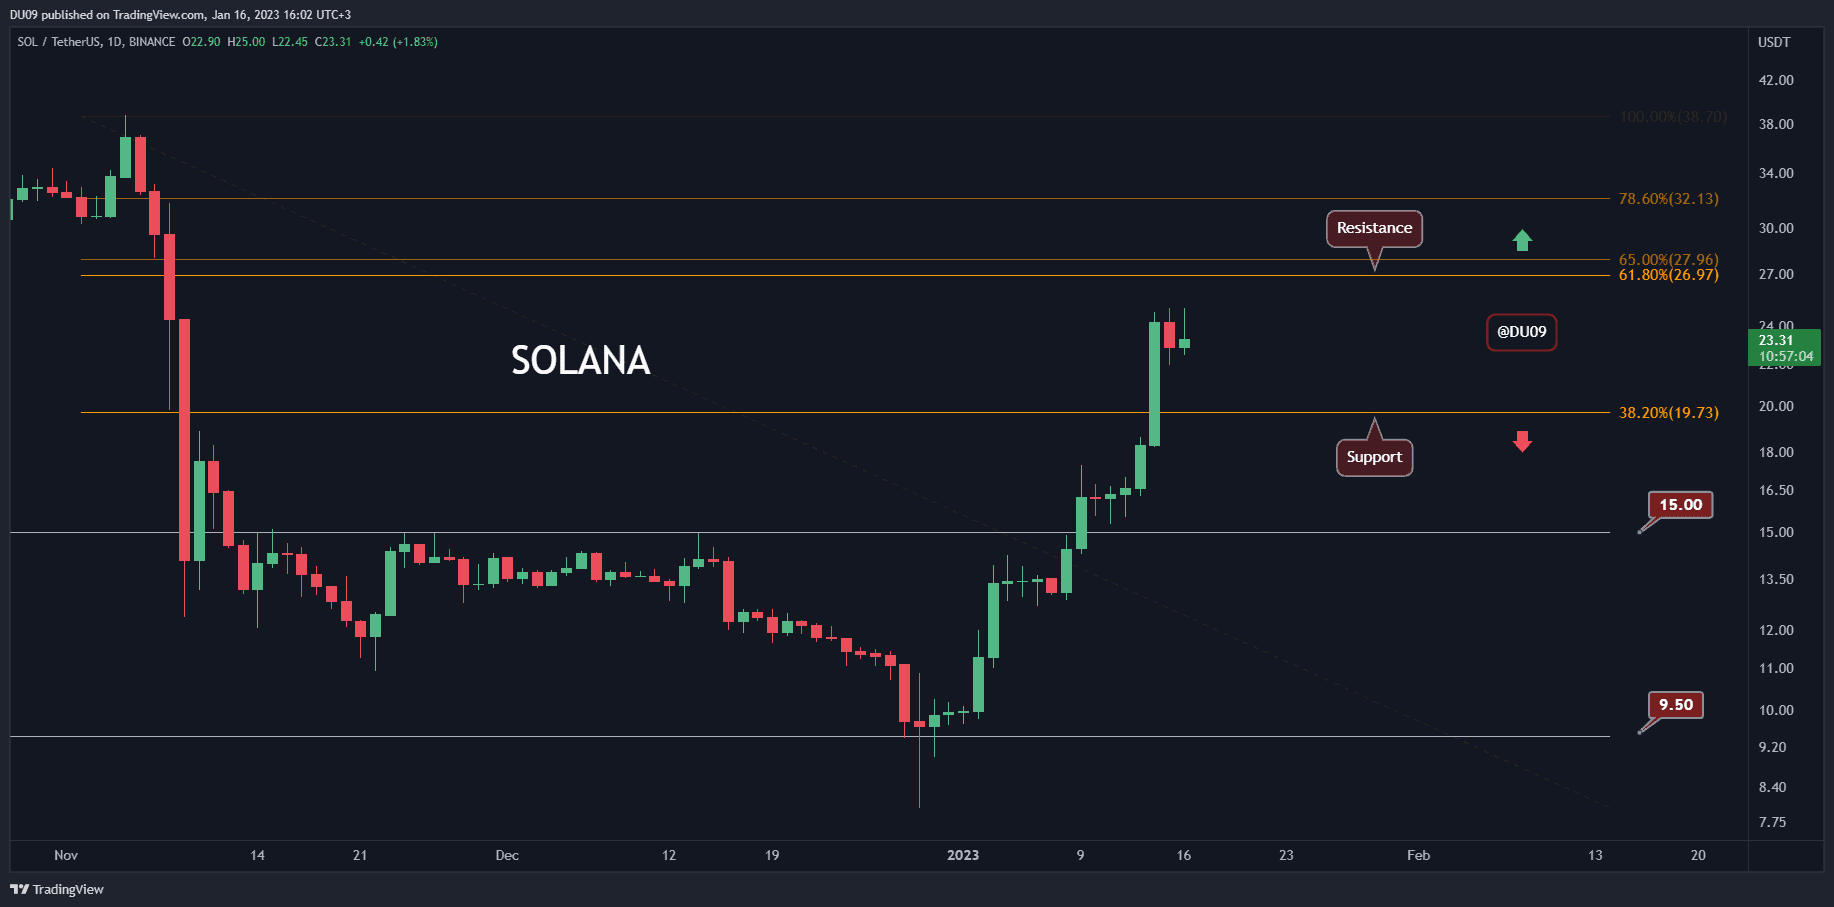
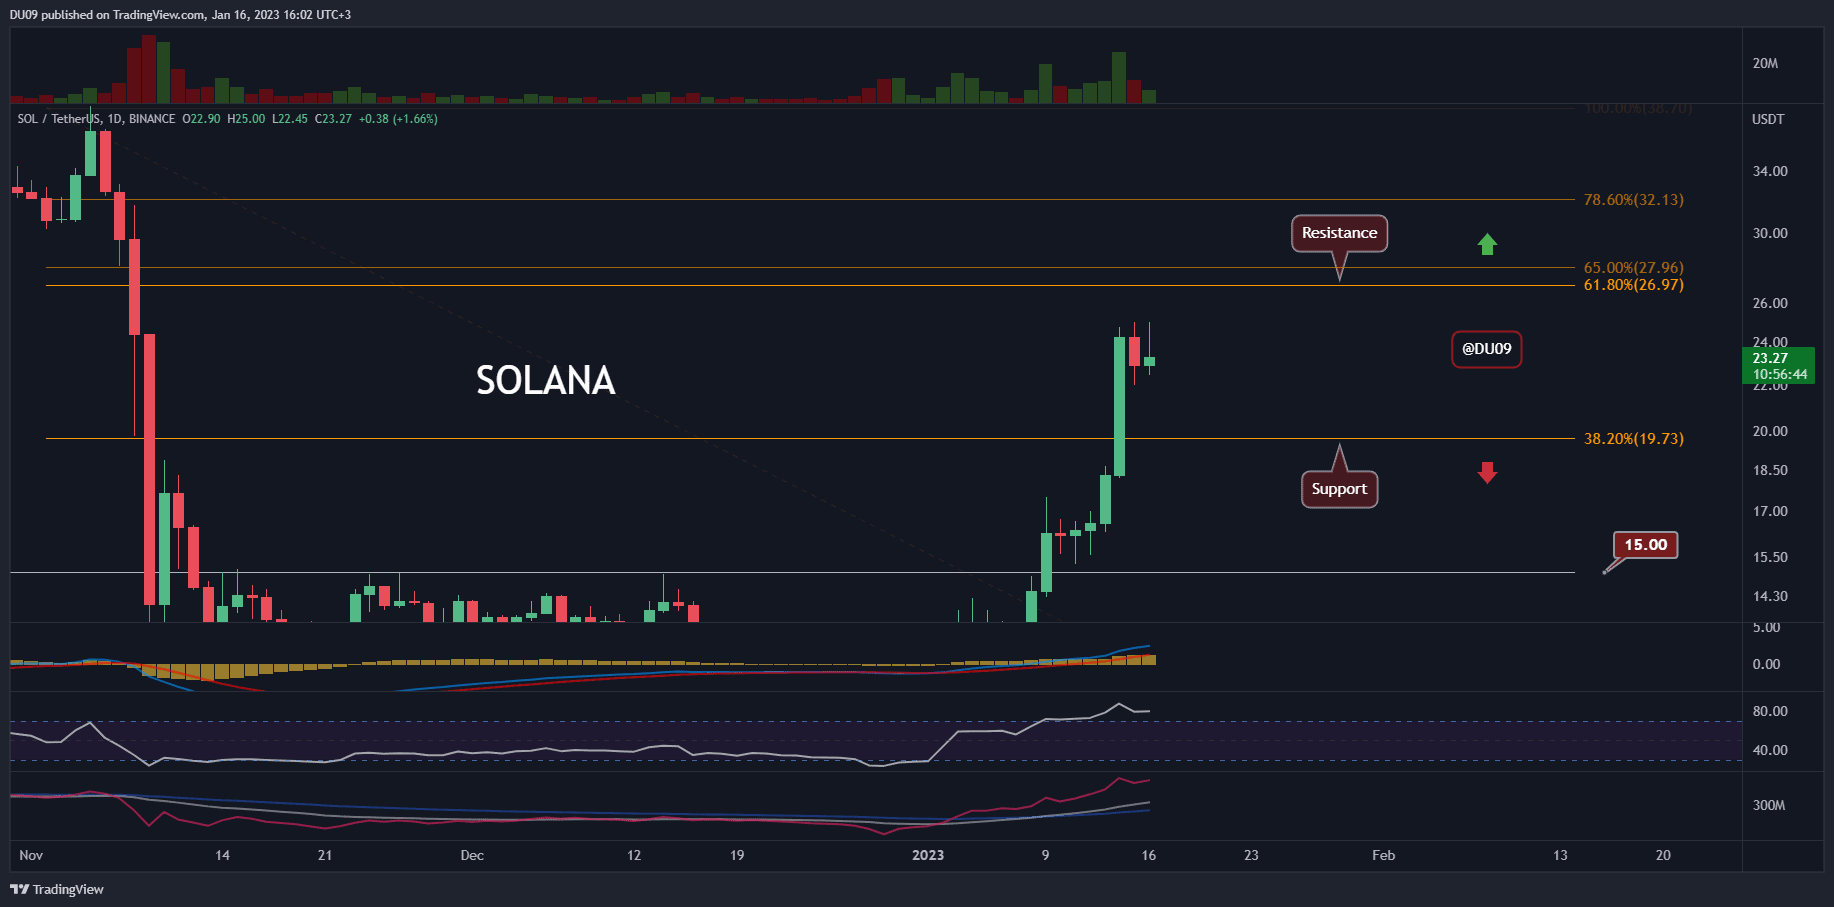
Key Support levels: $20
Key Resistance levels: $27
SOL has managed to fully recover most of the drop that started in November 2022. At this rate, buyers seem eager to return its price back to pre-FTX collapse levels soon.
To maintain this positive momentum, the cryptocurrency will have to break the key resistance at $27. Sellers continue to be absent, but if they return, then the key support is found at $20.
Trading Volume: The buying volume is making higher highs. This is bullish. As long as it continues, there is no looking back for buyers.
RSI: The daily RSI almost reached 90 points. While this shows buy pressure is high, it also serves as a warning that this level of momentum is hard to maintain for long.
MACD: The daily MACD is bullish, but the histogram appears to turn flat. This may signal that buyers are losing strength.
Bias
The bias for SOL is bullish.
Short-Term Prediction for SOL Price
Such parabolic moves are known to bring an equally powerful retrace. Therefore, buyers need to be on guard because, at any moment, the price could quickly reverse course and put sellers in charge. It’s important to remain vigilant.
The post SOL Explodes 60% Weekly But How High Can it Reach? (Solana Price Analysis) appeared first on CryptoPotato.