SOL Exploded by 25% Weekly, Here are the Key Targets (Solana Price Analysis)
Solana has been one of the best performers in the altcoins space for over a week and is approaching $30.
Key Support levels: $22, $20
Key Resistance levels: $25, $28
1. Massive Rally Ongoing
With the breakout from the downtrend successful, SOL started a major rally, which increased its price by over 25% this week alone. This impressive performance has taken Solana just under the key resistance at $25. Should this momentum continue, then the next target will be $28.
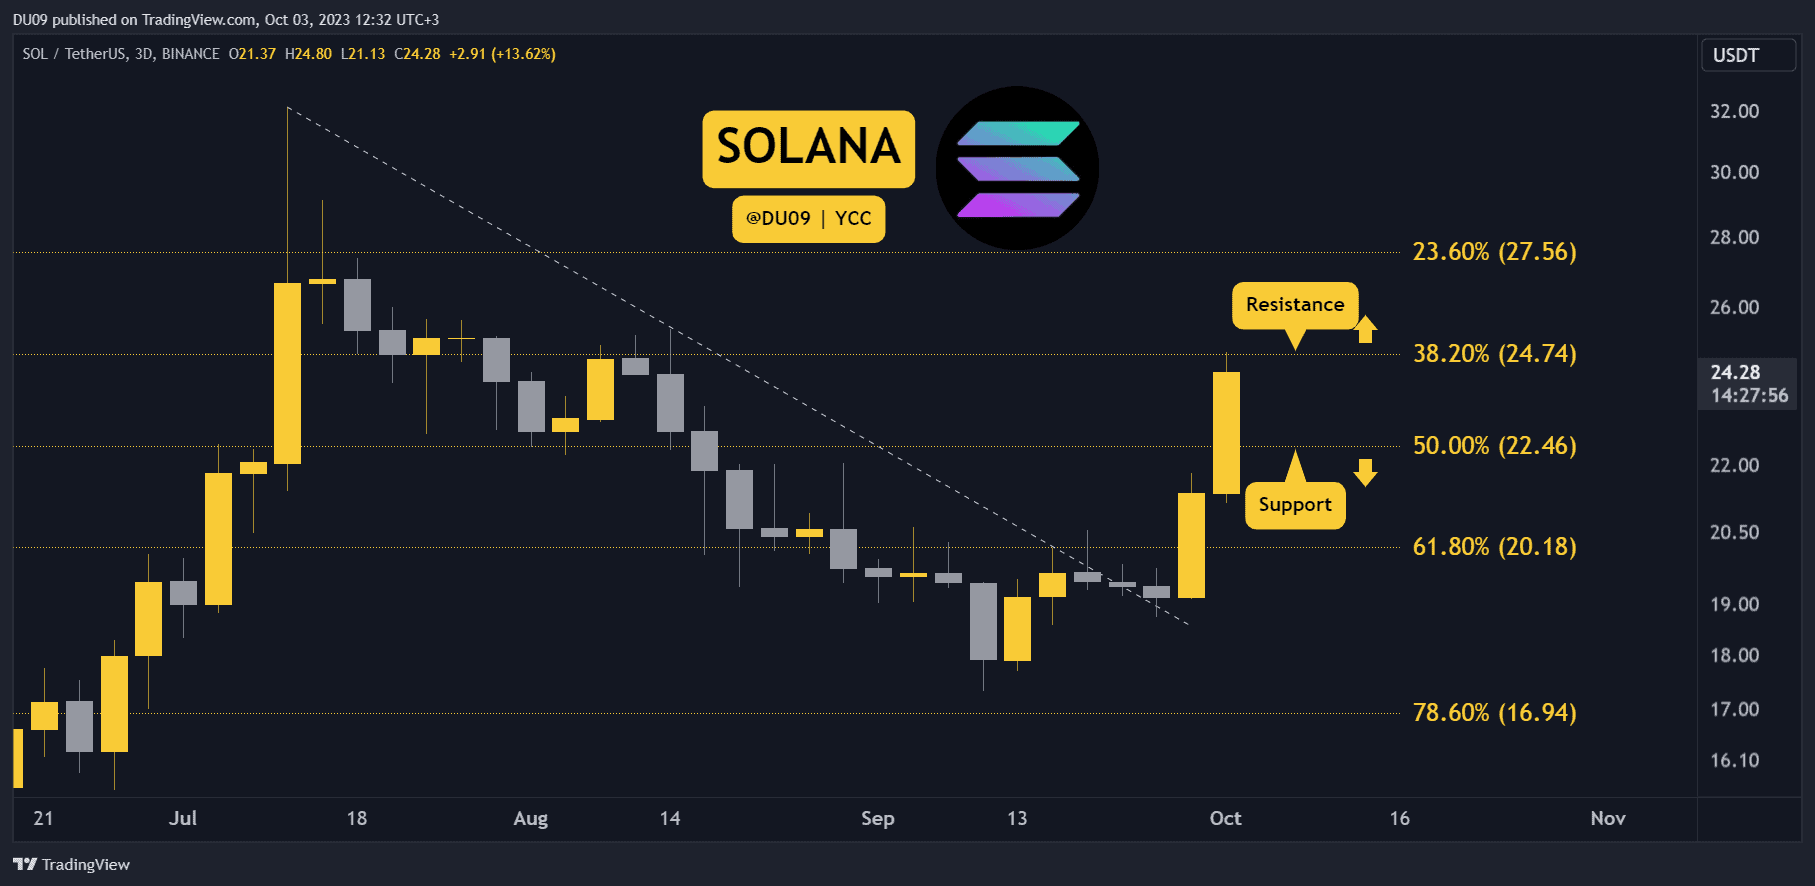
2. Is $30 Likely?
The most significant resistance will be found above $30, which was the previous high from July. While Solana may have the strength to reach it, it would be surprising to see it pass that level on the first attempt.
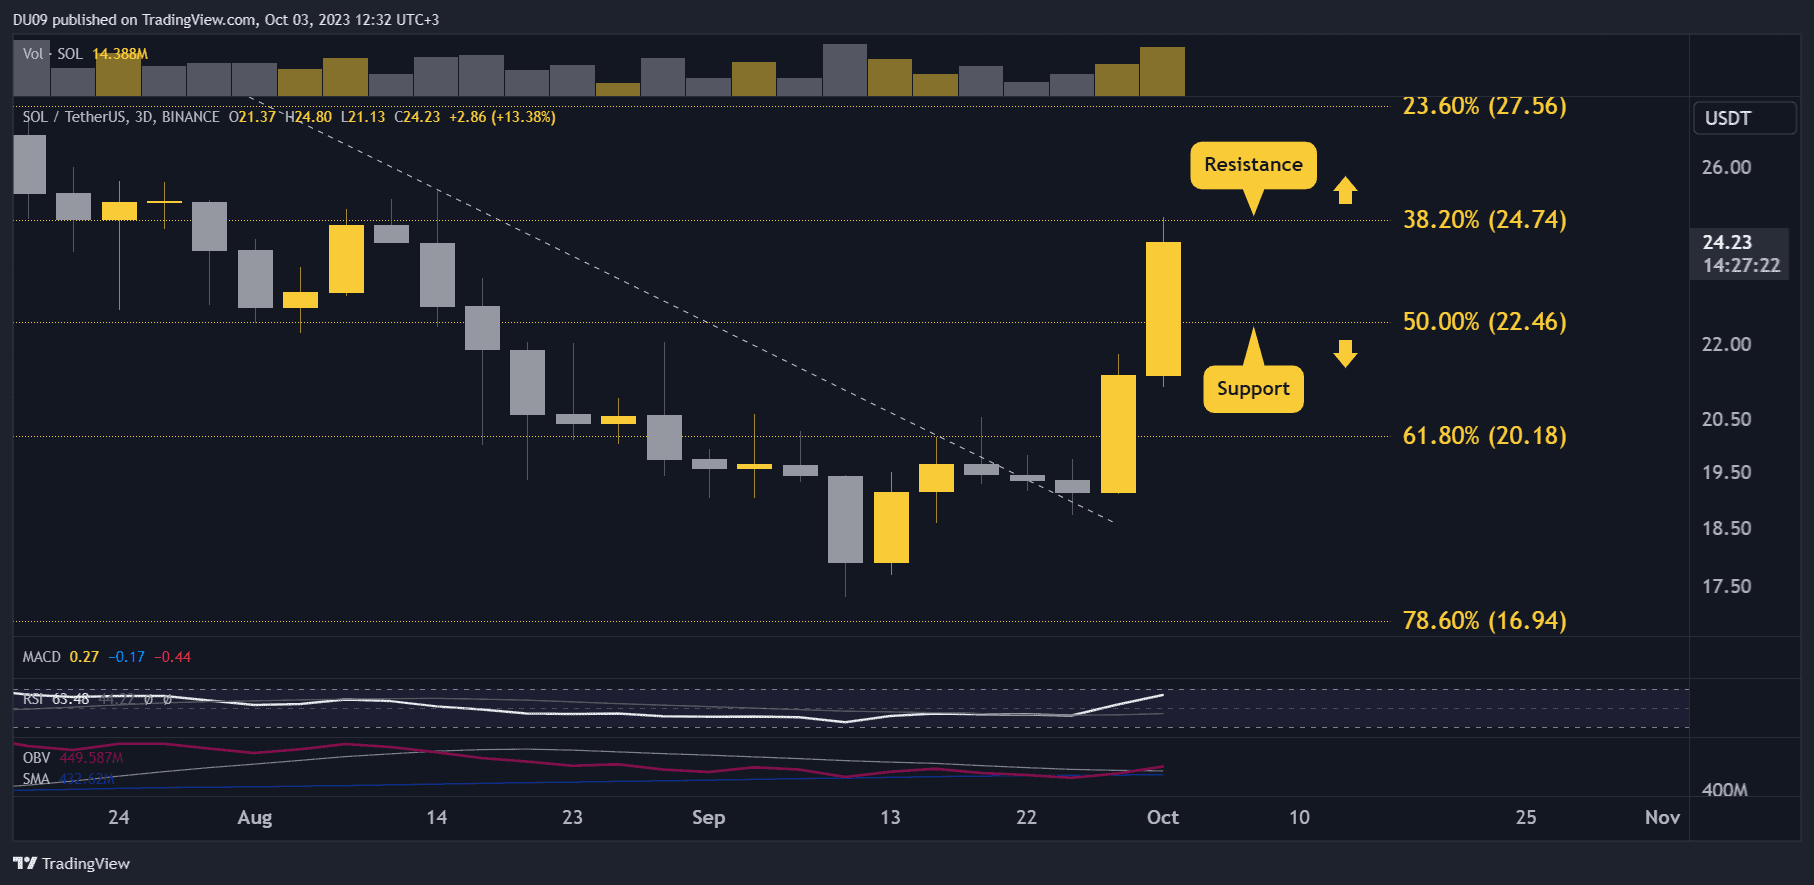
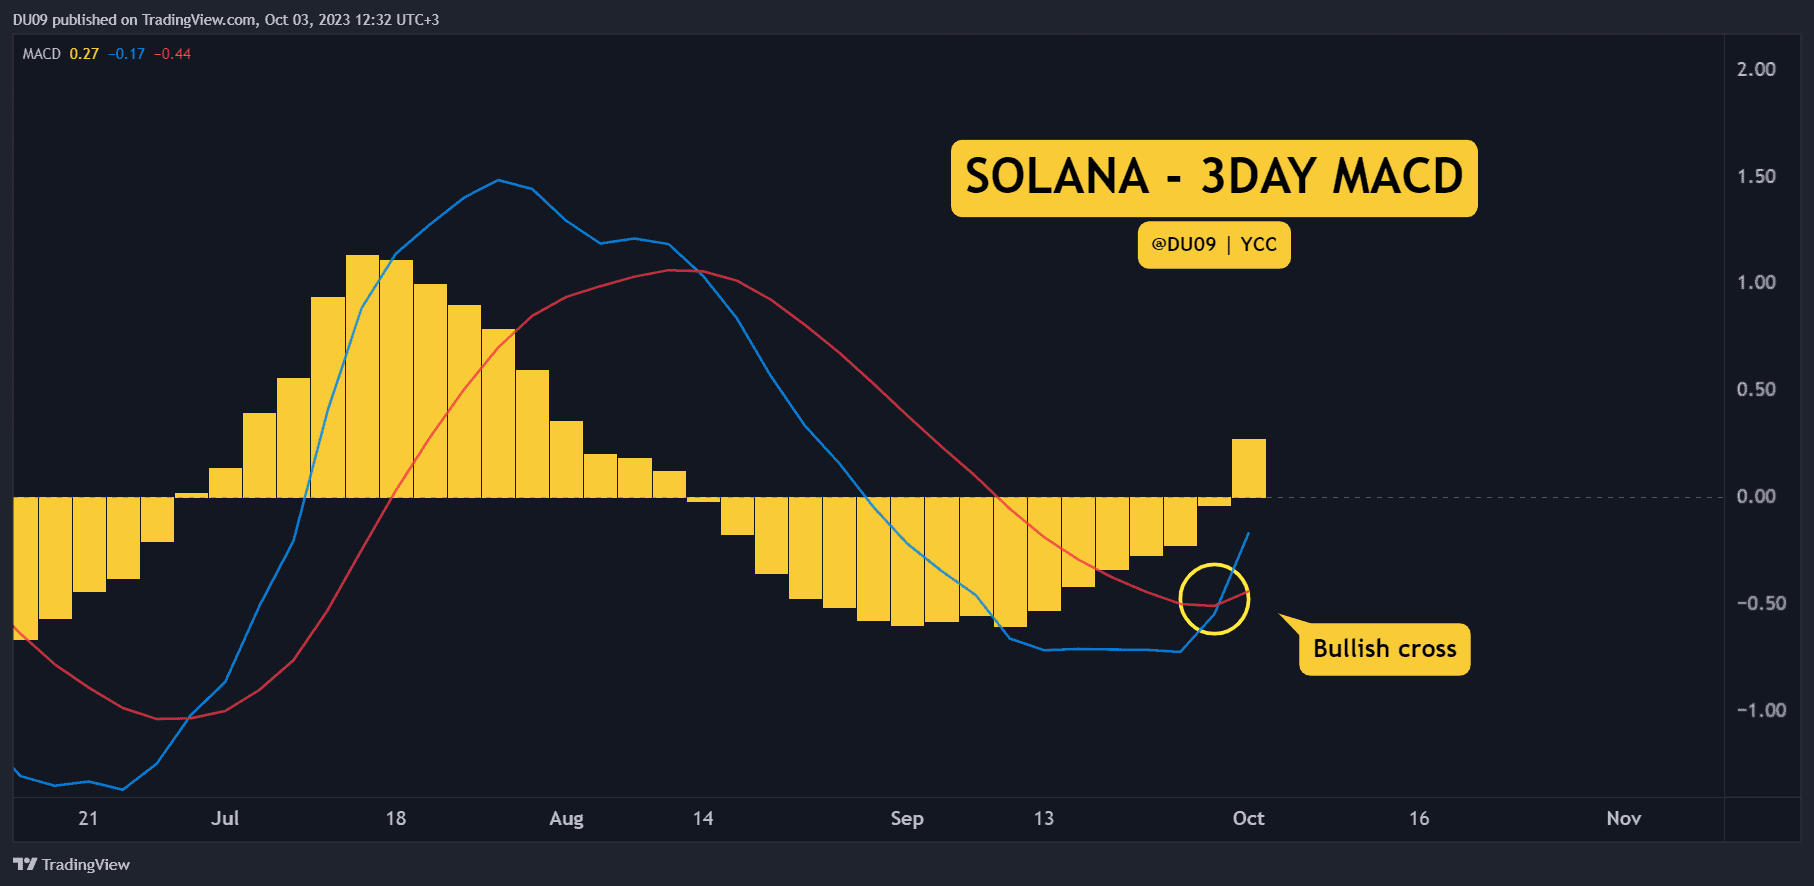
3. Bullish Cross Sparks a Buying Frenzy
The 3-day MACD completed a bullish cross, and the buying pressure exploded this week. This is a major change in the market momentum and may last for quite some time before SOL enters a significant correction.
Bias
The bias for SOL is bullish.
Short-Term Prediction for SOL Price
The biggest targets on the chart are $28 and $30. At this rate, Solana is likely to hit them. The biggest question is if SOL will also be able to sustain its price at those levels. In the past, sellers came in strong after the price hit $30.
The post SOL Exploded by 25% Weekly, Here are the Key Targets (Solana Price Analysis) appeared first on CryptoPotato.