SHIB Soars 50% Weekly, Here’s the Next Resistance to Watch (Shiba Inu Price Analysis)
Shiba Inu had a fantastic week so far, rallying by over 50% in the past seven days. However, the upcoming resistance levels may pose some challenges to the bulls.
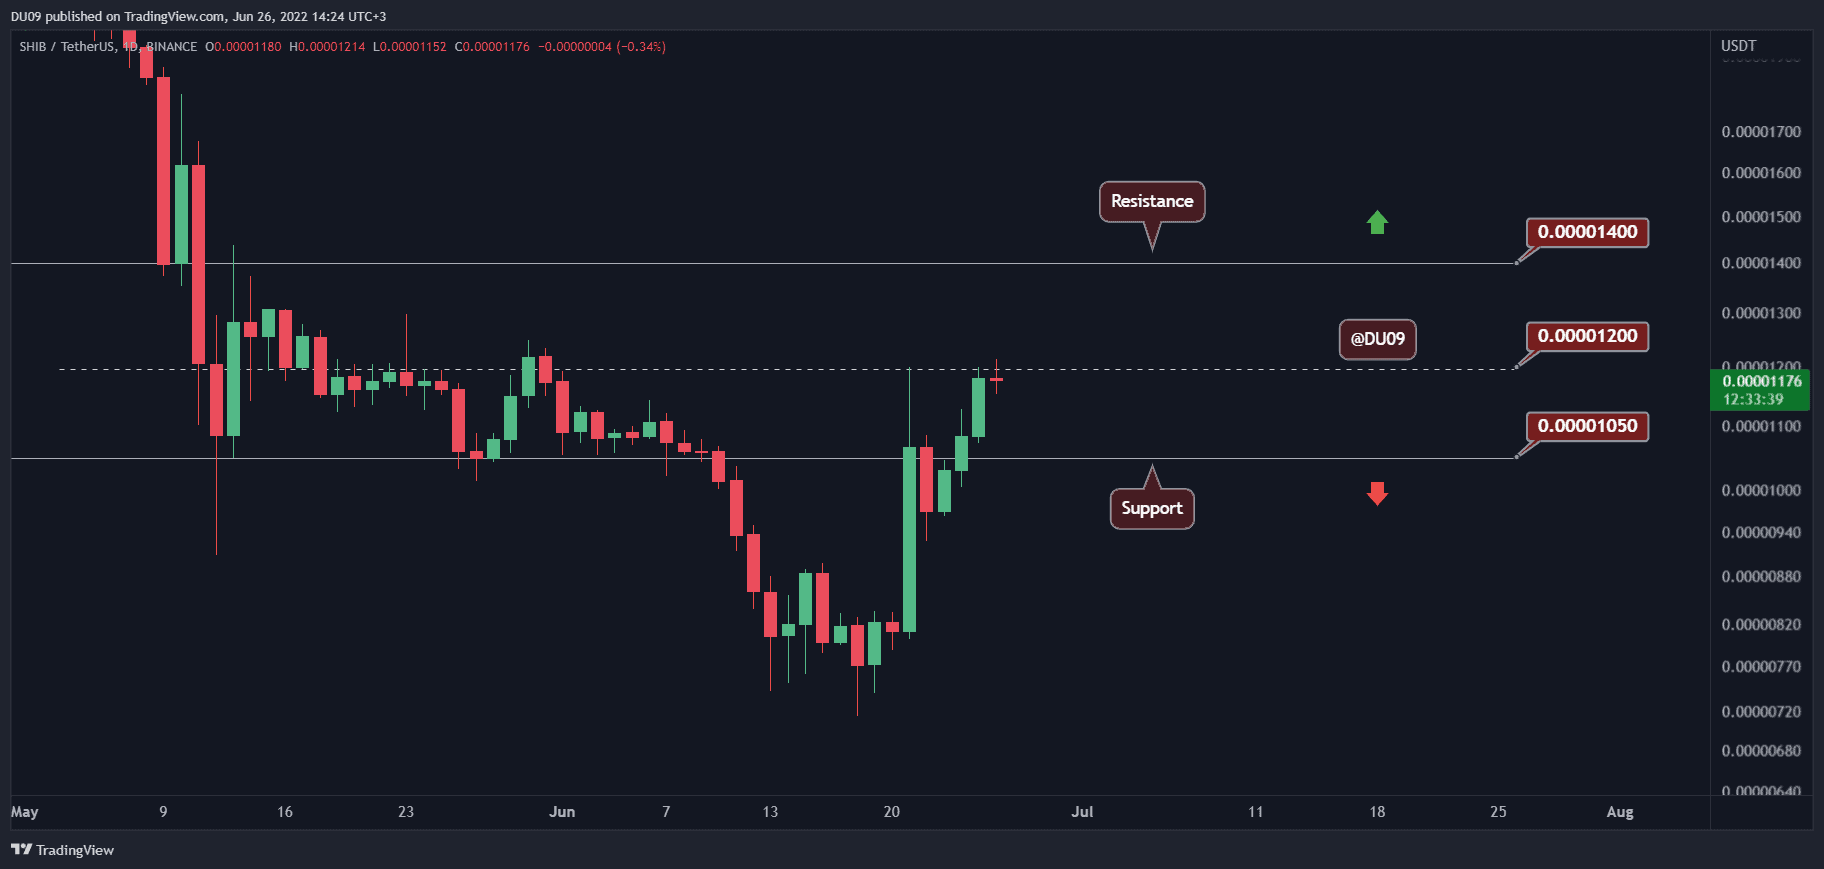
Key Support level: $0.000010, $0.000008
Key Resistance level: $0.000012, $0.000014
After a significant rally, SHIB is found just under the critical resistance at $0.000012. With momentum somewhat weak, it is unlikely for SHIB to attempt a breakout on a Sunday, but the coming week may surprise us again. The support is found at $0.000010.
Technical Indicators
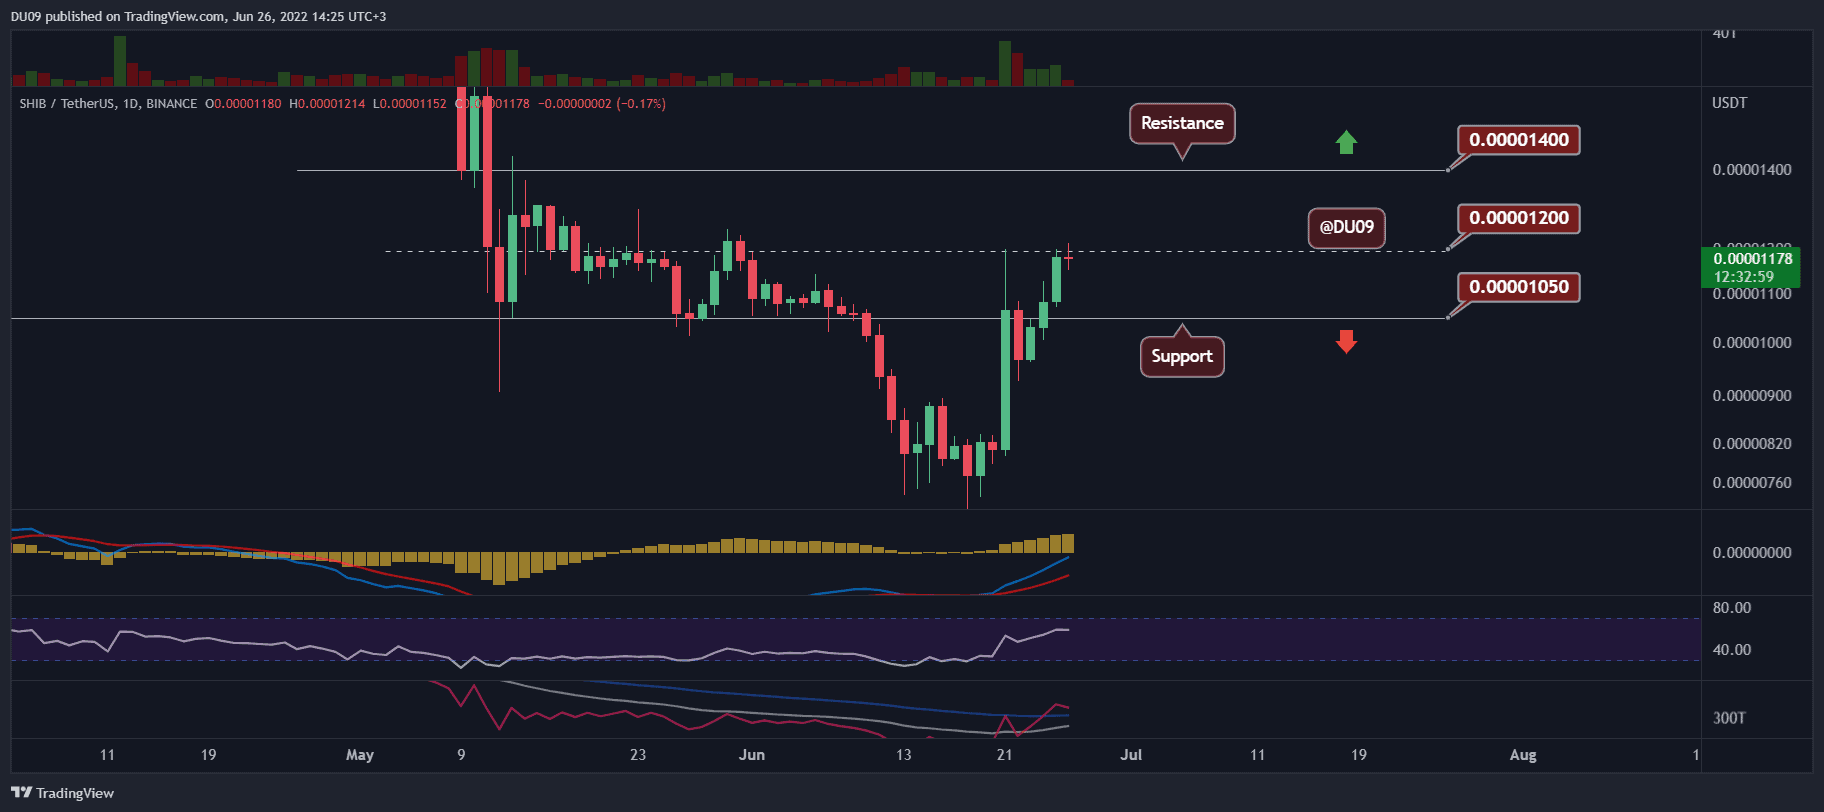
Trading Volume: The trading volume was high a few days ago, but once the weekend started, volume faded.
RSI: The daily RSI almost reached 60 points and is firmly on the bullish side with higher lows and higher highs.
MACD: The daily MACD is bullish and the histogram continues to make higher highs, which is a good sign. If buyers continue to show interest, then SHIB could break the current resistance in the coming week.
Bias
The bias on SHIB is bullish in the short term.
Short-Term Prediction for SHIB Price
Keep a close eye on the key resistance at $0.000012. If broken, then SHIB will have the path open and may rally all the way to $0.000014. The momentum remains bullish at this time, but this has to be confirmed on Monday with a clean break of the current resistance.