Ripple (XRP) Price Rockets to 2-Month High After Curious Whale Activity
TL;DR
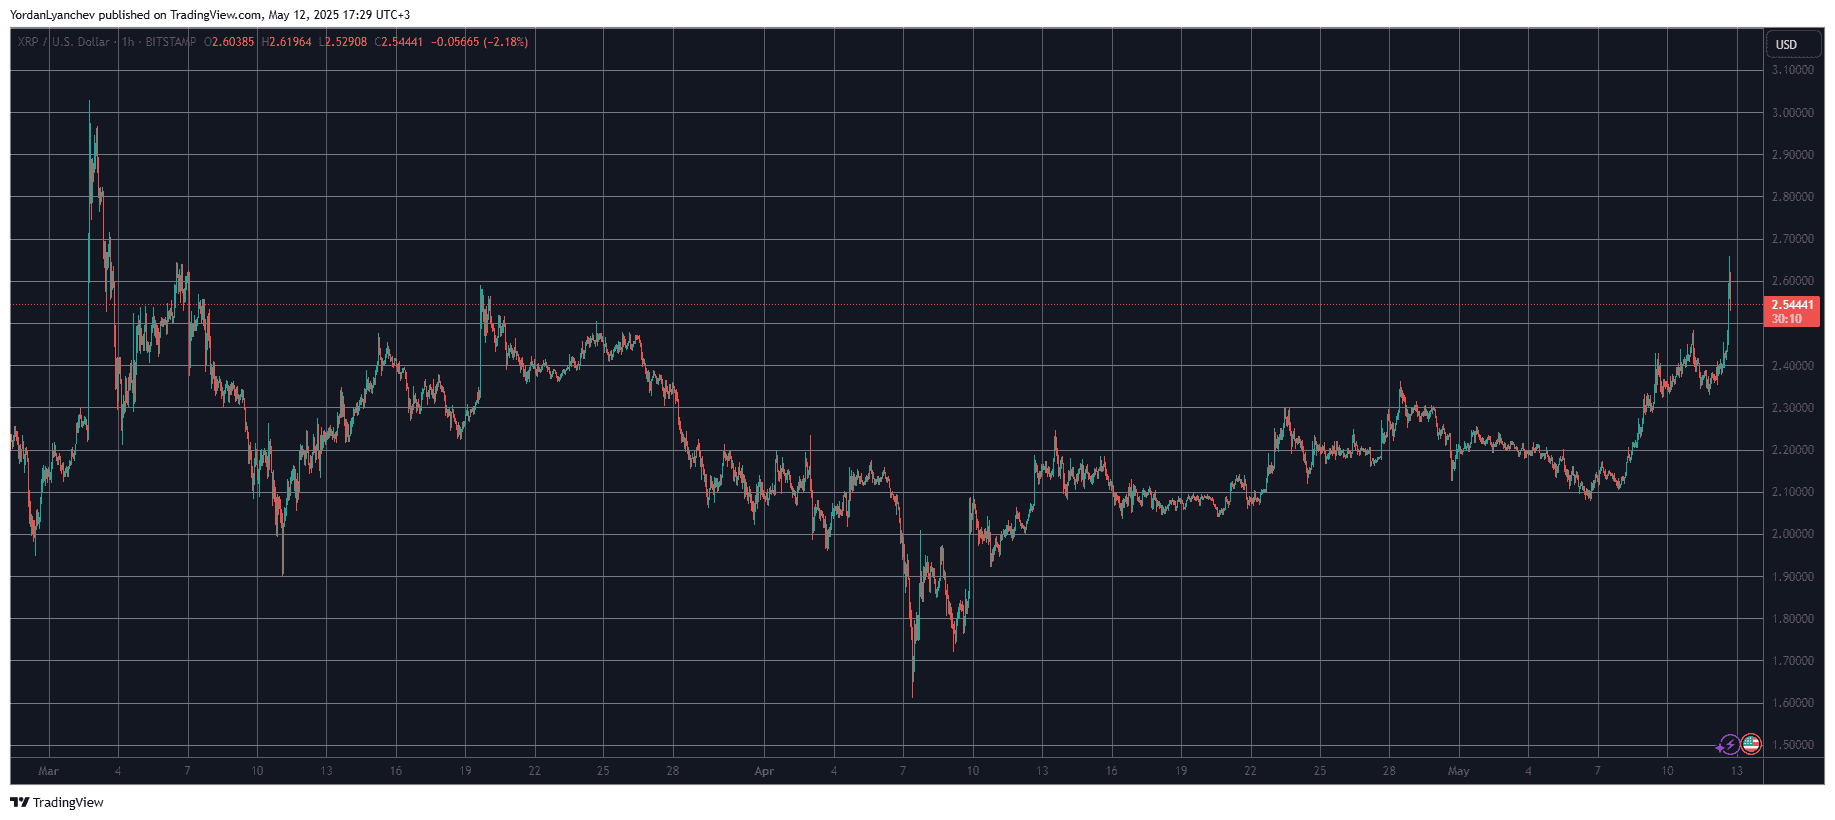
- Ripple’s price has gone on a tear once again as the asset shot above $2.6 for the first time since early March.
- This came after a whale with a good win record opened a substantial long position worth almost $12 million.

CryptoPotato reported just a couple of days ago that XRP’s price had underperformed compared to other larger-cap alts like ETH and DOGE, which registered massive gains in the past week or so.
At the time, Ripple’s token stood at around $2.4 after a minor 9% weekly increase (again – compared to others), but the SuperTrend indicator flashed a buy signal with a price target of $2.6. XRP indeed skyrocketed to and beyond that level hours ago, reaching $2.67 (on Bitstamp) for the first time in over two months.

This 10% daily surge made XRP the third-largest cryptocurrency by market cap, a position that it continues to swap with USDT as volatility is still kicking in at press time.
This impressive increase came just hours after Lookonchain reported about a big whale who had opened a whopping $12 million 2x long position on XRP. The same entity recently went long on ETH as well, and sat on an unrealized profit of $10 million at the time of the post.
The whale went long on $ETH right at the start of its rally and is now sitting on an unrealized profit of over $10M.
He opened a new 2x long on $XRP 8 hours ago, with a position of nearly $12M and an unrealized profit of $261K.https://t.co/vfdxjFvrkE pic.twitter.com/Rs1ZlwEAuL
— Lookonchain (@lookonchain) May 12, 2025
Popular reps of the XRP army quickly picked up the asset’s move before its minor retracement, and highlighted the next target ($3) if it is to decisively overcome the $2.6 resistance.
The post Ripple (XRP) Price Rockets to 2-Month High After Curious Whale Activity appeared first on CryptoPotato.


