Ripple XRP Price Analysis Jan.4: Lose Momentum or Gain Power?
The market is currently in a short-term sideways phase until Bitcoin chart decides otherwise.
We can notice that BTC is consolidating at the moment in what seems like a triangle formation that is about to break any time now and will depict the short-term market’s direction.
XRP is trading at the same ranges as it did during our last analysis between the resistance level of $0.37-$0.395 and the support level of $0.324-$0.31.
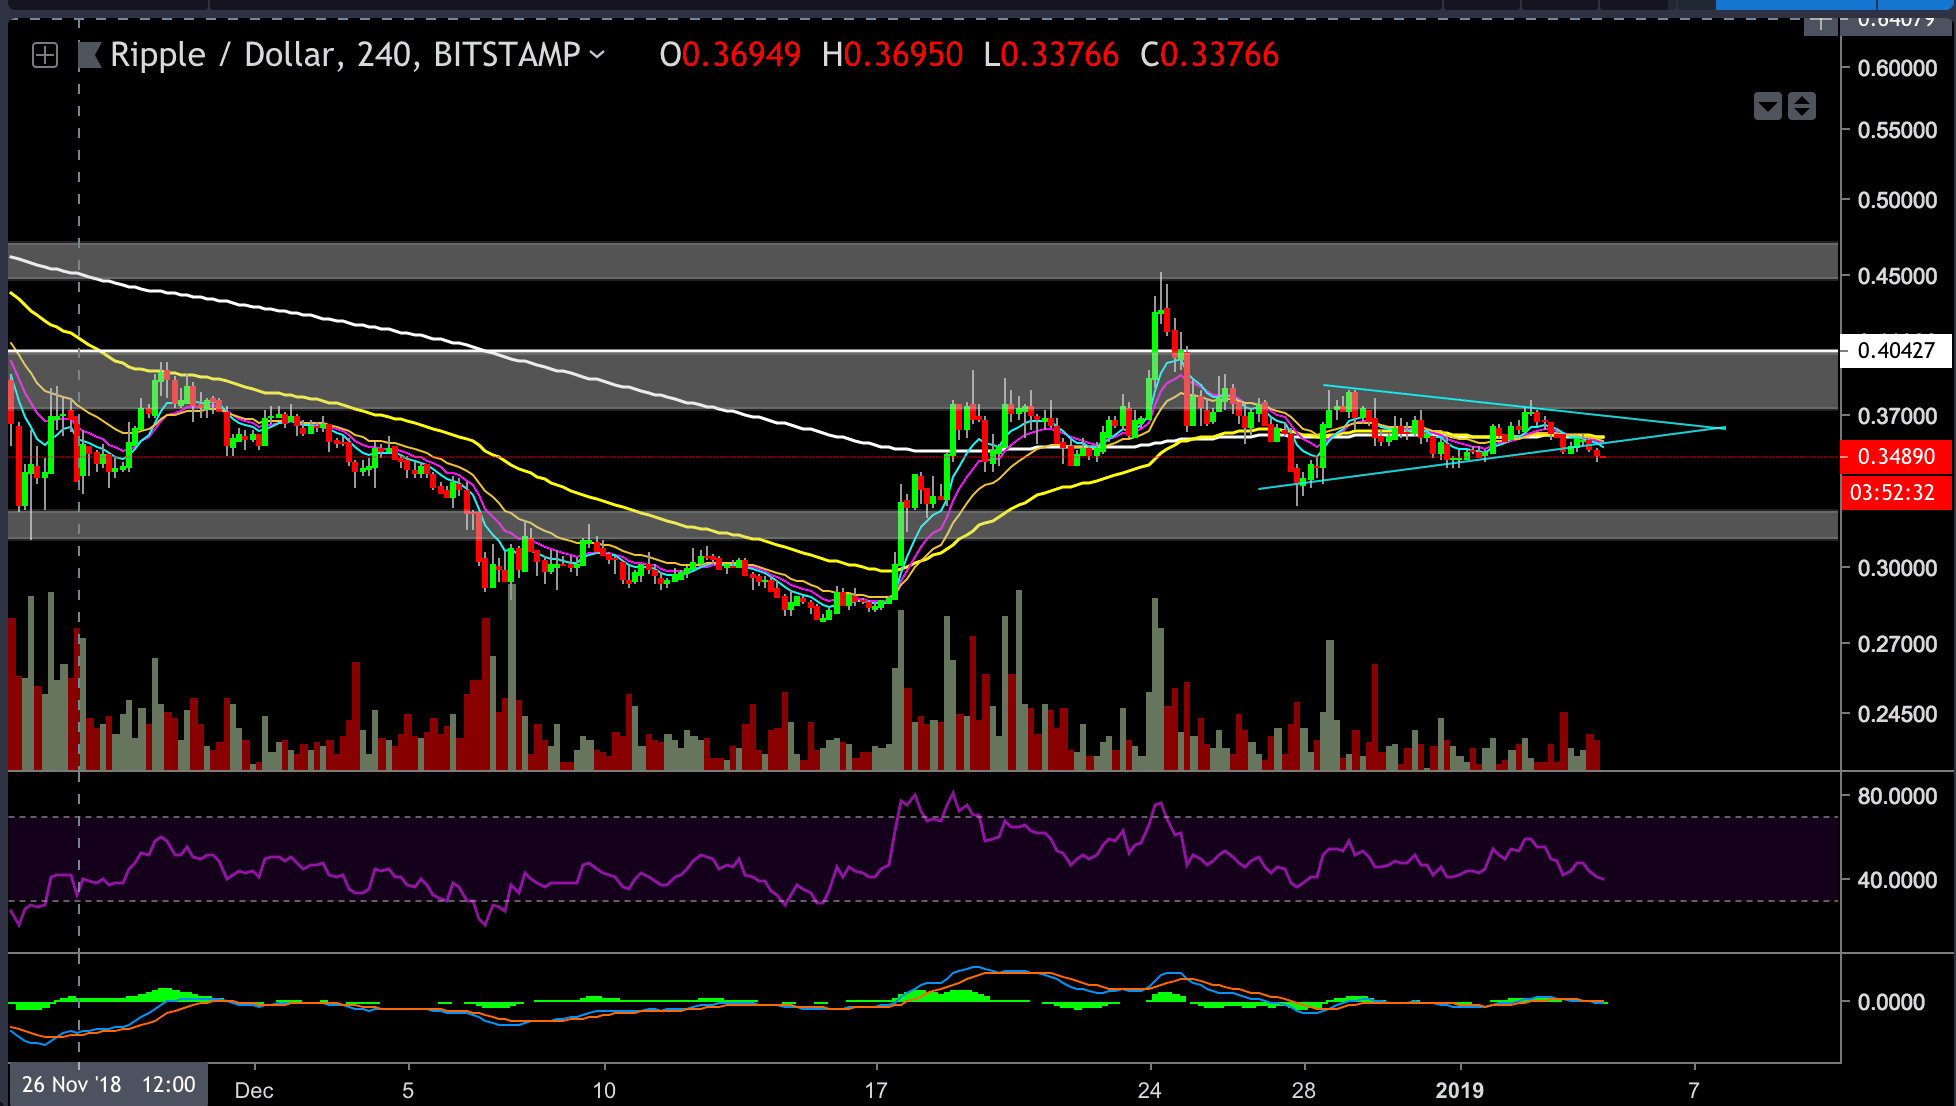
Looking at the 4 hours XRP chart
- As we expected in our last analysis, XRP retested the highs of the current channel at $0.373 and got rejected again.
- At the moment XRP is trading at $0.348 price level which is the middle part of the channel’s range, and there is a good chance that XRP will retest the support level of $0.324-$0.31 after the rejection from the resistance level.
- The trading volume is reducing as XRP is consolidating in the middle part of the channel, this is a good signal that a move toward one of the channel borders is on the way, and it correlates with our BTC current short-term analysis.
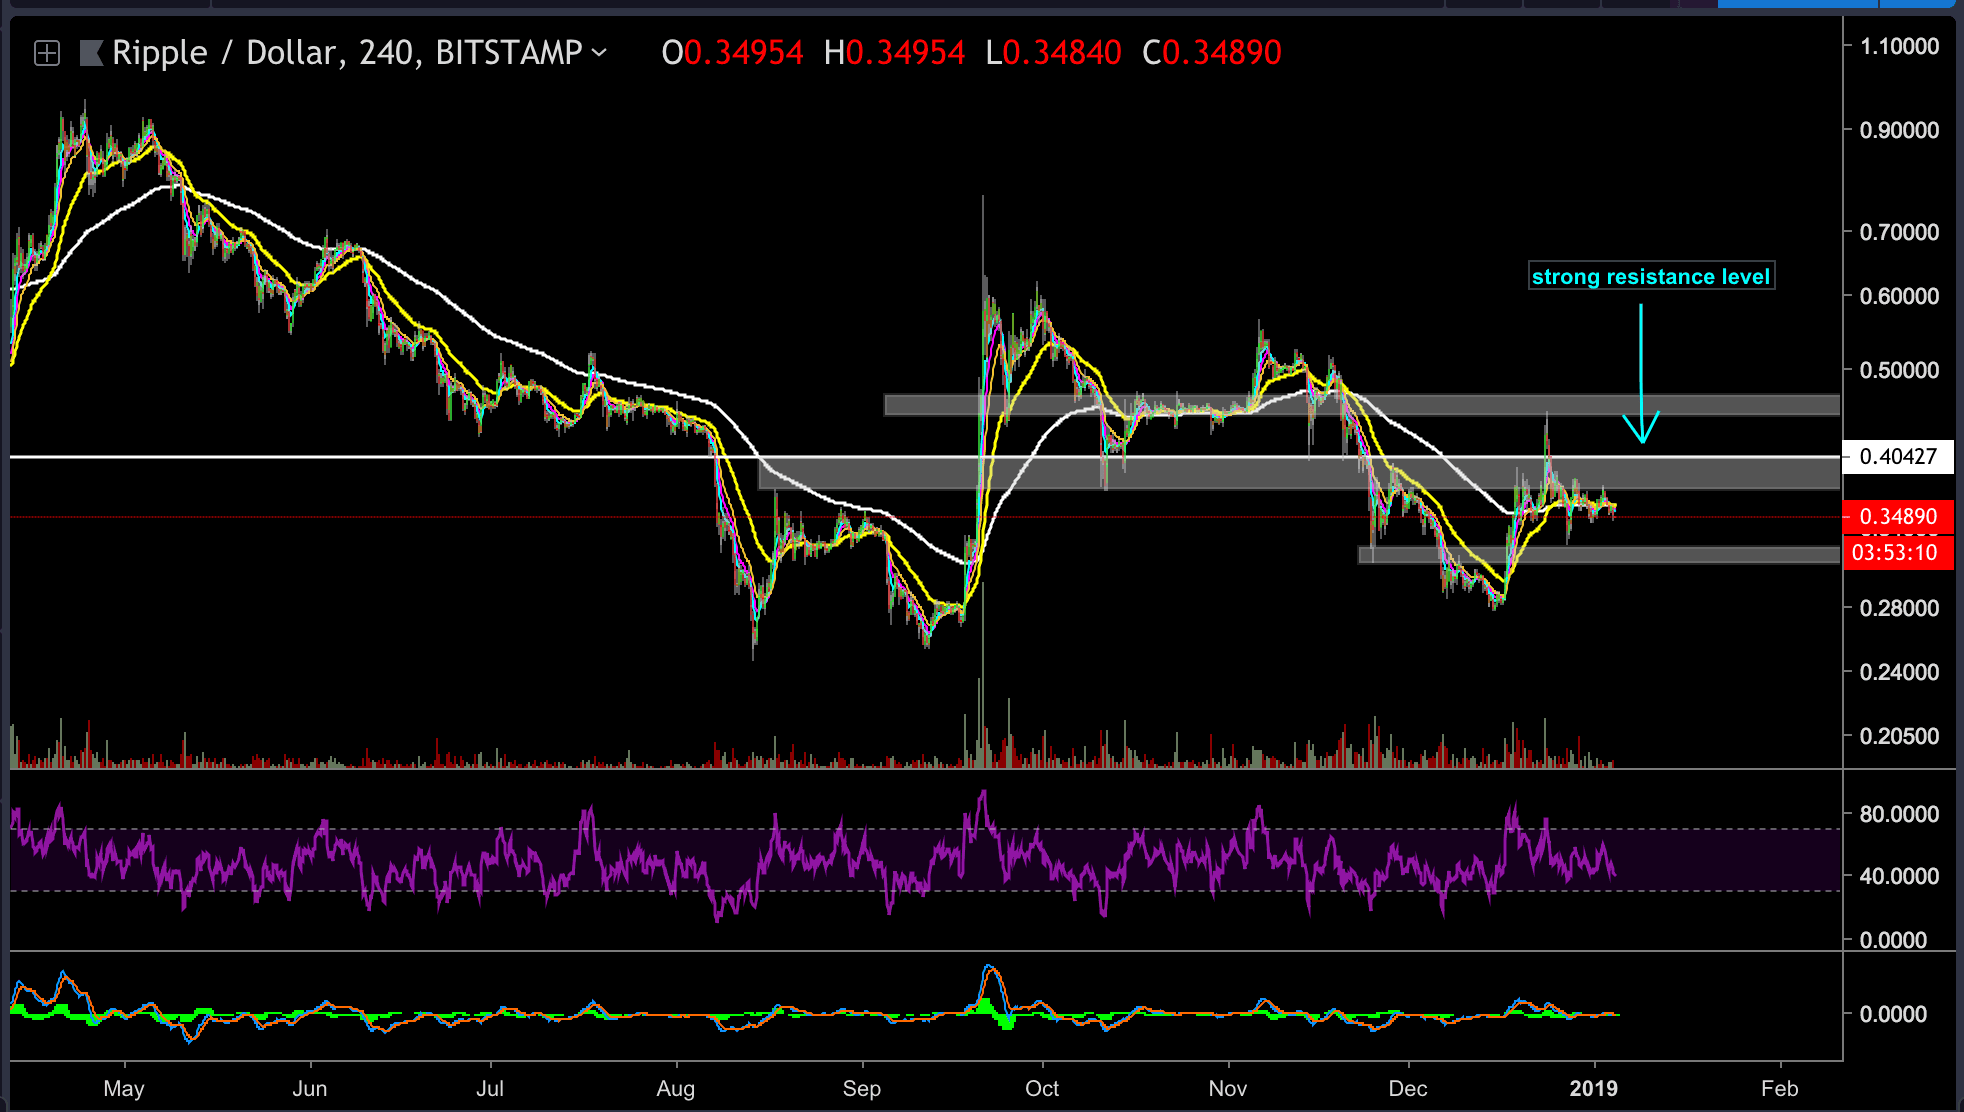
- As we mentioned in our last analysis the $0.40 resistance level is the major level that we want XRP to break above. This price level was the peak of the first rally XRP had in May 2017, and it acted as strong price level since then.
Be patient and do not over trade
BitStamp XRP/USD 4-Hour Chart
The post Ripple XRP Price Analysis Jan.4: Lose Momentum or Gain Power? appeared first on CryptoPotato.