Ripple Price Analysis: XRP Up 15% in a Week but $0.6 Resistance Intact, Can Bulls Break Above?
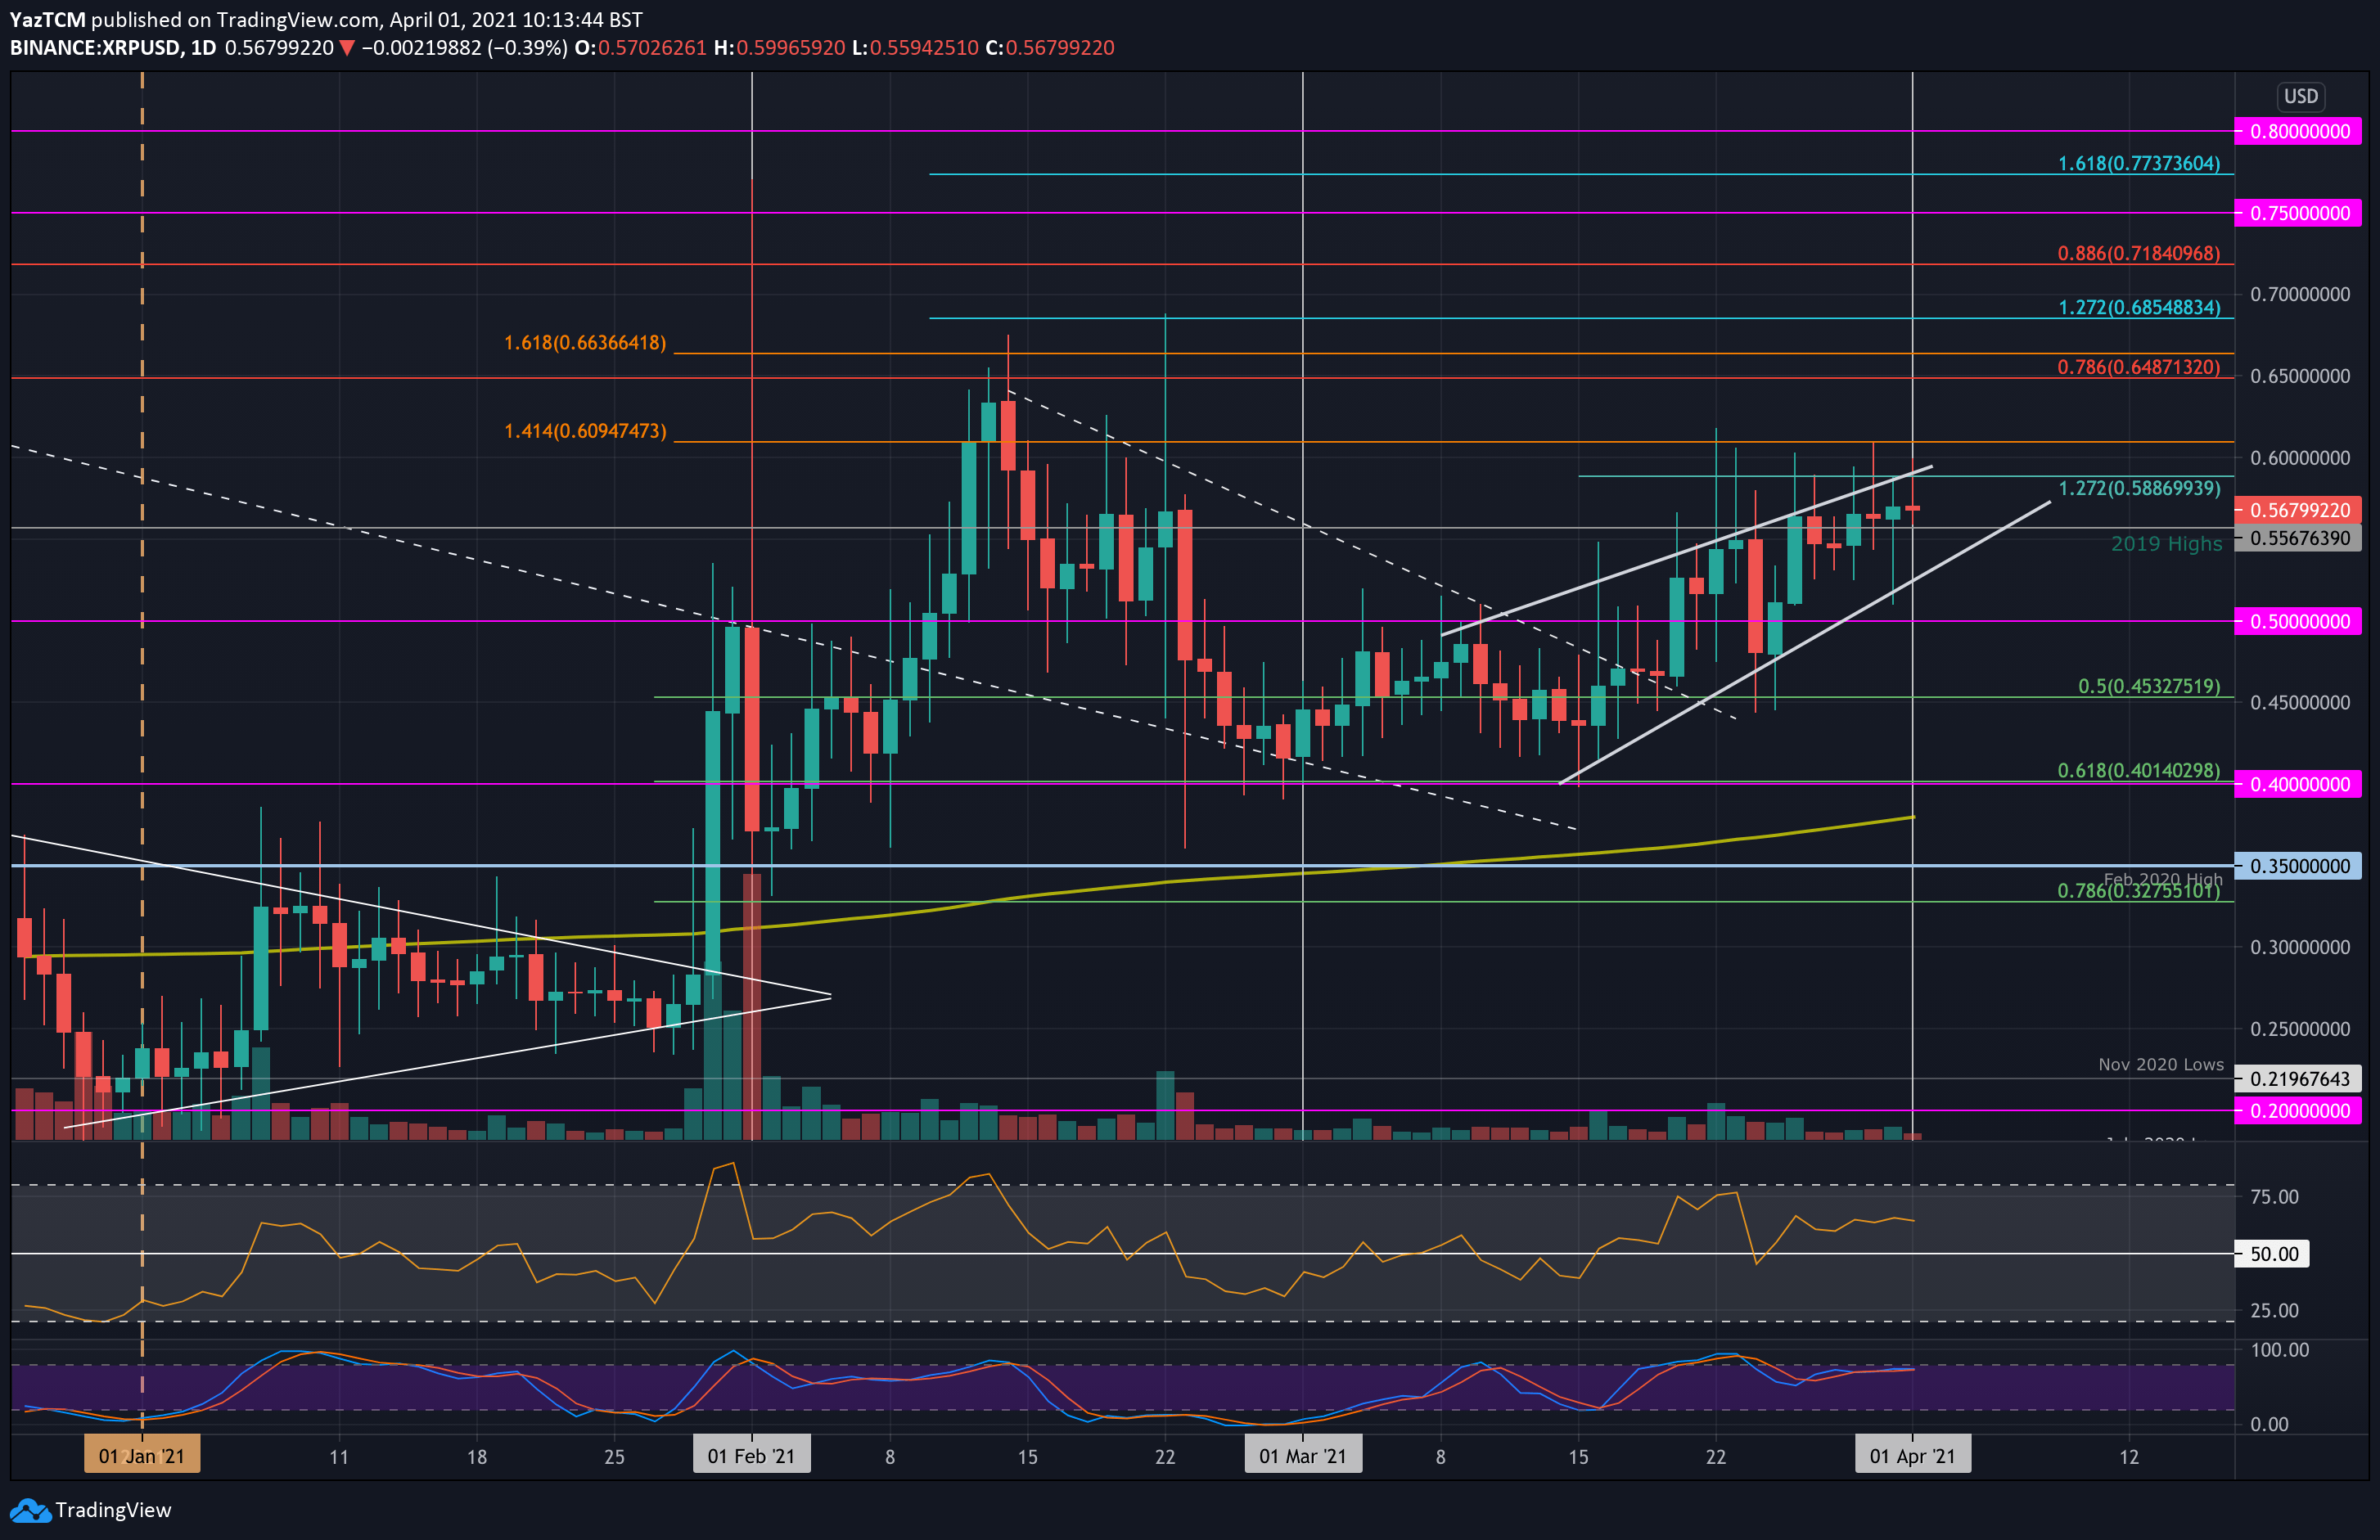
XRP/USD – Bulls Continue To Struggle To Break Rising Wedge.
Key Support Levels: $0.556, $0.54, $0.5.
Key Resistance Levels: $0.588, $0.6, $0.65.
XRP has slowly been rising throughout March as it continues to recover from the end-of-year disaster seen during December 2020 when it dropped by a total of 70% reaching as low as $0.2.
Since this low at the start of the year, XRP has increased by a total of 185% as the buyers attempt a recovery back toward the December 2020 highs around $0.7.
For the second half of March, XRP had been trading inside an ascending wedge pattern as it struggles to break the upper boundary around $0.6. The coin has spiked toward $0.6 on multiple occasions over the past fortnight but struggled to close a daily candle above the wedge.
A daily candle close above $0.6 would signal the start of the next potential bullish run higher for XRP.
XRP-USD Short Term Price Prediction
Looking ahead, the first level of resistance lies at $0.588 (upper angle of the wedge). This is followed by $0.6, $0.65 (bearish .786 Fib), $0.685 (1.272 Fib Extension), and $).718 (bearish .886 Fib).
On the other side, the first level of support lies at $0.556 (2019 highs). This is followed by the wedge’s lower boundary (around $0.54), $0.5, and $0.45 (.5 Fib).
The daily RSI has been moving sideways for the past week but still remains in the bullish territory above 50. The bulls are still in charge of the market momentum but have not been able to increase the momentum for a week.
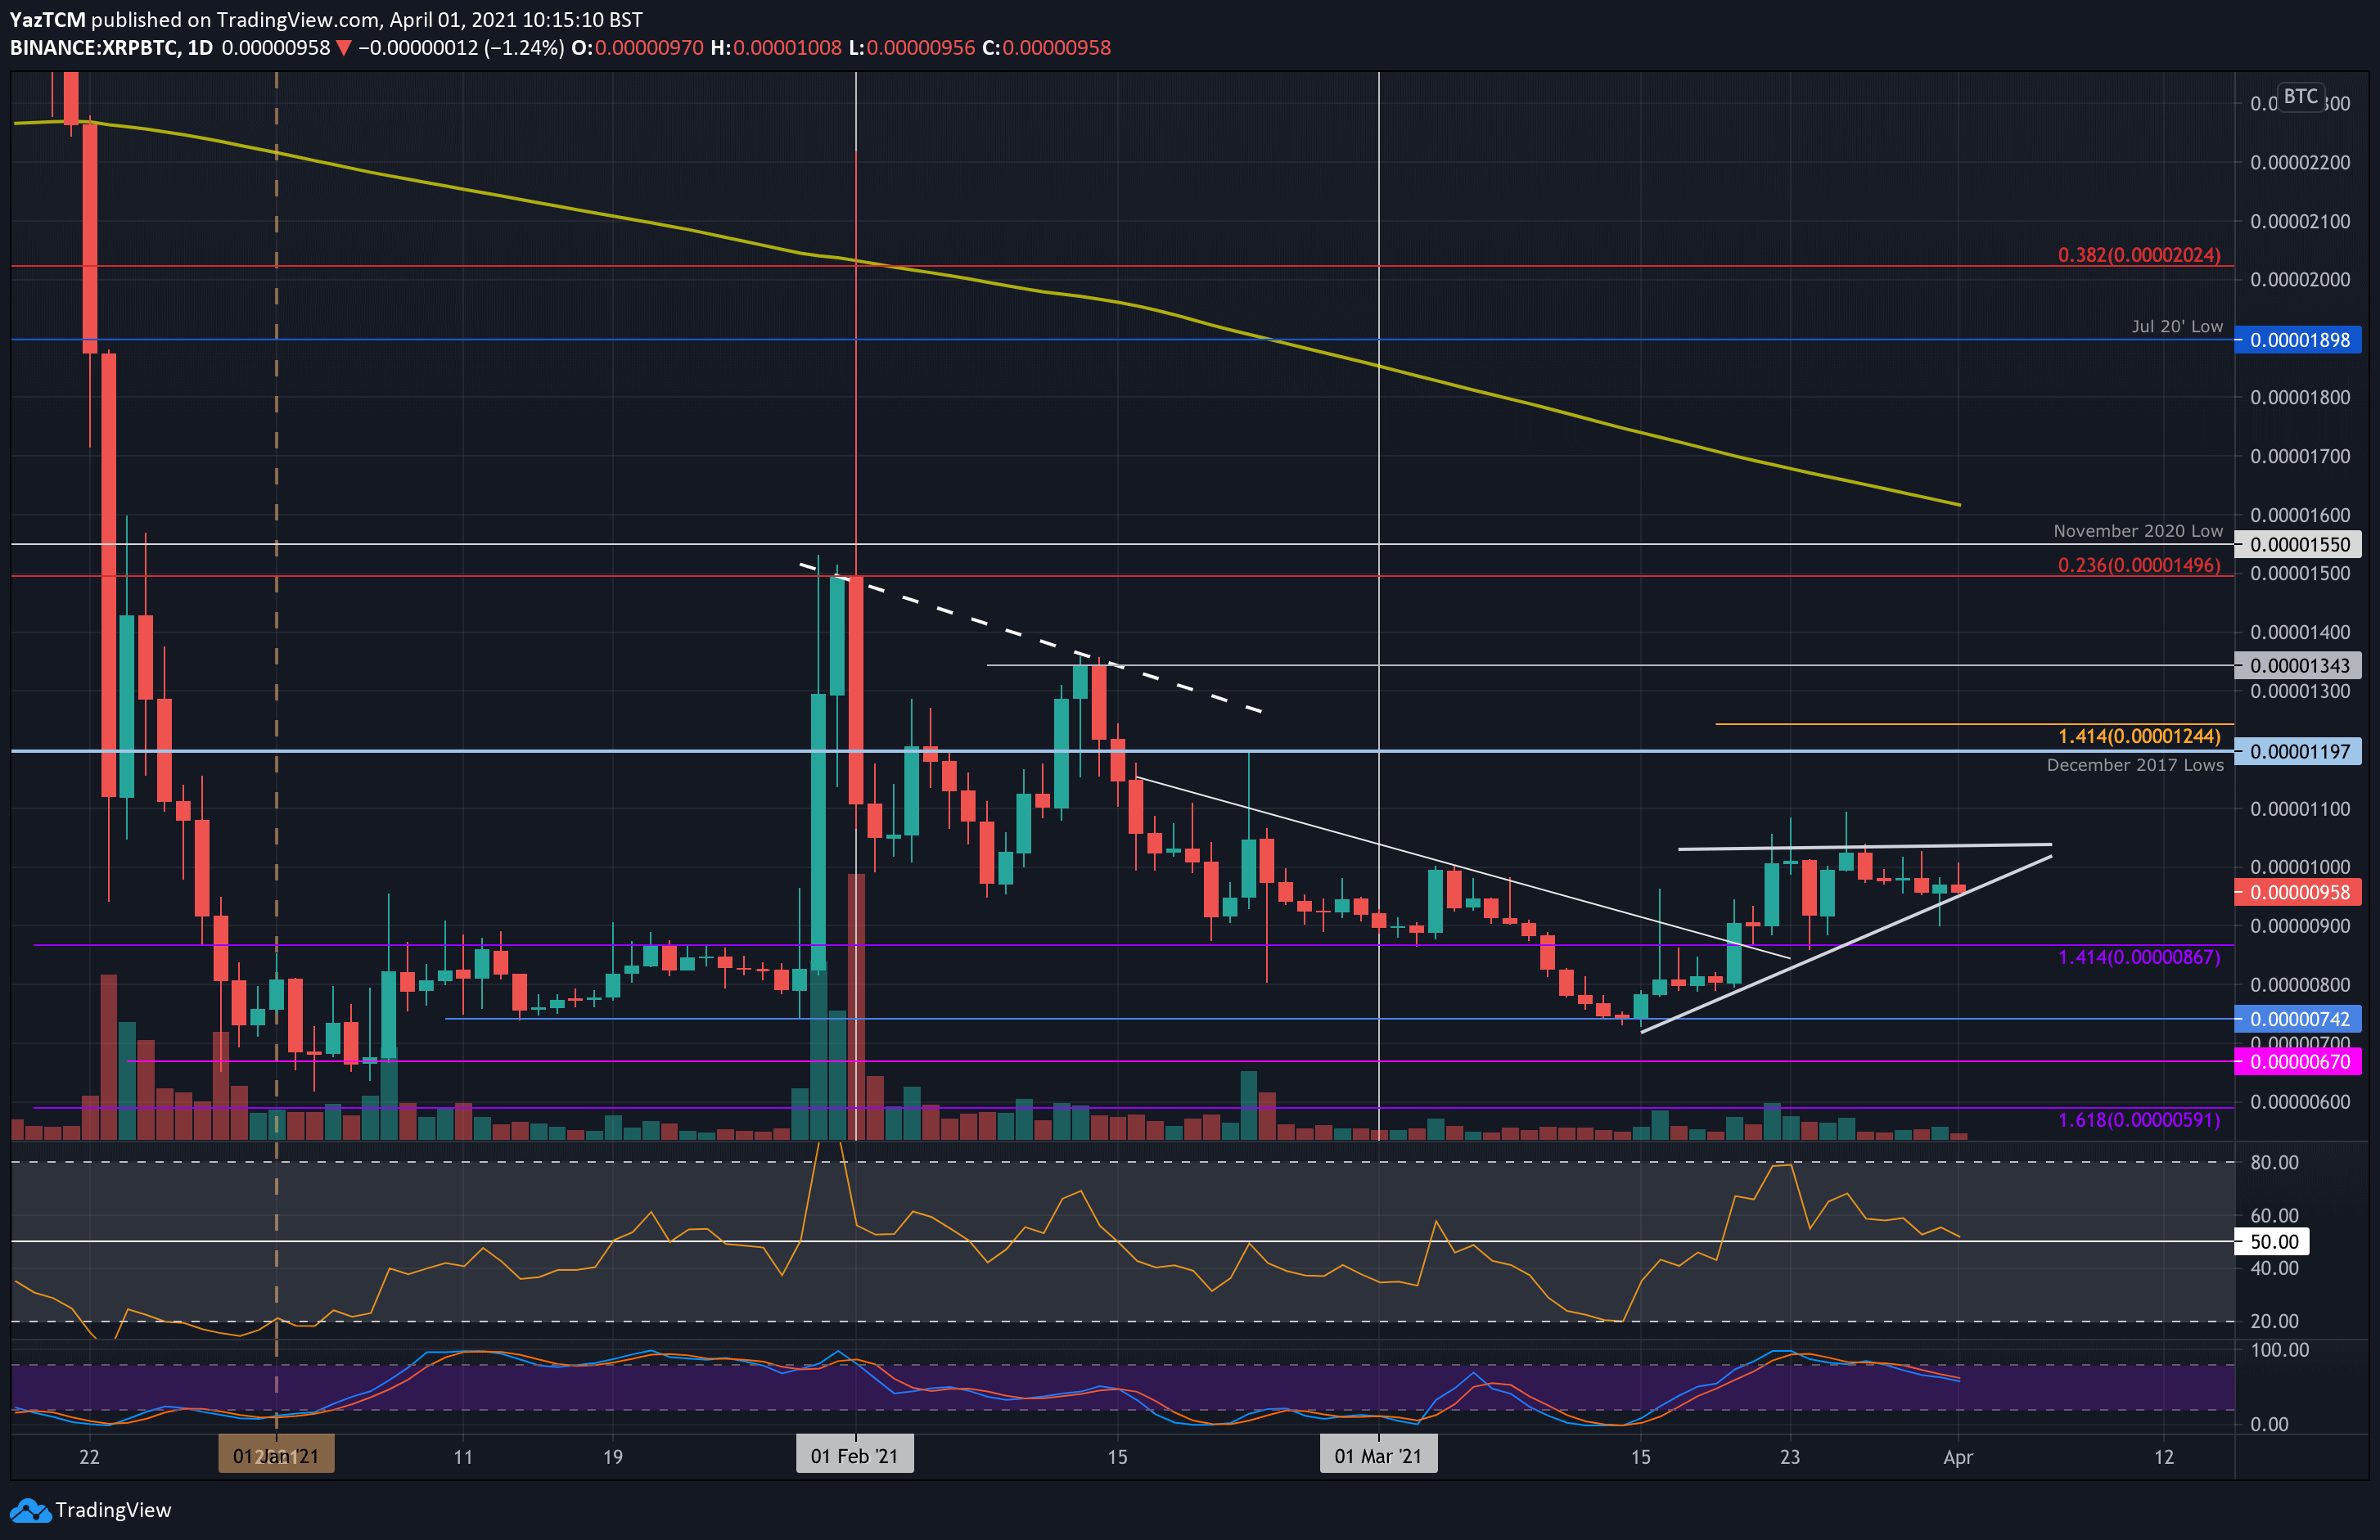
XRP/BTC – Market Continues To Fluctuate Around 1000 SAT.
Key Support Levels: 900 SAT, 867 SAT, 800 SAT.
Key Resistance Levels: 1050 SAT, 1200 SAT, 1345 SAT.
Against Bitcoin, XRP continues to trade inside a consolidation phase as it sits inside an acute ascending triangle with the roof at 1050 SAT. The cryptocurrency had rebounded from support at 742 SAT earlier in March but struggled to push past 1050 SAT after bouncing.
Recently, the coin has moved sideways from 1000 SAT as it fluctuates above and below the psychological level. It is now trading at the lower angle of the triangle, and a break beneath is likely to drive XRP lower.
XRP-BTC Short Term Price Prediction
Looking ahead, if the sellers break beneath the triangle, the first level of support lies at 900 SAT. This is followed by 867 SAT, 800 SAT, 742 SAT, and 670 SAT.
On the other side, the first level of resistance lies at 1050 SAT. This is followed by 1200 SAT (December 2017 lows), 1345 SAT, and 1550 SAT (November 2020 lows).
The RSI has been falling over the past week as it now settles at the midline, indicating indecision within the market. If it drops beneath 50, the bearish momentum will drive XRP beneath the triangle and will likely push it back into the January 2021 trading range.