Ripple Price Analysis: XRP Smashes $0.20 Level As Bulls Seemingly Take Control
- XRP finally broke the previous trading range with a superb 10.5% price hike over the past 24 hours.
- Against BTC, XRP surged past 2700 SAT and met 2900 SAT.
- XRP must still break above the resistance at $0.234 to turn bullish over a longer period.
Key Support & Resistance Levels
XRP/USD
Support: $0.21, $0.20, $0.1850
Resistance: $0.22, $0.2283, $0.2345, $0.26..
XRP/BTC:
Support: 2800 SAT, 2750 SAT, 2710 SAT, 2600 SAT.
Resistance: 2900 SAT, 3000 SAT, 3200 SAT.
XRP/USD: XRP Smashes Above The $0.20 Resistance To Meet $0.22
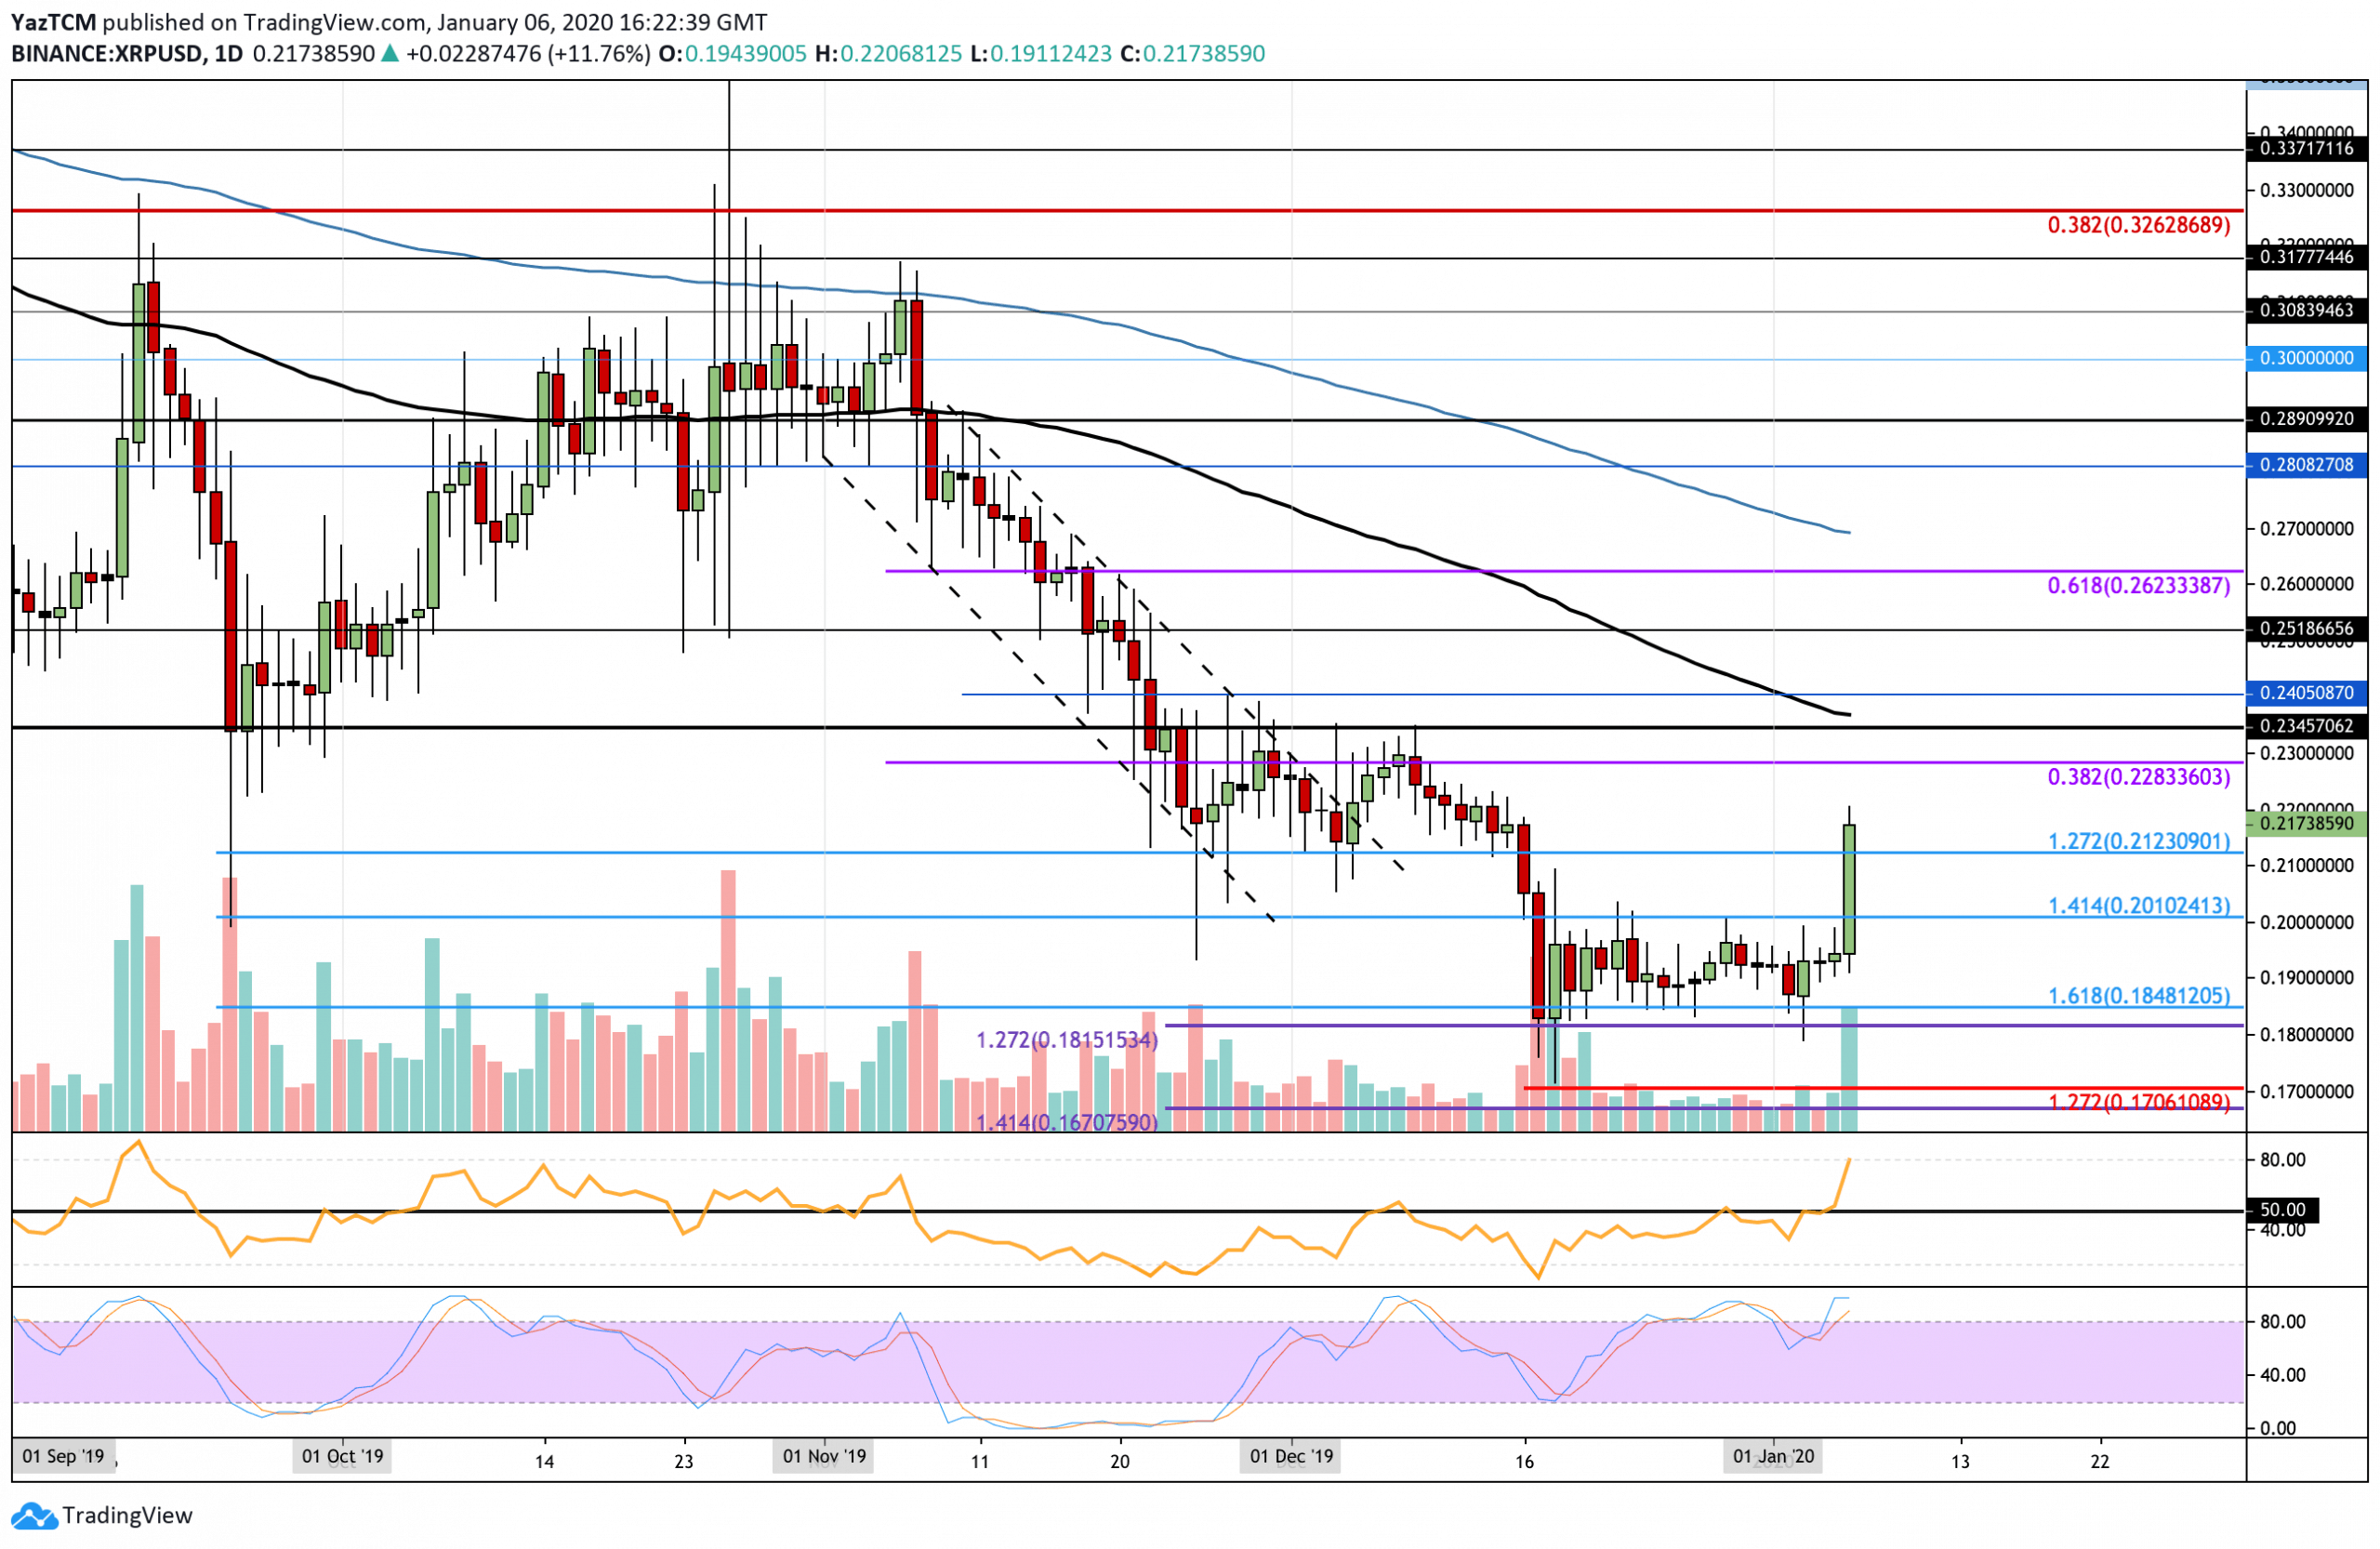
On the daily chart above, the previous trading range can clearly be seen with the boundaries at $0.20 and $0.181. The cryptocurrency penetrated above the upper boundary of this range with the 10.5% surge today that allowed XRP to rise into the $0.22 level.
XRP is now in a bullish trend in the short term but still must break above the $0.234 (December highs) to confirm a longer bullish trend. If XRP was to drop back beneath $0.20 then the market would be considered as neutral once again with a break beneath $0.181 confirming a bearish trend.
XRP Short Term Price Prediction
If the bulls continue to drive XRP above the $0.22 level, immediate resistance is expected at $0.228 (bearish .382 Fib Retracement) and $0.2345 (December highs). If the bulls can crack $0.2345 and the 100-days EMA, higher resistance is expected at $0.25 and $0.262 (bearish .618 Fib Retracement). On the other hand, if the sellers step back in and push XRP lower, initial support is expected at $0.21. Beneath this, additional support is found at $0.20, $0.19, and $0.1850.
The RSI has stormed above the 50 level which confirms that the bulls are in complete control over the market momentum. However, the Stochastic RSI is trading in overbought conditions which will send a signal to traders to remain cautious as there could be a small retracement incoming.
XRP/BTC – XRP Reaches 2900 SAT But Can We Break The Magical 3000 SAT?
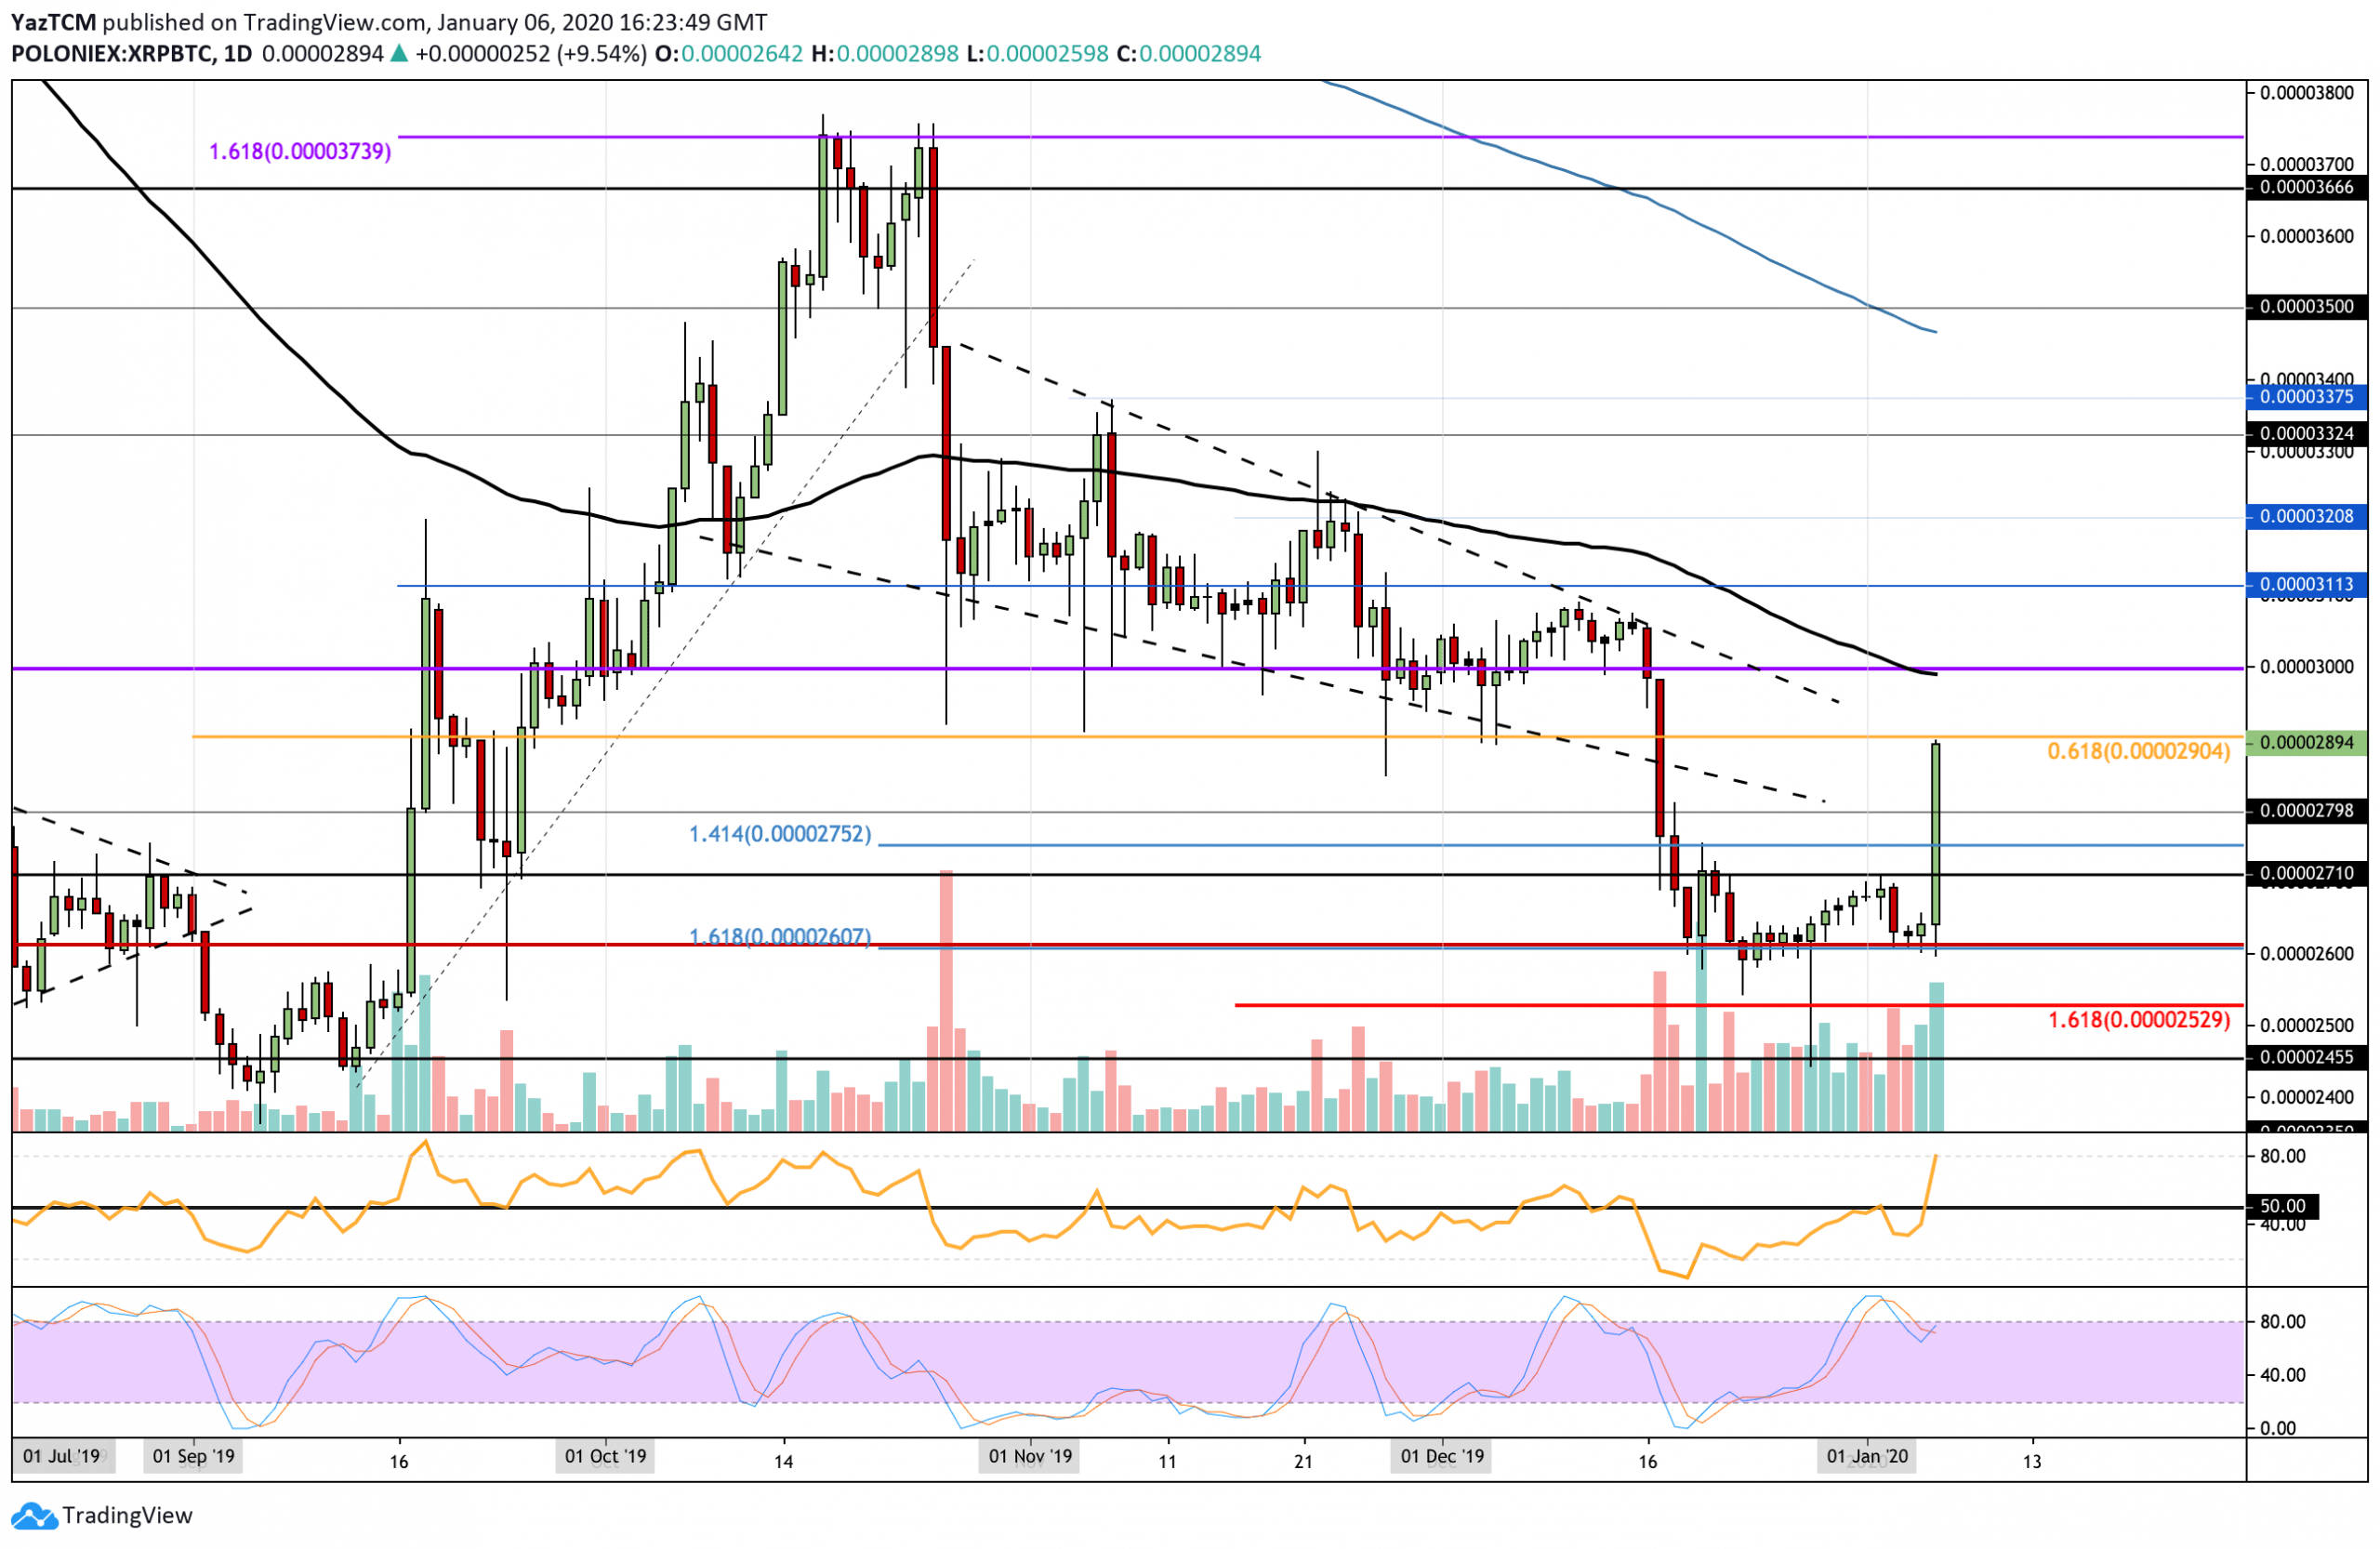
Since our previous analysis, XRP went on to initially struggle at the resistance at 2710 SAT, causing it to fall into the support at 2600 SAT. However, it then went on to rebound from here which allowed the cryptocurrency to smash the resistance at 2710 SAT and climb much higher to reach the resistance at 2900 SAT.
XRP still must break above the resistance at 3000 SAT (December highs) to turn bullish, however, the cryptocurrency is well on the way to doing this. To turn bearish, it must fall and drop beneath the support at 2600 SAT which is unlikely to happen.
XRP Short Term Price Prediction
If the buyers manage to drive XRP higher above 2900 SAT, immediate strong resistance is located at 3000 SAT. This resistance is further bolstered by the 100-days EMA which is located at the same level. Above 3000 SAT, resistance lies at 3115 SAT, 3208 SAT and 3375 SAT. Alternatively, if the sellers regroup and push XRP lower, support can be found at 2800 SAT, 2750 SAT, 2710 SAT and 2600 SAT.
Similarly, the RSI has climbed well above the 50 level as the bulls dominate the market momentum. However, the Stocahstic RSI is in overbought conditions as we wait for the formation of a bearish crossover signal to suggest that the market may be overextended.
The post Ripple Price Analysis: XRP Smashes $0.20 Level As Bulls Seemingly Take Control appeared first on CryptoPotato.

