Ripple Price Analysis: XRP Records 20-Month Low Against BTC, Where Is the Bottom?
XRP has seen a price decline of about 3.5% over the past 24 hours, and it’s currently trading at around $0.3104. This latest move is largely attributable to it falling below the 3,000 satoshi level, as XRP has continued to struggle against BTC after creating a fresh 20-month low. XRP has declined by 22% over the past week as XRP/USD continues to trade in a period of consolidation.
XRP remains the third-largest cryptocurrency by market value with a market cap of $13.28 billion.
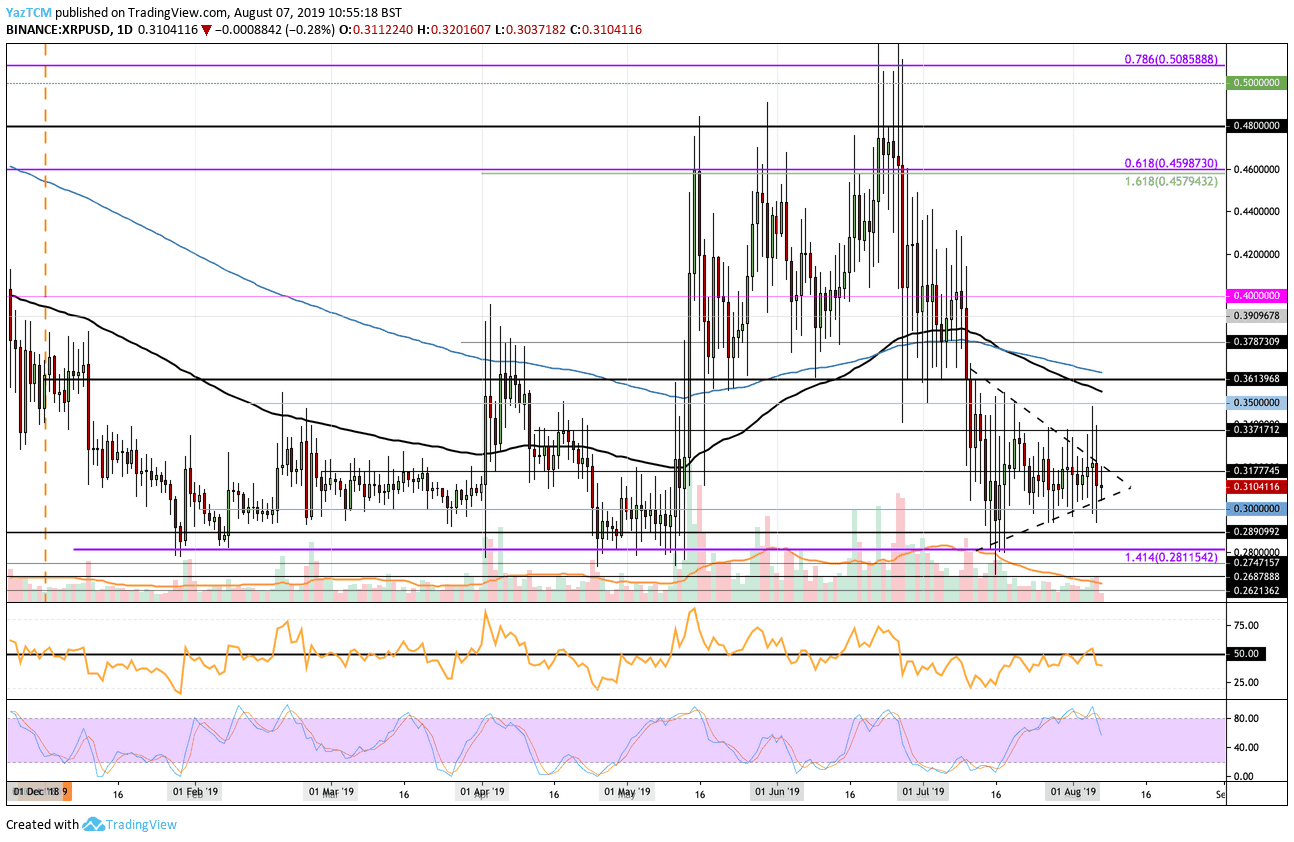
Looking at the XRP/USD 1-day chart:
- Since our previous XRP/USD analysis, XRP/USD has continued to trade within the confines of a consolidation pattern. However, this is likely to be invalidated, as the market currently shows no clear indication of which direction it will head toward, and the price could simply travel sideways through the apex.
- From above: The nearest level of resistance lies between $0.3177 and $0.32. Above this, higher resistance can be found at $0.3371, $0.35, and $0.36. The resistance between $0.36 and $0.37 is expected to be significant due to the 100 and 200-day EMAs being located here. Above $0.37, further resistance lies at $0.3787, $0.39, and $0.40.
- From below: The nearest level of support lies at $0.31. If the price breaks beneath it, we can then expect significant support at $0.30, which supported the market for the entire month of July. Beneath $0.30, support is expected at $0.2890, $0.2811, $0.28, $0.2747, $0.2687, and $0.26.
- The trading volume has increased toward the average over the past few days.
- The RSI attempted to break above 50 but failed to do so, which has resulted in the bears maintaining control of the market.
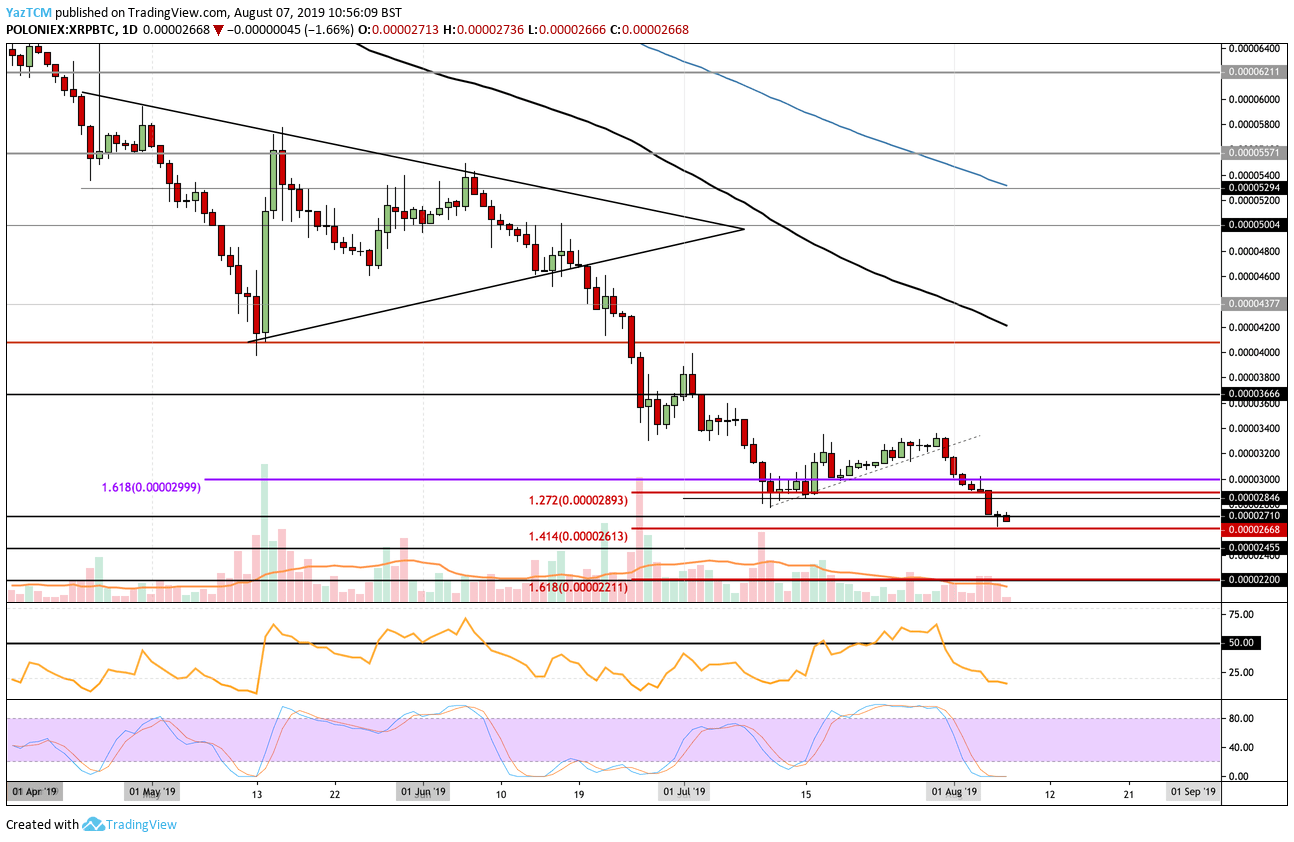
Looking at the XRP/BTC 1-day chart:
- Trading against Bitcoin, XRP’s struggles continue. Over the past week, XRP has collapsed beneath the 3000 sat level and is currently trading at around 2,668 sat.
- From above: The nearest levels of resistance lie at 2,710 sat, 2,893 sat, and 3,000 sat. Above 3,000 sat, higher resistance is at 3,400 sat, 3,666 sat, and 4,000 sat.
- From below: The nearest level of support lies at 2,613 sat (the downside 1.414 Fib extension). If the selling continues, we can expect further support at 2,455 sat, 2,300 sat and then at 2,210 sat (the downside 1.618 Fib extension).
- The trading volume has increased in August during the latest round of selling.
- The RSI has plummeted into oversold territory, which could suggest that the sellers have reached exhaustion. This sentiment is shared by the Stochastic RSI, which is trading in oversold territory as we await a bullish crossover signal.
The post Ripple Price Analysis: XRP Records 20-Month Low Against BTC, Where Is the Bottom? appeared first on CryptoPotato.