Ripple Price Analysis – XRP Holds At $0.30 But Is A Crash Against BTC Incoming?
Although XRP is still holding very strong at the support provided by the $0.30 level, the situation is starting to look very bleak against Bitcoin, as the cryptocurrency is on the trajectory to create fresh 2019 lows if it continues to fall. XRP has suffered a 22% price drop over the past 30 days and is currently trading at around $0.3149.
XRP remains the third-largest cryptocurrency with a market cap of $13.58 billion. The technical indicators are aligned to push XRP lower which we will explore below.
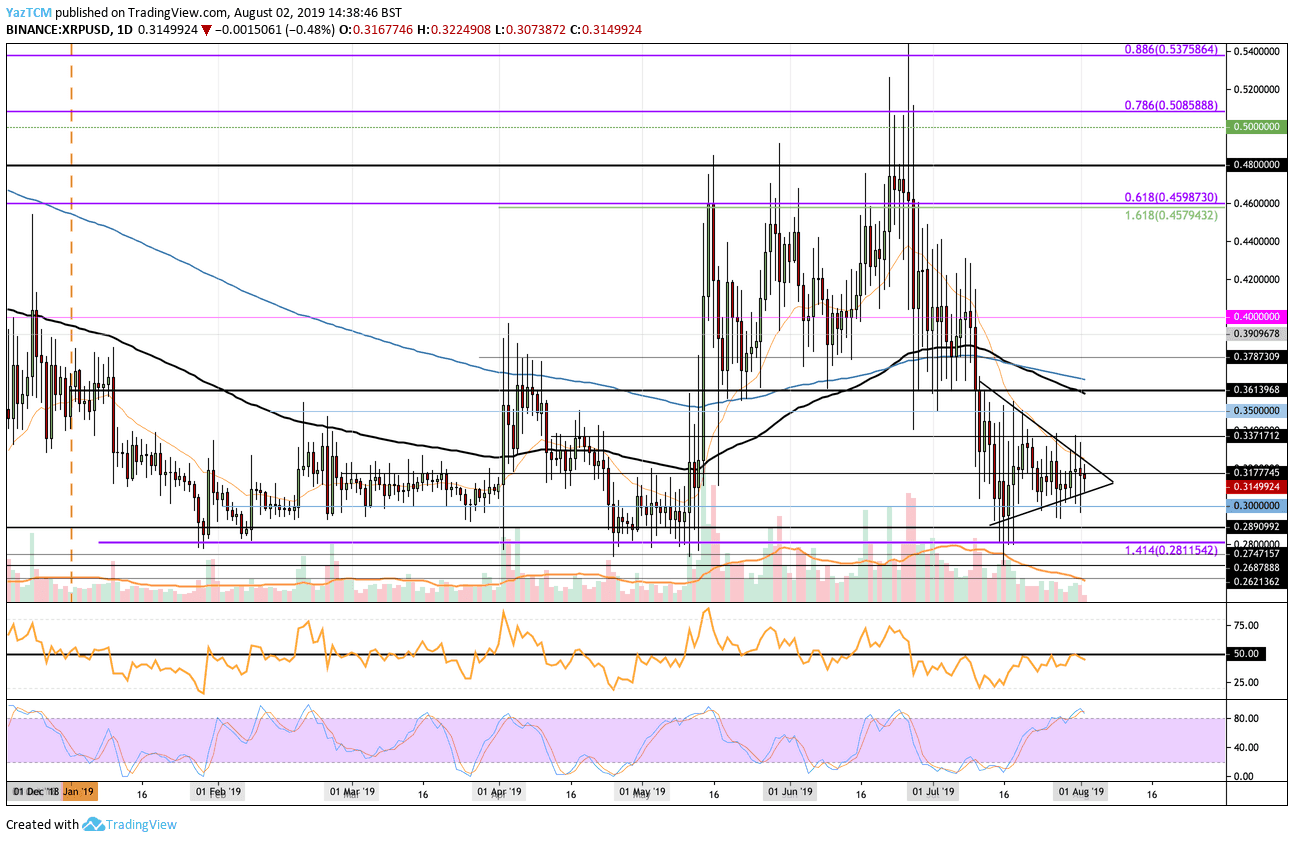
Looking at the XRP/USD 1-Day Chart:
- Since our previous XRP/USD analysis, we can see that XRP has dropped back toward $0.30 but has continued to hold at this level of support. The cryptocurrency has now started to form a symmetrical triangle consolidation pattern in the short term with all indicators suggesting a break below. However, as this is a short term triangle, we should not give too much weight to this as the price could potentially just travel sideways through the apex causing it to become invalidated.
- From above: If the buyers can break above the resistance at $0.3177 the next level of resistance is located at the upper boundary of the triangle. After that, higher resistance can be found at $0.3317 and $0.35. If the buyers continue beyond $0.35, further resistance is located around $0.36 -$ 0.365 which contains both the 100 days EMA and 200 days EMA.
- From below: The nearest level of support lies at the lower boundary of the triangle. Beneath this, the next level of strong support lies at the $0.30. Beneath $0.30, support can be found at $0.2890, $0.2811, $0.28, $0.2727 and, $0.26.
- The trading volume has been decreasing since mid-June and shows no sign of increasing.
- As previously mentioned, the technical indicators are suggesting a move lower. The RSI has recently battled with the 50 level but has failed to break above after 3 attempts. Furthermore, the Stochastic RSI has recently produced a bearish crossover signal in overbought conditions which suggest a move lower.
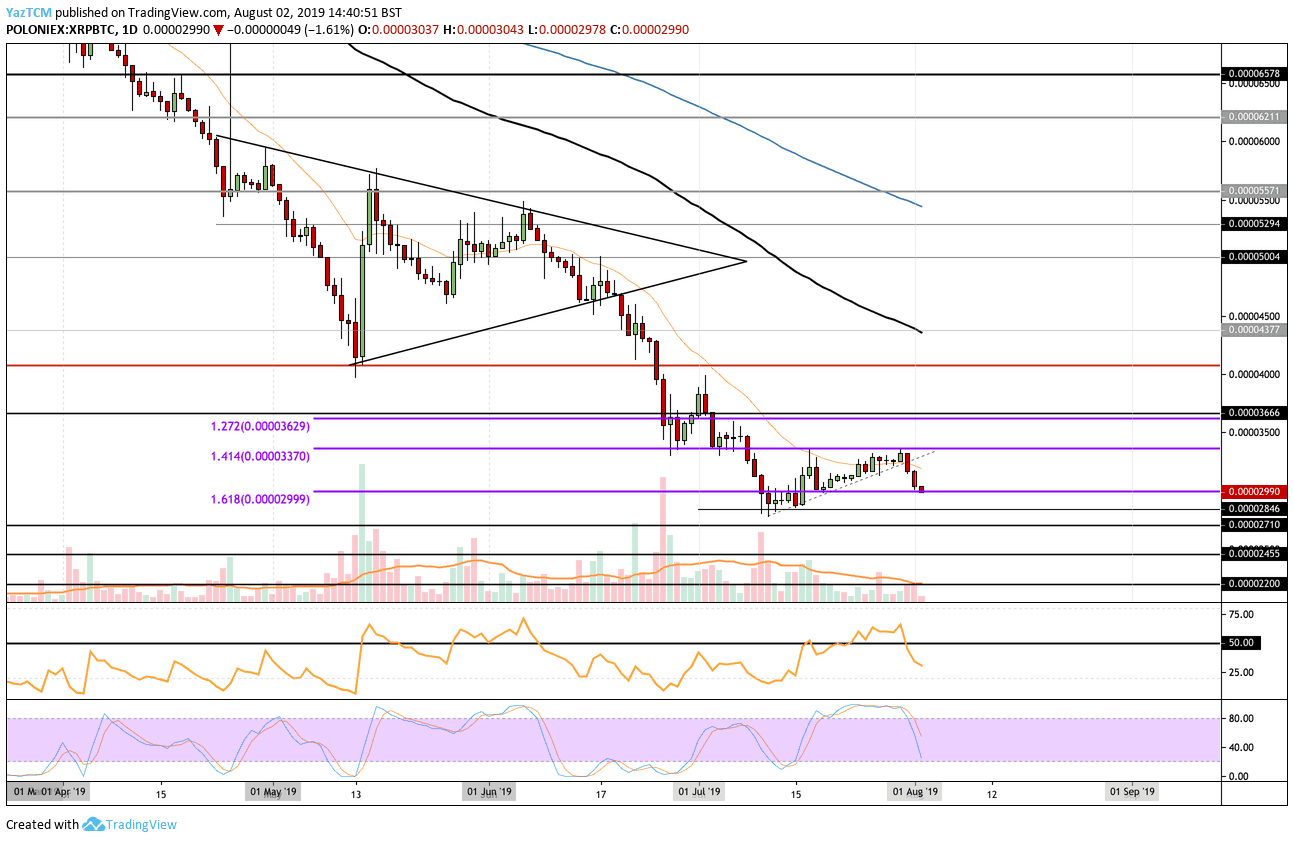
Looking at the XRP/BTC 1-Day Chart:
- Against Bitcoin, we can clearly see how the situation is becoming bleak. The market was previously trading in a symmetrical triangle which had become invalidated when resistance was met at 3370 SAT. XRP was unable to break above this resistance which had caused a drop down to 2990 SAT.
- From above: The nearest levels of resistance lie at 3000 SAT and 3370 SAT. Above this, higher resistance lies at 3630 SAT, 3666 SAT and 4000 SAT. If the bulls can break above 4000 SAT, further resistance is found at 4377 SAT (100 days EMA) and 5000 SAT.
- From below: If the sellers continue to push the market beneath the current level at 2990 SAT, the next level of support is at 2846 SAT which had provided support for the market during June. Beneath this, more support is found at 2710 SAT, 2455 SAT, and 2200 SAT.
- The trading volume has also significantly decreased since mid-July.
- The Stochastic RSI had recently produced a bearish crossover signal which marked the move lower. Furthermore, the RSI has now broken beneath the 50 level as the bears gain control of the market momentum.
The post Ripple Price Analysis – XRP Holds At $0.30 But Is A Crash Against BTC Incoming? appeared first on CryptoPotato.