Ripple Price Analysis: XRP Crashes Below 2019 Highs With a 6% Daily Loss
XRP/USD – XRP Rejected At Price Channel Upper Angle
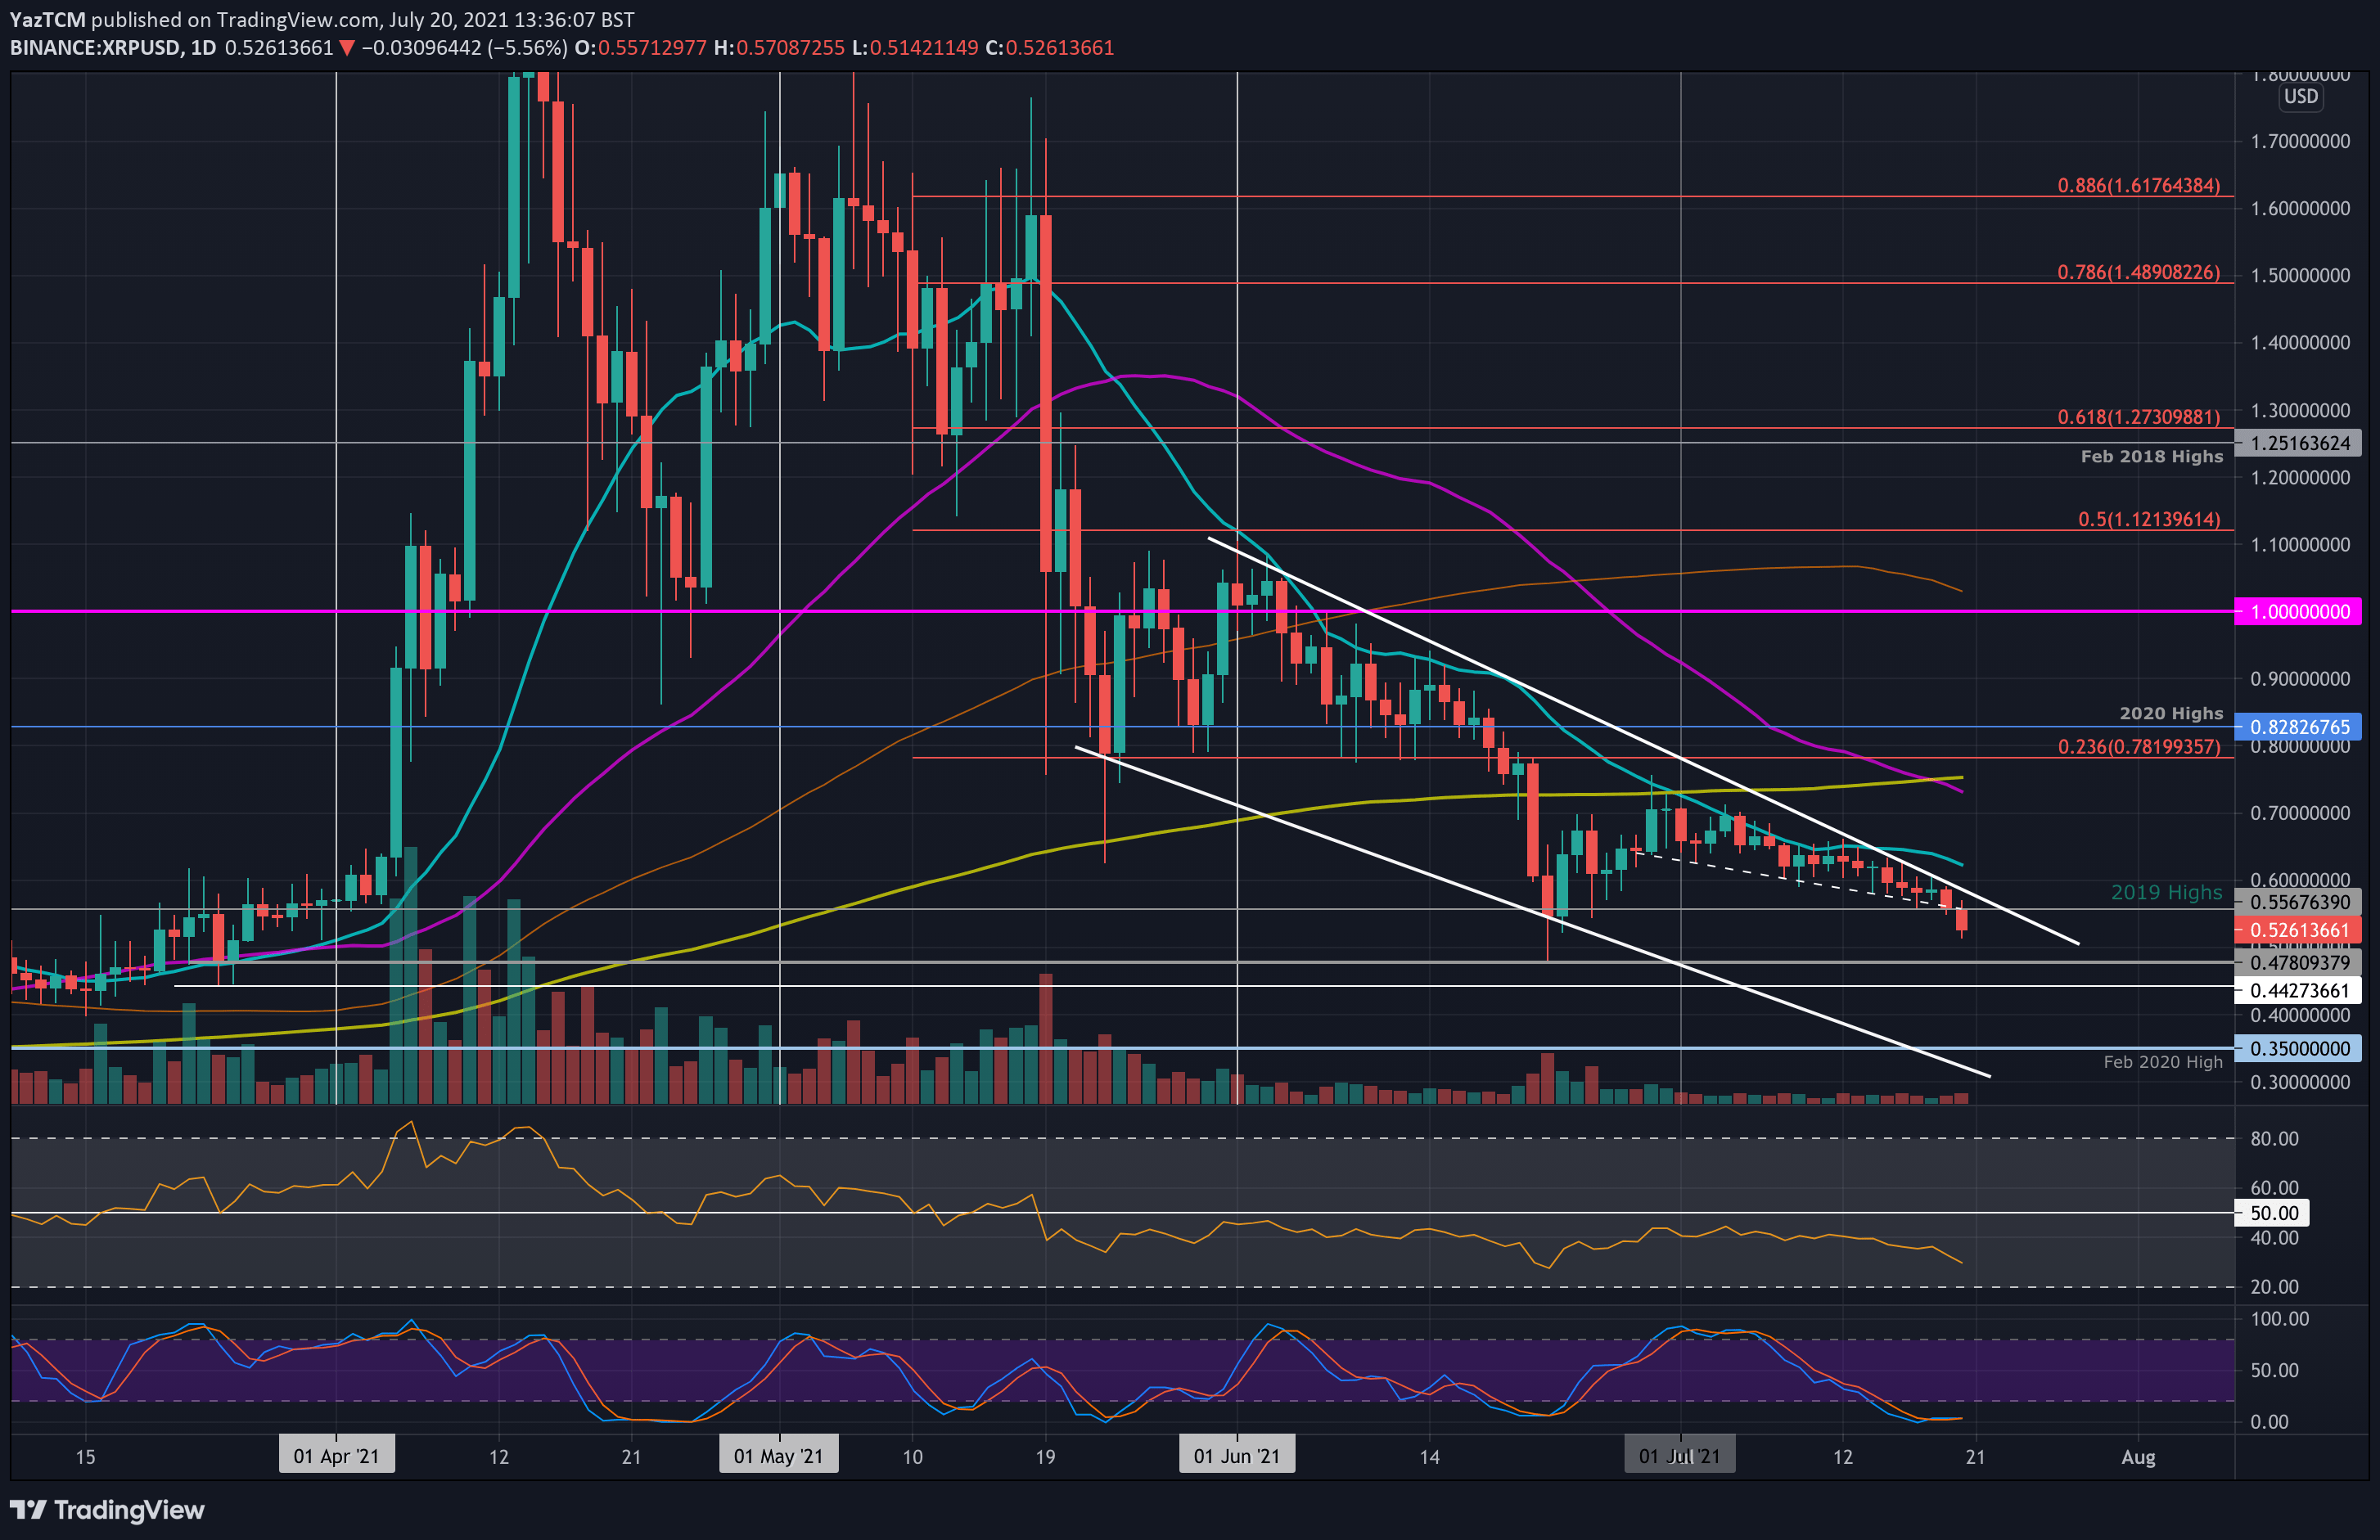
Key Support Levels: $0.5, $0.478, $0.331.
Key Resistance Levels: $0.55, $0.62, $0.7.
The 6% price fall today caused XRP to break beneath $0.55 (2019 highs). It has been trading inside a descending price channel since the start of June. Last week, the coin was rejected at the upper angle of this channel on numerous days.
Today, XRP dropped below a short-term falling wedge established at the start of July. As a result, it can continue to trend lower until it can break the upper angle of the descending price channel.
XRP-USD Short Term Price Prediction
Looking ahead, if the sellers push lower, the first strong support lies at $0.5. This is followed by $0.478 (June lows), $0.331, and $0.4. Finally, added support lies at $0.35 (Feb 2020 lows).
On the other side, the first resistance lies at $0.55 (2019 highs). This is followed by the upper angle of the descending price channel. Finally, resistance lies at $0.62 (20-day MA), $0.7, and $0.72 (50-day MA) beyond the price channel.
The RSI is in the bearish favor as it sinks further beneath the midline, indicating increasing bearish momentum.
XRP/BTC – XRP Falls Beneath Symmetrical Triangle
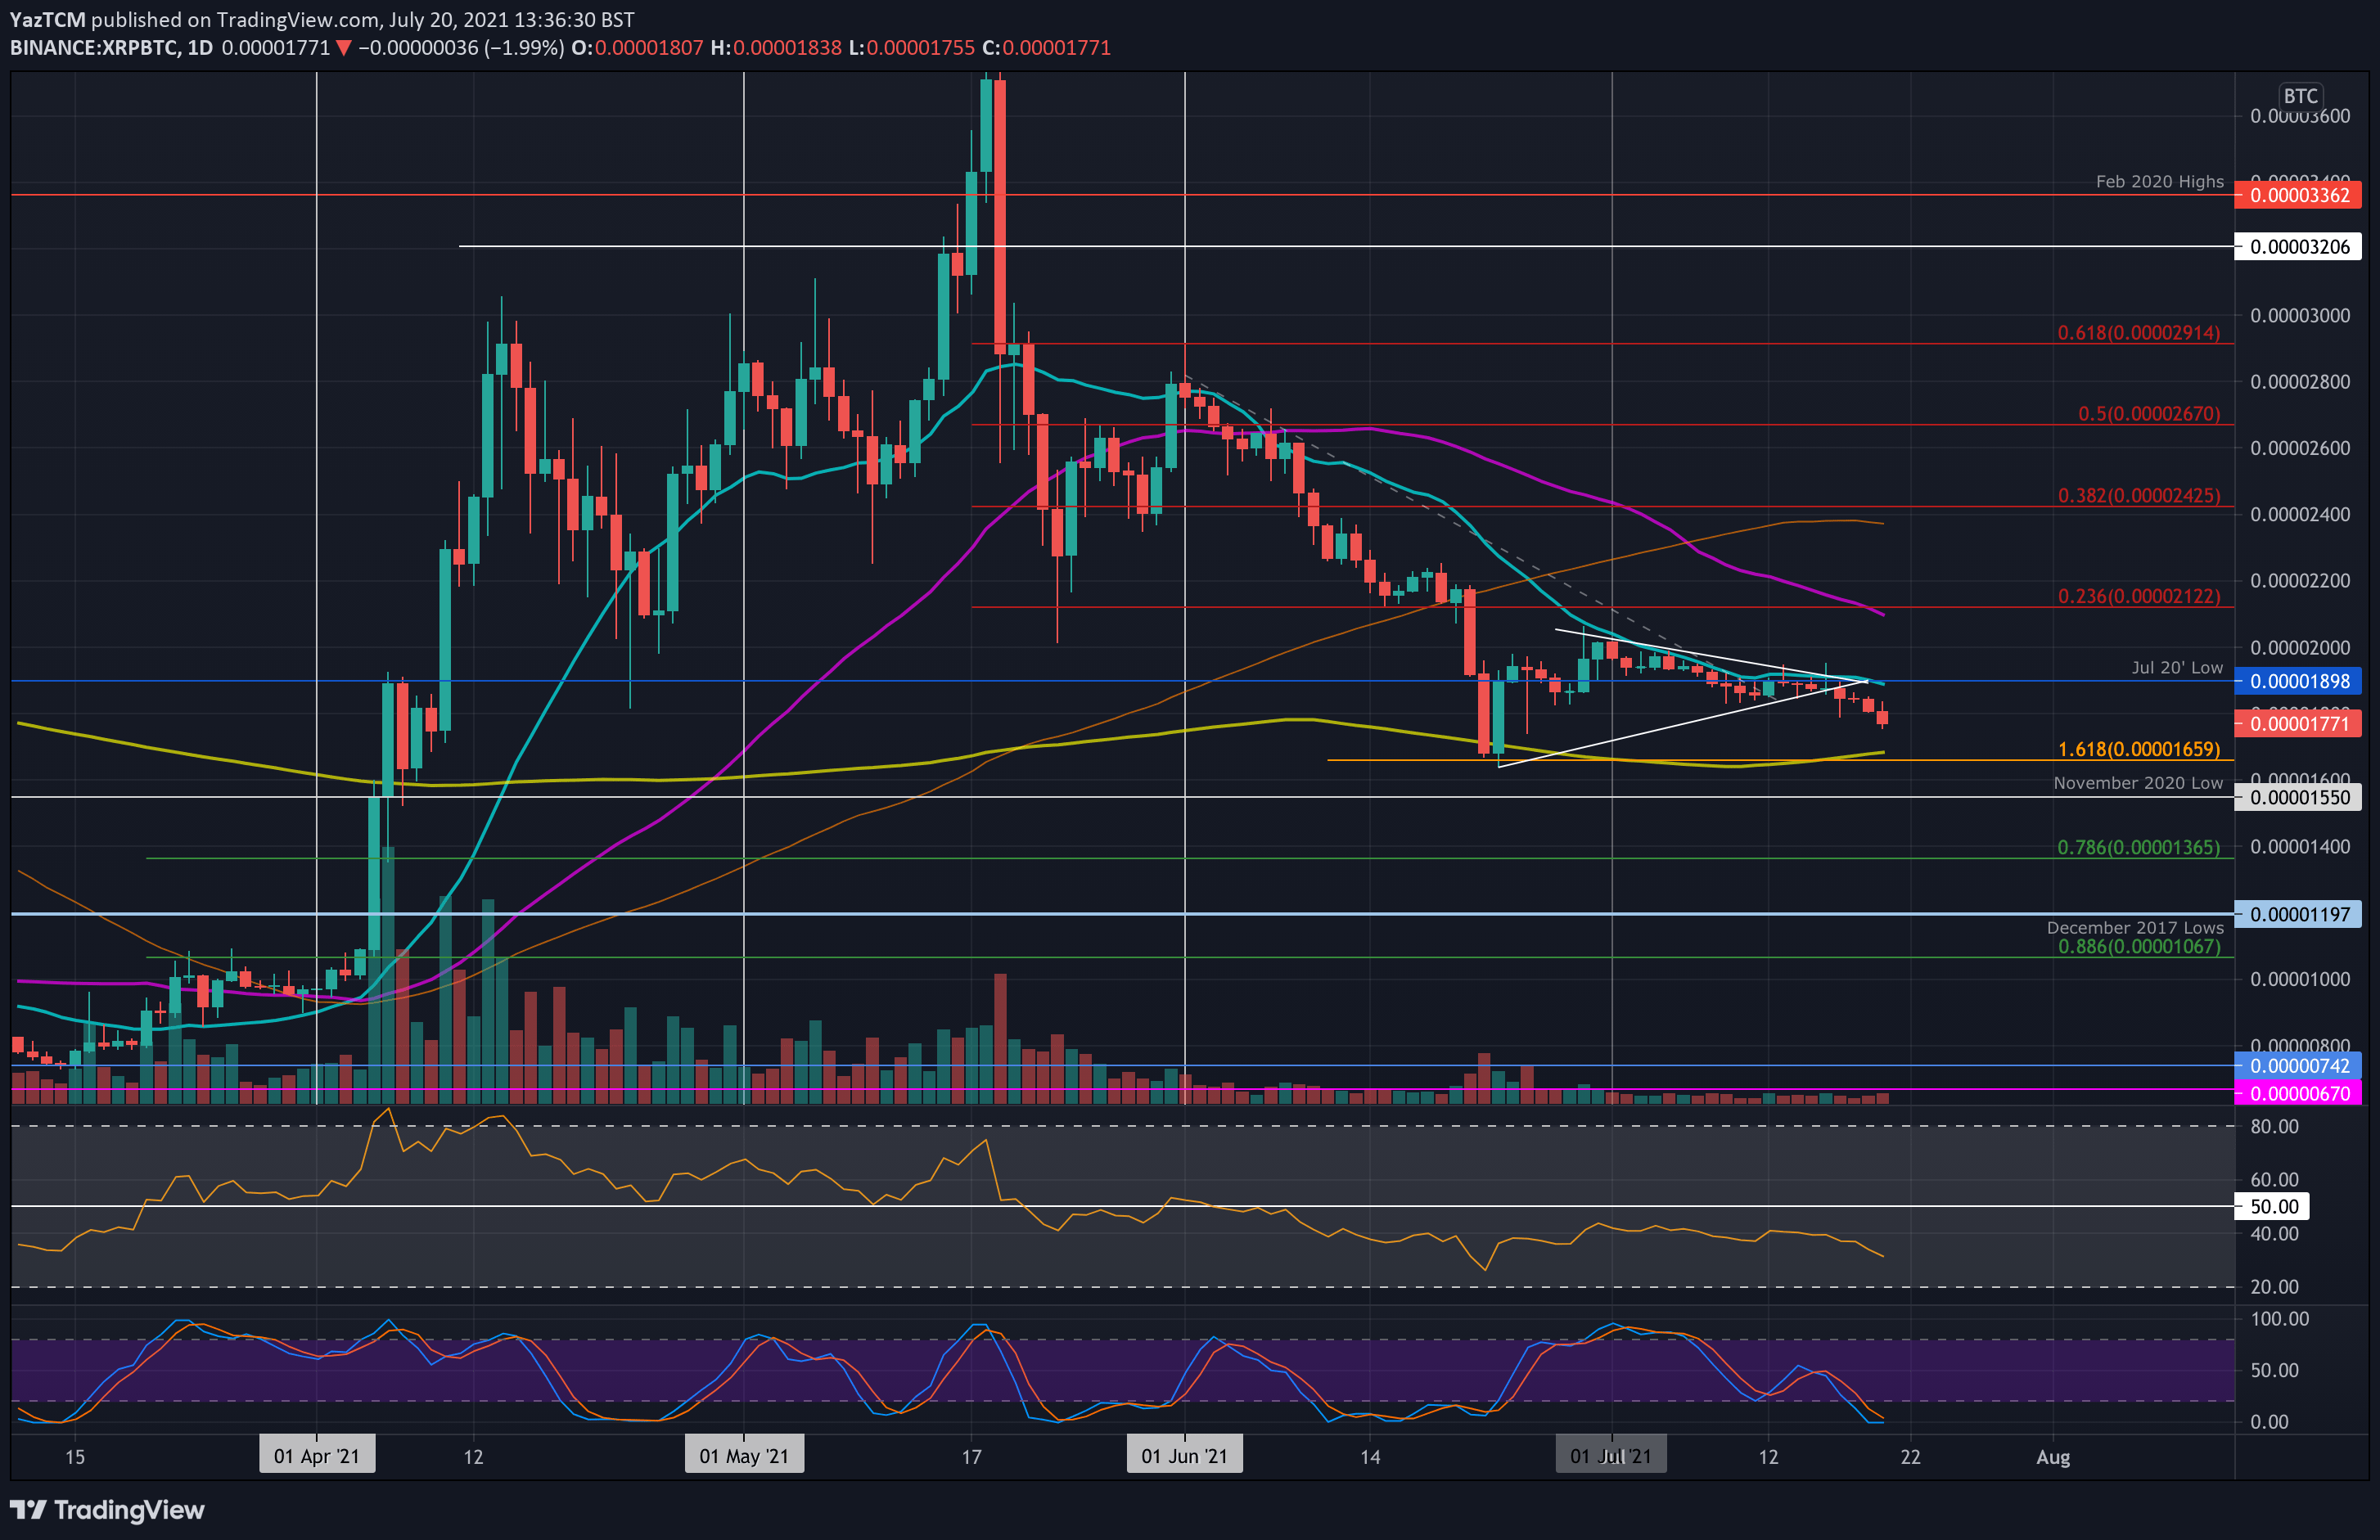
Key Support Levels: 1660 SAT, 1550 SAT, 1500 SAT.
Key Resistance Levels: 1900 SAT 2000 SAT, 2100 SAT.
Against BTC, XRP was trading inside a symmetrical triangle pattern for the majority of July. However, over the past week, the coin struggled to break resistance at 1900 SAT, provided by the 20-day MA.
XRP fell beneath the triangle on Saturday, indicating the bearish direction for the market. The next significant support now lies at the 200-day MA below.
XRP-BTC Short Term Price Prediction
Looking ahead, the first support to the downside lies at 1660 SAT (200-day MA & downside 1.618 Fib Extension). Beneath this, added support lies at 1550 SAT, 1500 SAT, and 1365 SAT (.786 Fib).
On the other side, the first resistance lies at 1900 SAT (July 2020 low & 20-day MA). This is followed by 2000 SAT, 2100 SAT (50-day MA), and 2390 SAT (100-day MA).
Again, the RIS is sinking beneath the midline, indicating that the bearish momentum is increasing in the market.