Ripple Price Analysis: XRP Bullish Against Bitcoin, But Can It Break Above $0.30?
XRP saw a price decline of around 2% over the past 24 hours and it currently trades at $0.29. This latest decrease is largely due to the fact that BTC fell by 2.10% over the same period. Against Bitcoin, XRP is performing relatively well as it continues to make higher highs during October 2019.
XRP remains the third-largest cryptocurrency with a market cap of $12.57 billion.
Looking at the XRP/USD 1-Day Chart:
- Since our previous XRP/USD analysis, the cryptocurrency made another attempt at the $0.30 level and managed to climb as high as $0.308 before the market rolled over and fell back beneath $0.30.
- From above: The nearest level of resistance lies at $0.30. Above this, resistance lies at $0.308, $0.3177 (200-days EMA), and $0.3262 (bearish .382 Fib Retracement). Higher resistance is expected at $0.3371, $0.35, and $0.3613.
- From below: The nearest level of support lies at $0.2890 (100-days EMA). Beneath this, support is located at $0.2811, $0.27, $0.26, and $0.2584. Further support toward the downside is expected at $0.2518, $0.25, and $0.24.
- The trading volume still remains relatively high when compared with September.
- The RSI is above the 50 level but is slowly fading which could be a sign that the bullish momentum may be fading. Furthermore, the Stocahstic RSI had recently produced a bearish crossover signal which favors the bears.

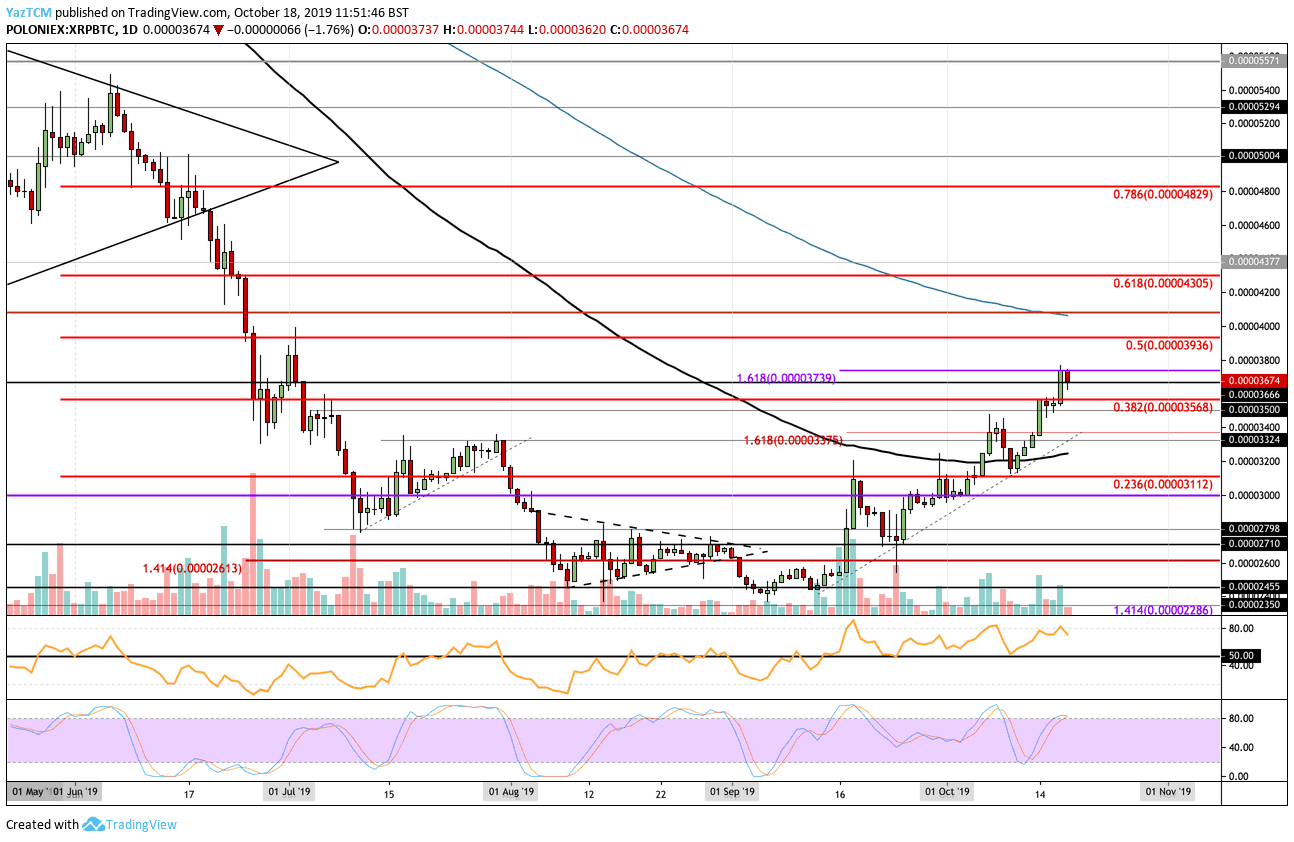
Looking at the XRP/BTC 1-Day Chart:
- Against Bitcoin, XRP managed to smash above the resistance at 3568 SAT. XRP continued to climb higher to reach the current level of resistance at 3739 SAT, provided by a 1.618 Fib Extension.
- From above: The nearest level of resistance lies at 3739 SAT. Above this, resistance lies at 3800 SAT, 3936 SAT (bearish .5 Fib Retracement), 4060 SAT (200-days EMA), and 4305 SAT (bearish .618 Fib Retracement).
- From below: The nearest level of support lies at 3666 SAT. Beneath this, support lies at 3568 SAT, 3500 SAT, 3375 SAT, and 3200 SAT (100-days EMA). Further support can be found at 3112 SAT and 3000 SAT.
- The trading volume remains quite low when compared with September’s volume.
- The RSI is well within the favor of the bulls as it remains well above 50. However, the Stochastic RSI is warning to remain cautious as it is primed for a bearish crossover signal.
The post Ripple Price Analysis: XRP Bullish Against Bitcoin, But Can It Break Above $0.30? appeared first on CryptoPotato.