Ripple Price Analysis: What XRP Needs to Break Out of Consolidation
XRP has been showing signs of quiet accumulation within a broader consolidation structure. As of today, it continues to trade below major resistance zones but is building a compelling technical structure that could precede a significant move if confirmed by volume and momentum shifts.
Technical Analysis
The USDT Pair
Looking at the XRP/USDT pair, the price remains tightly compressed inside a descending channel that has been developing since early 2025. The 100-day moving average (orange) is acting as dynamic support, while the 200-day moving average (blue) is now sloping upward and serving as another stronger support element.
The price action recently tapped the upper bound of this triangle near $2.60 but failed to break through convincingly. Meanwhile, the buyers are currently defending the $2.40–$2.30 zone. A daily candle close above the $2.80 area could trigger bullish continuation, with $3 and $4 as immediate upside targets.
Conversely, a breakdown below $2 would invalidate the structure and likely lead to a drop toward the lower boundary of the channel near the $1.5 mark.
The BTC Pair
Against Bitcoin, XRP is hovering just above key support at 2200 SAT, a level that has repeatedly held since mid-April. The pair has been trending lower within a descending channel, compressing against horizontal support. Both the 100-day and 200-day moving averages are now flattening out above the current price, acting as key dynamic resistance levels.
This setup reflects a bearish bias unless bulls can reclaim 2400 SAT and push out of the descending channel and above the moving averages. The momentum is also clearly weakening, as reflected by the RSI sitting near 40, indicating a lack of bullish strength. If 2200 SAT is lost, XRP/BTC could quickly slide to the 1600-1800 SAT range, which is the next visible demand zone.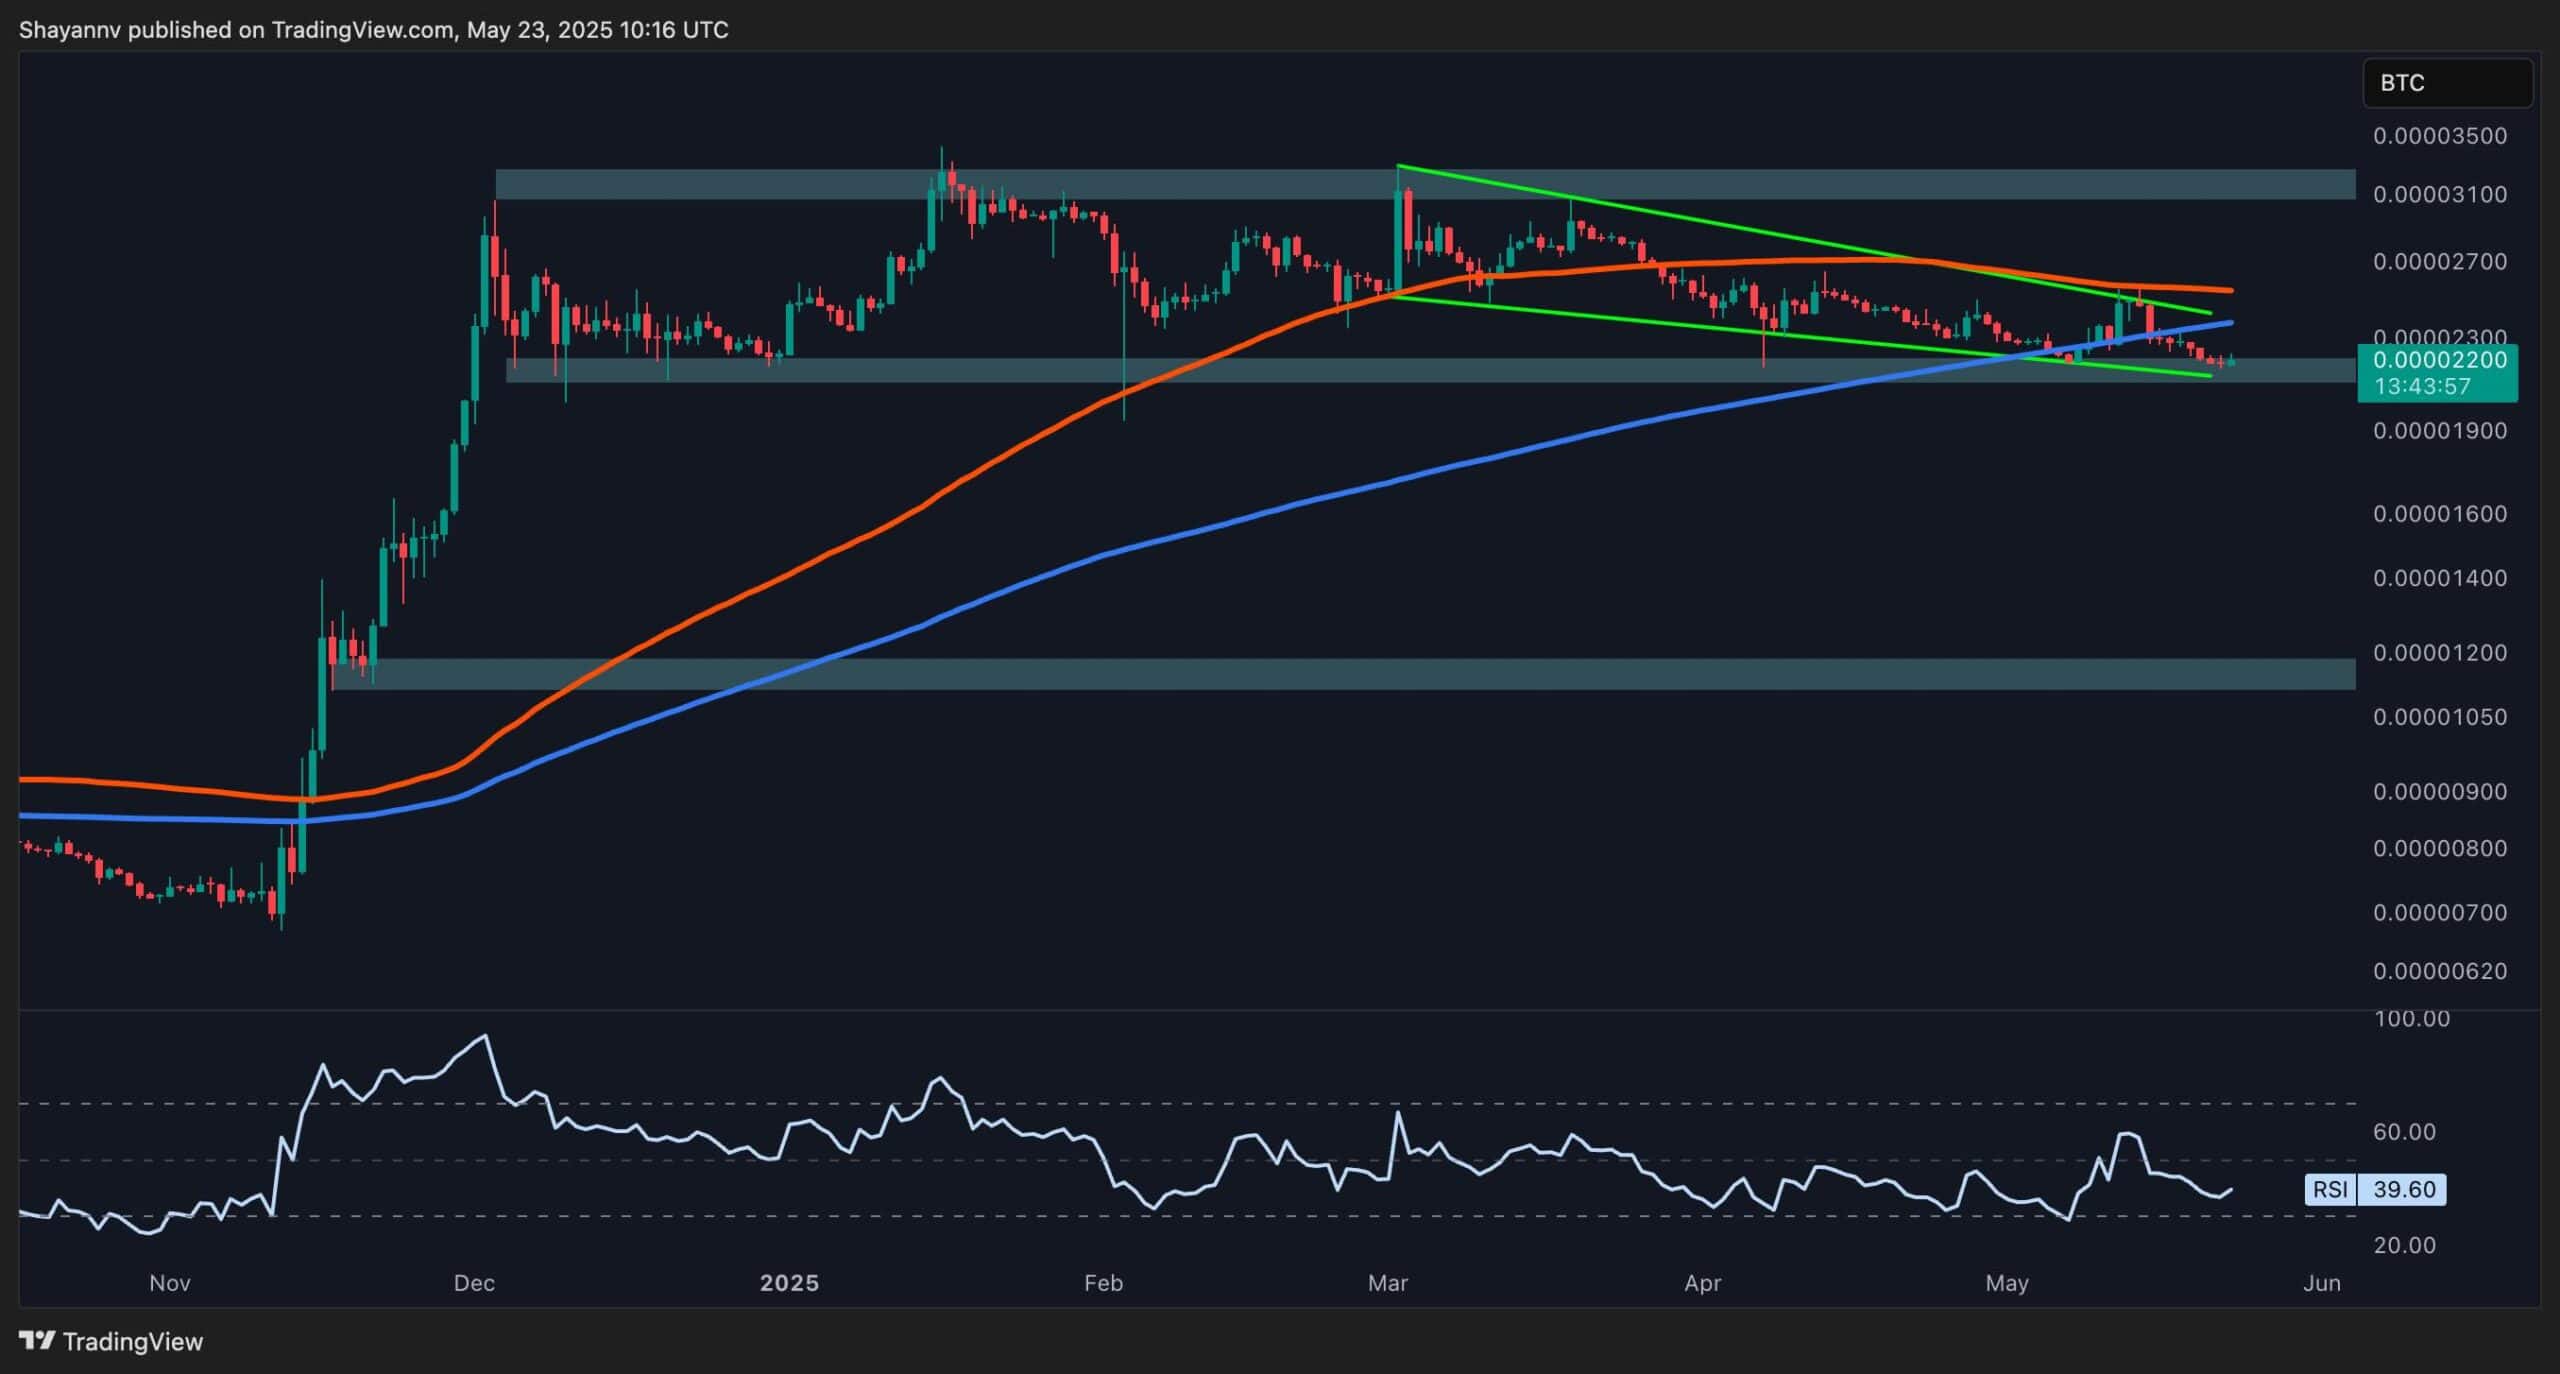
The post Ripple Price Analysis: What XRP Needs to Break Out of Consolidation appeared first on CryptoPotato.