Ripple Price Analysis Jan.31: Following 7% Gains – The Daily Chart Reveals a Massive Bearish H&S Formation
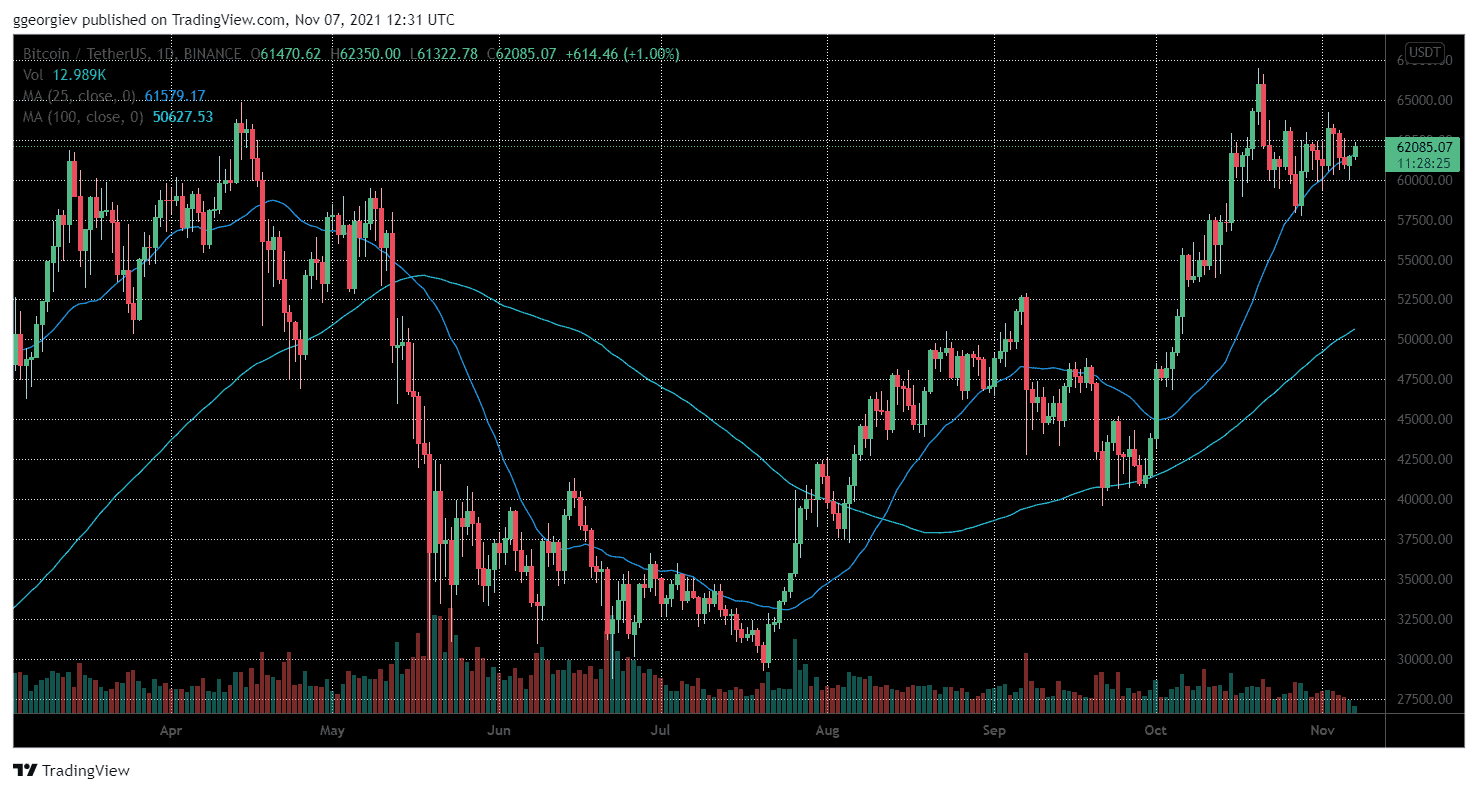
The Crypto market’s volume is decreasing as BTC chart is getting closer and closer to the edge of the descending trend-line that has been formed in the past month (since December 28).
This technical formation and volume decline, together with the uncertainty of the fundamentals, result in a situation the bears and the bulls are waiting for the next market’s trigger to point on the next move.
XRP is currently trading at the $0.314 price area, which is not too far from where it was traded during our previous price analysis.
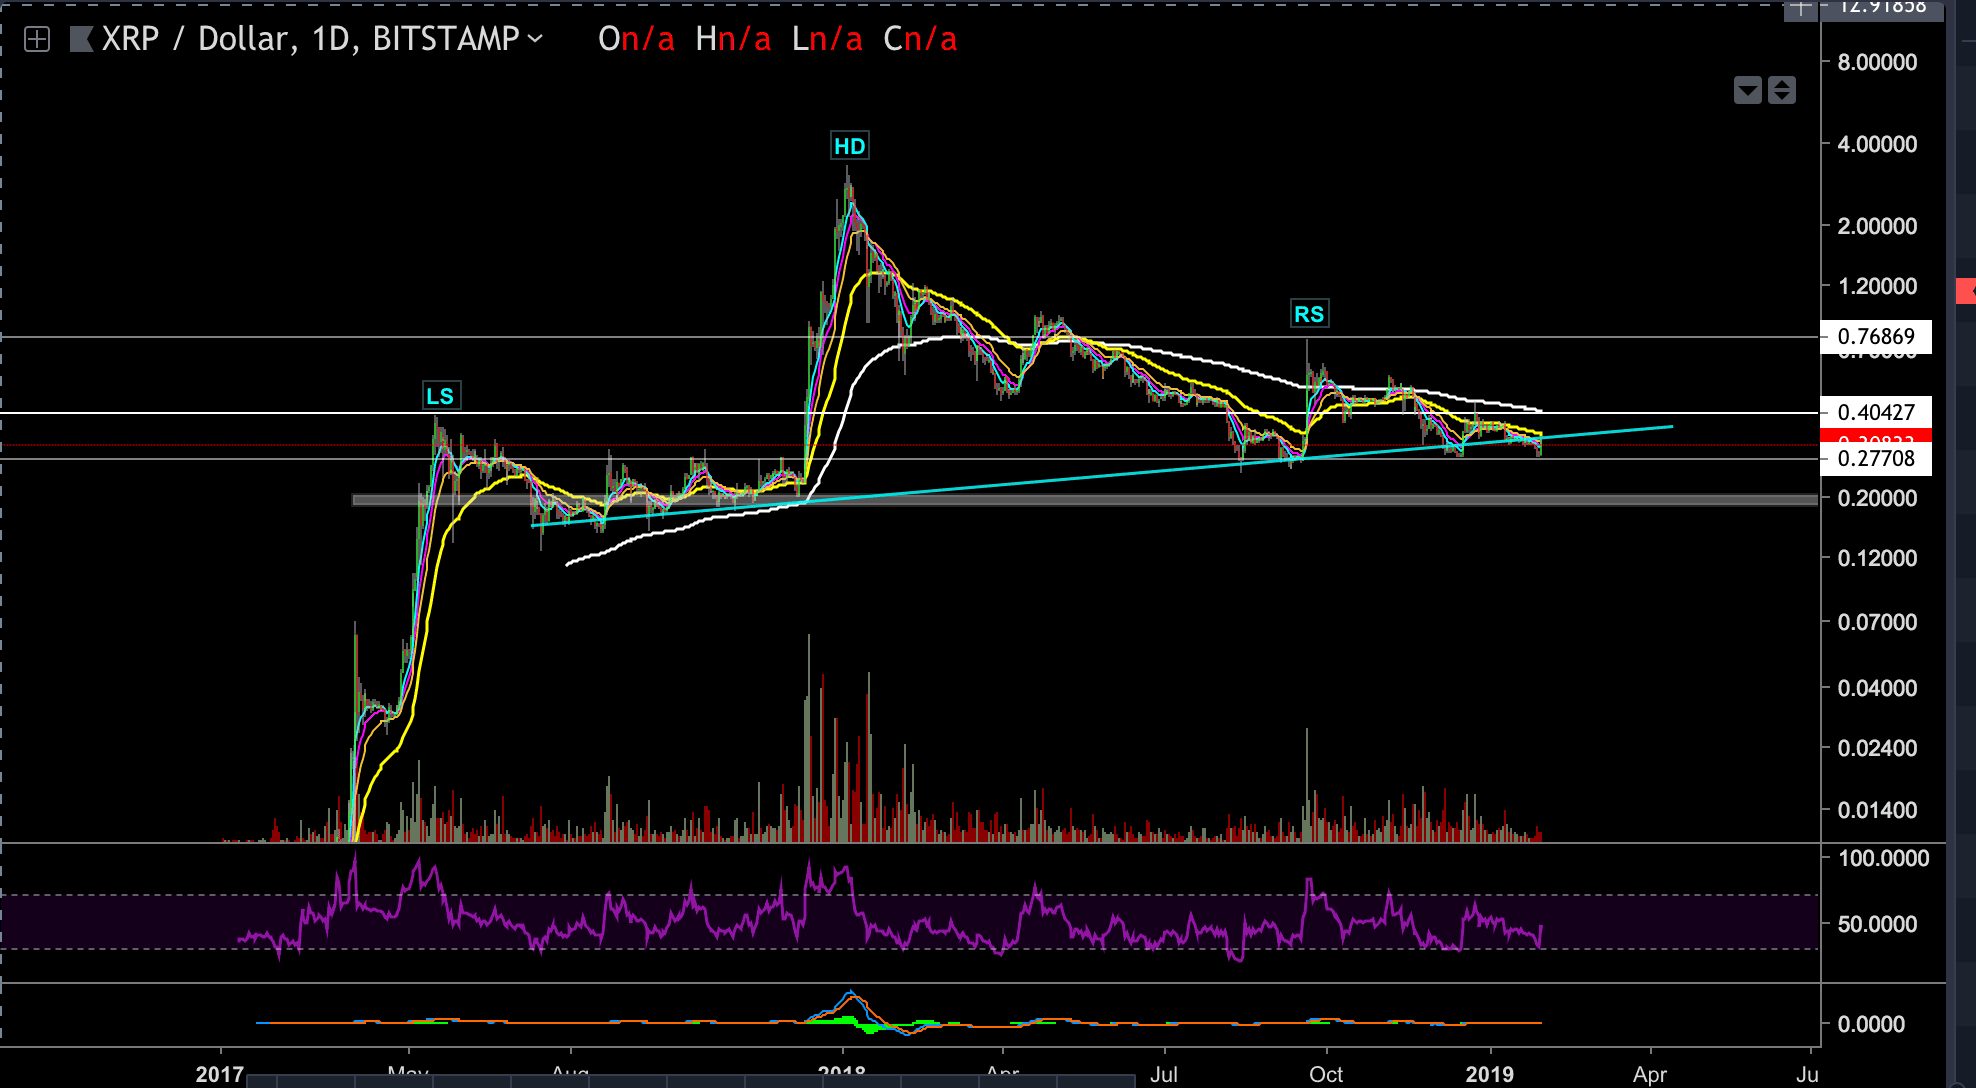
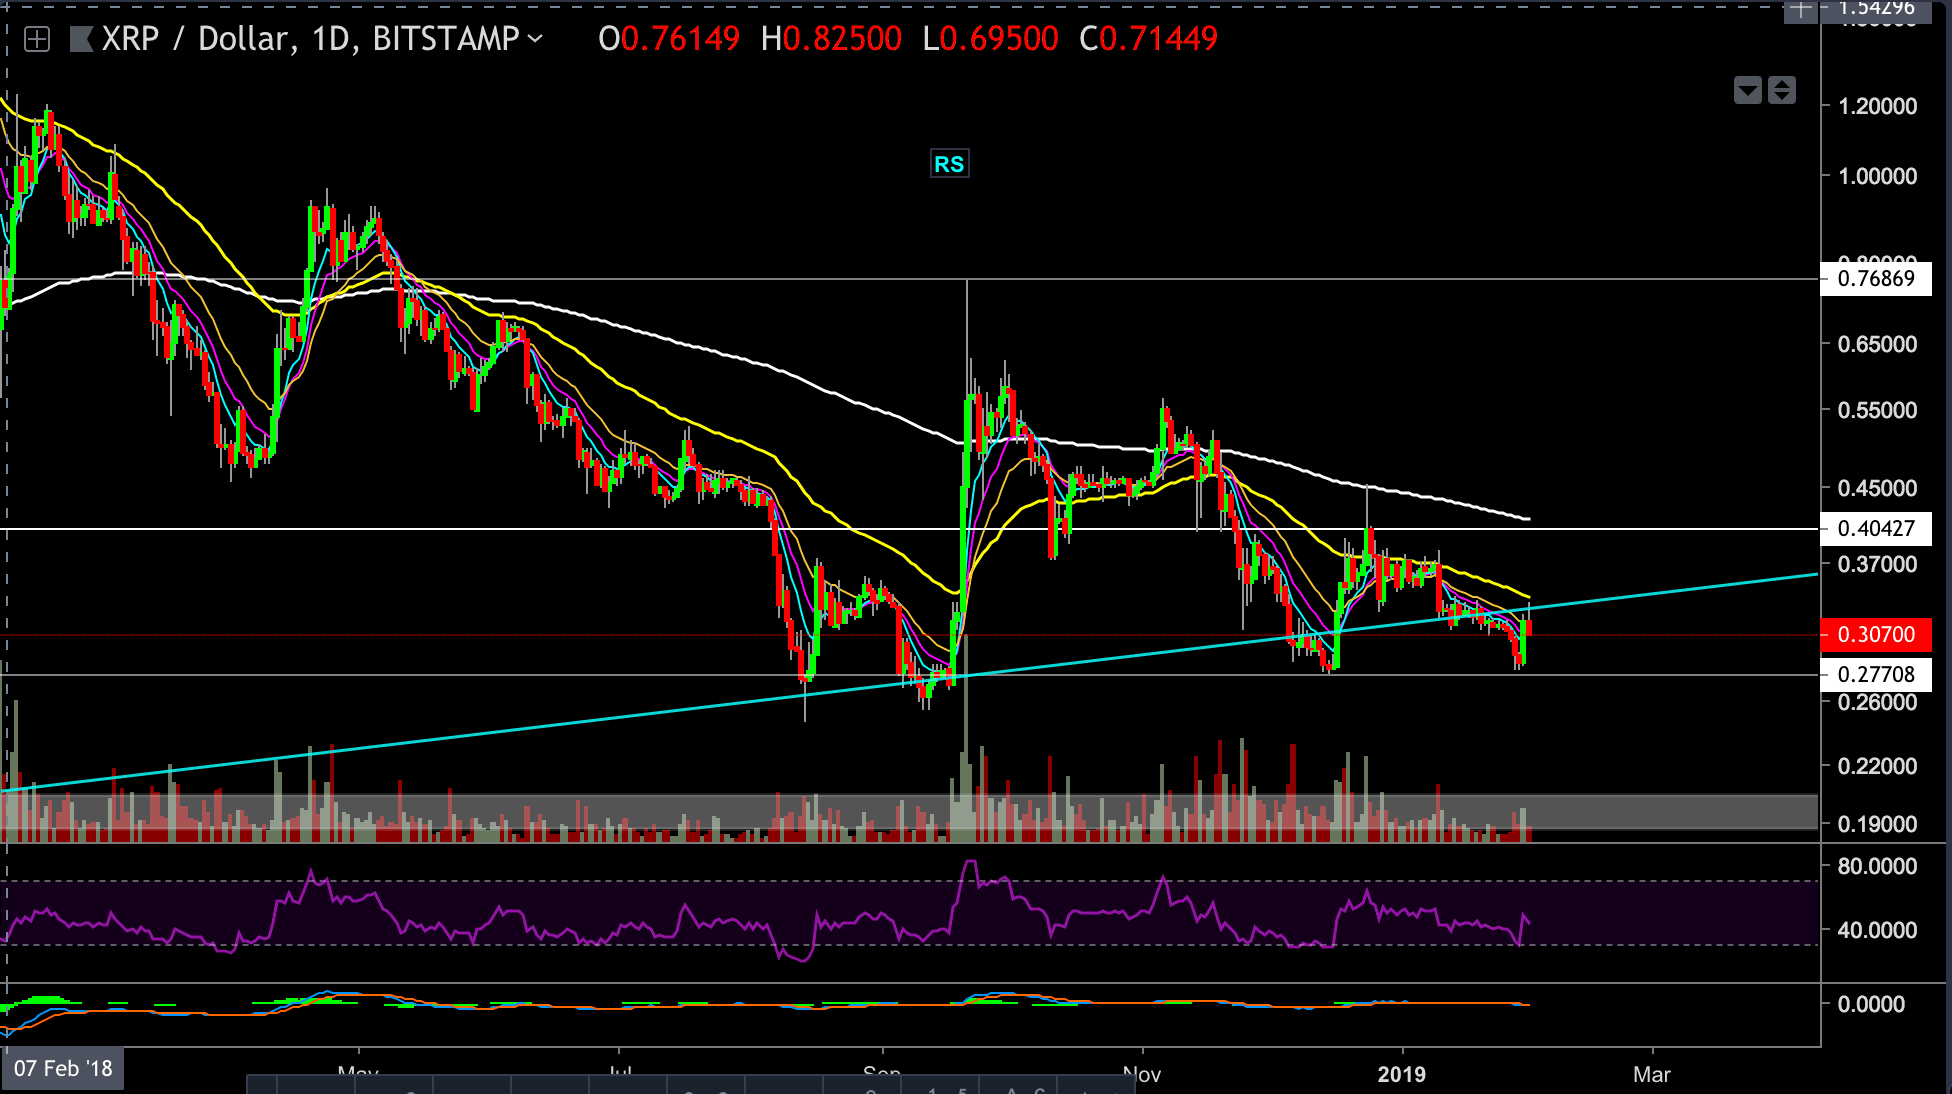
Looking at the XRP-USD 1-Day chart:
- XRP is retesting the supporting trend-line that has been holding up the price since July 2017, a crucial ascending trend-line.
- A decisive break below the above line will probably trigger a bearish scenario, which could lead XRP price ~13% down, towards the $0.277 support level. The last level was mentioned in our previous In case the $0.277 area doesn’t hold, XRP could tumble lower toward the $0.2 support zone which is a 35% decline from current prices (daily chart).
- We could also notice a massive Head and Shoulders formation that has been developing since 2017, despite that it’s not the prettiest H&S formation, this formation has a potential to trigger a devastating move with long-term targets around $0.07.
- On the more bullish scenario, if the daily trend line support level holds the current price level, following buyers strength, then XRP could end-up retesting the $0.4 resistance level, which we have mentioned many times here. This level would be the highest price level of XRP since the rally of May 2017.
- The daily chart 200 EMA is also awaiting as a resistance level, around $4.
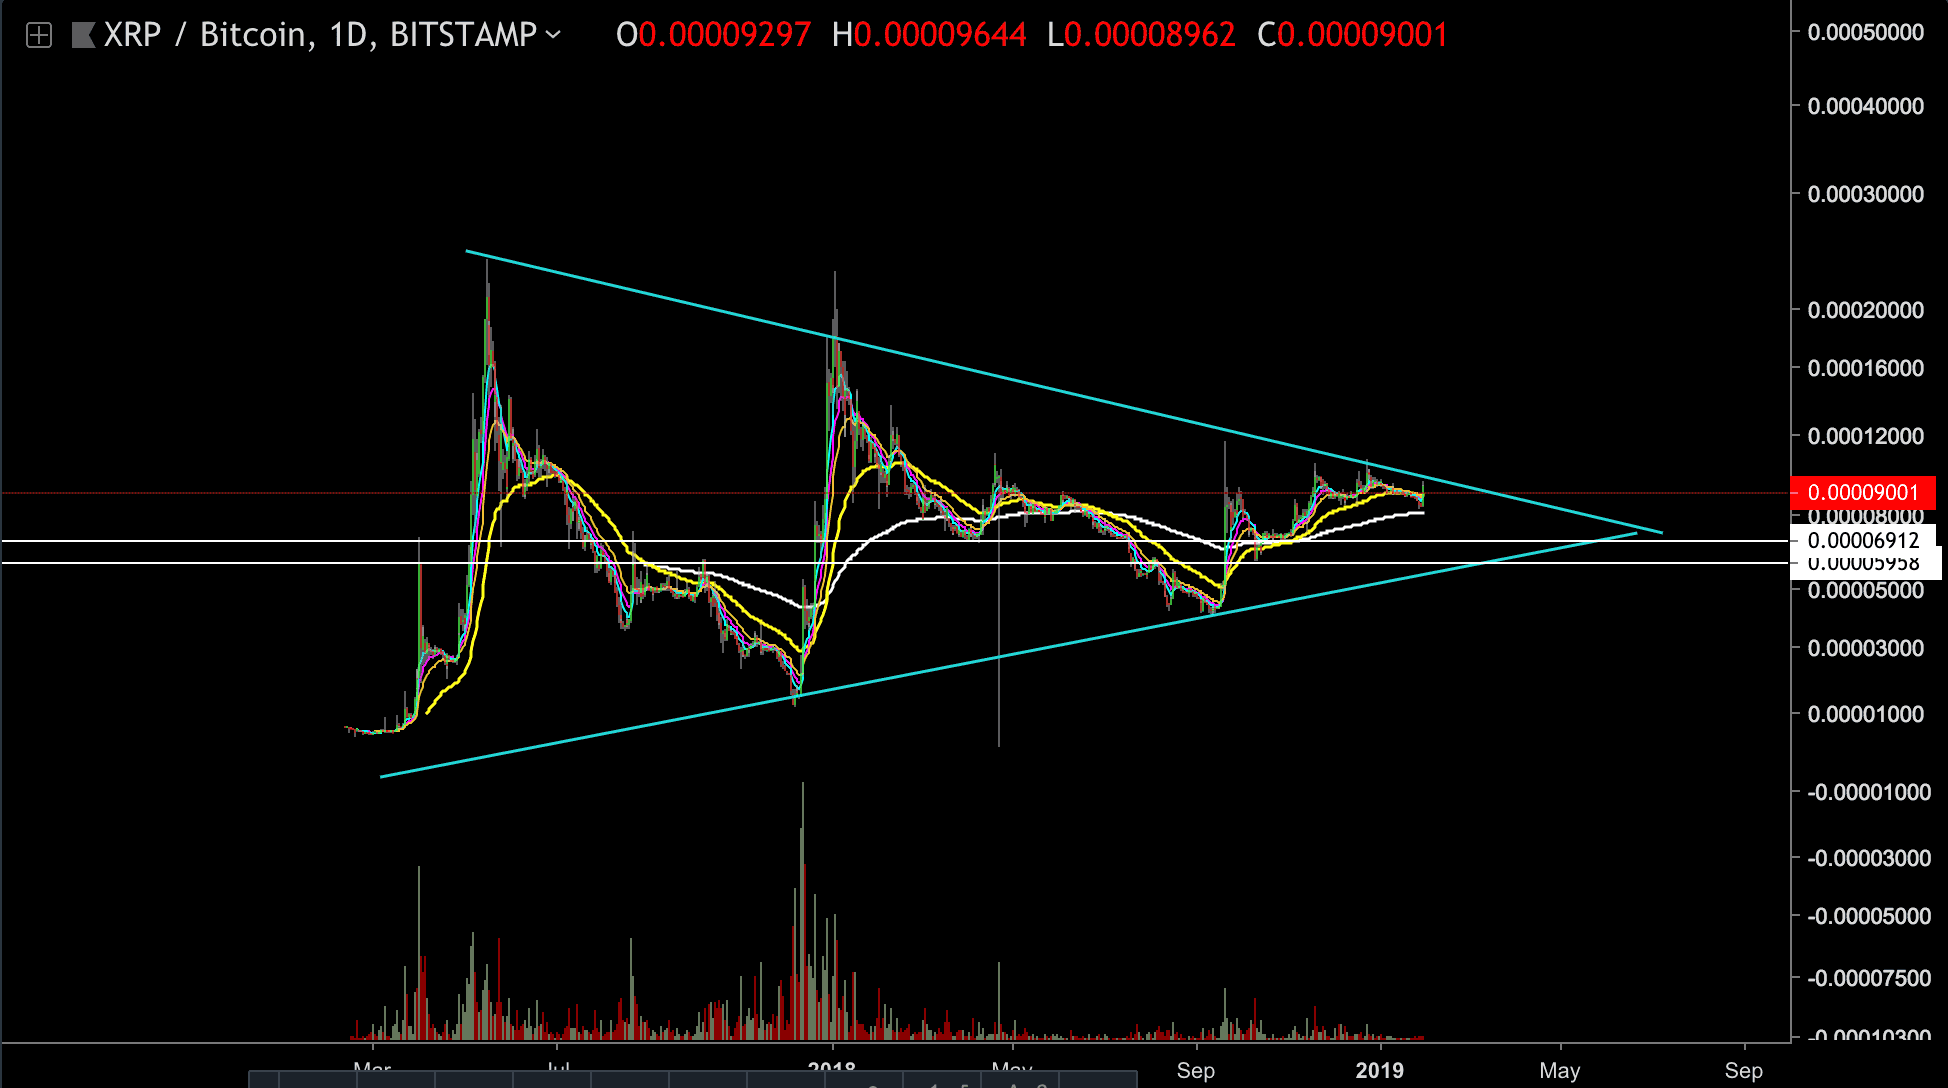
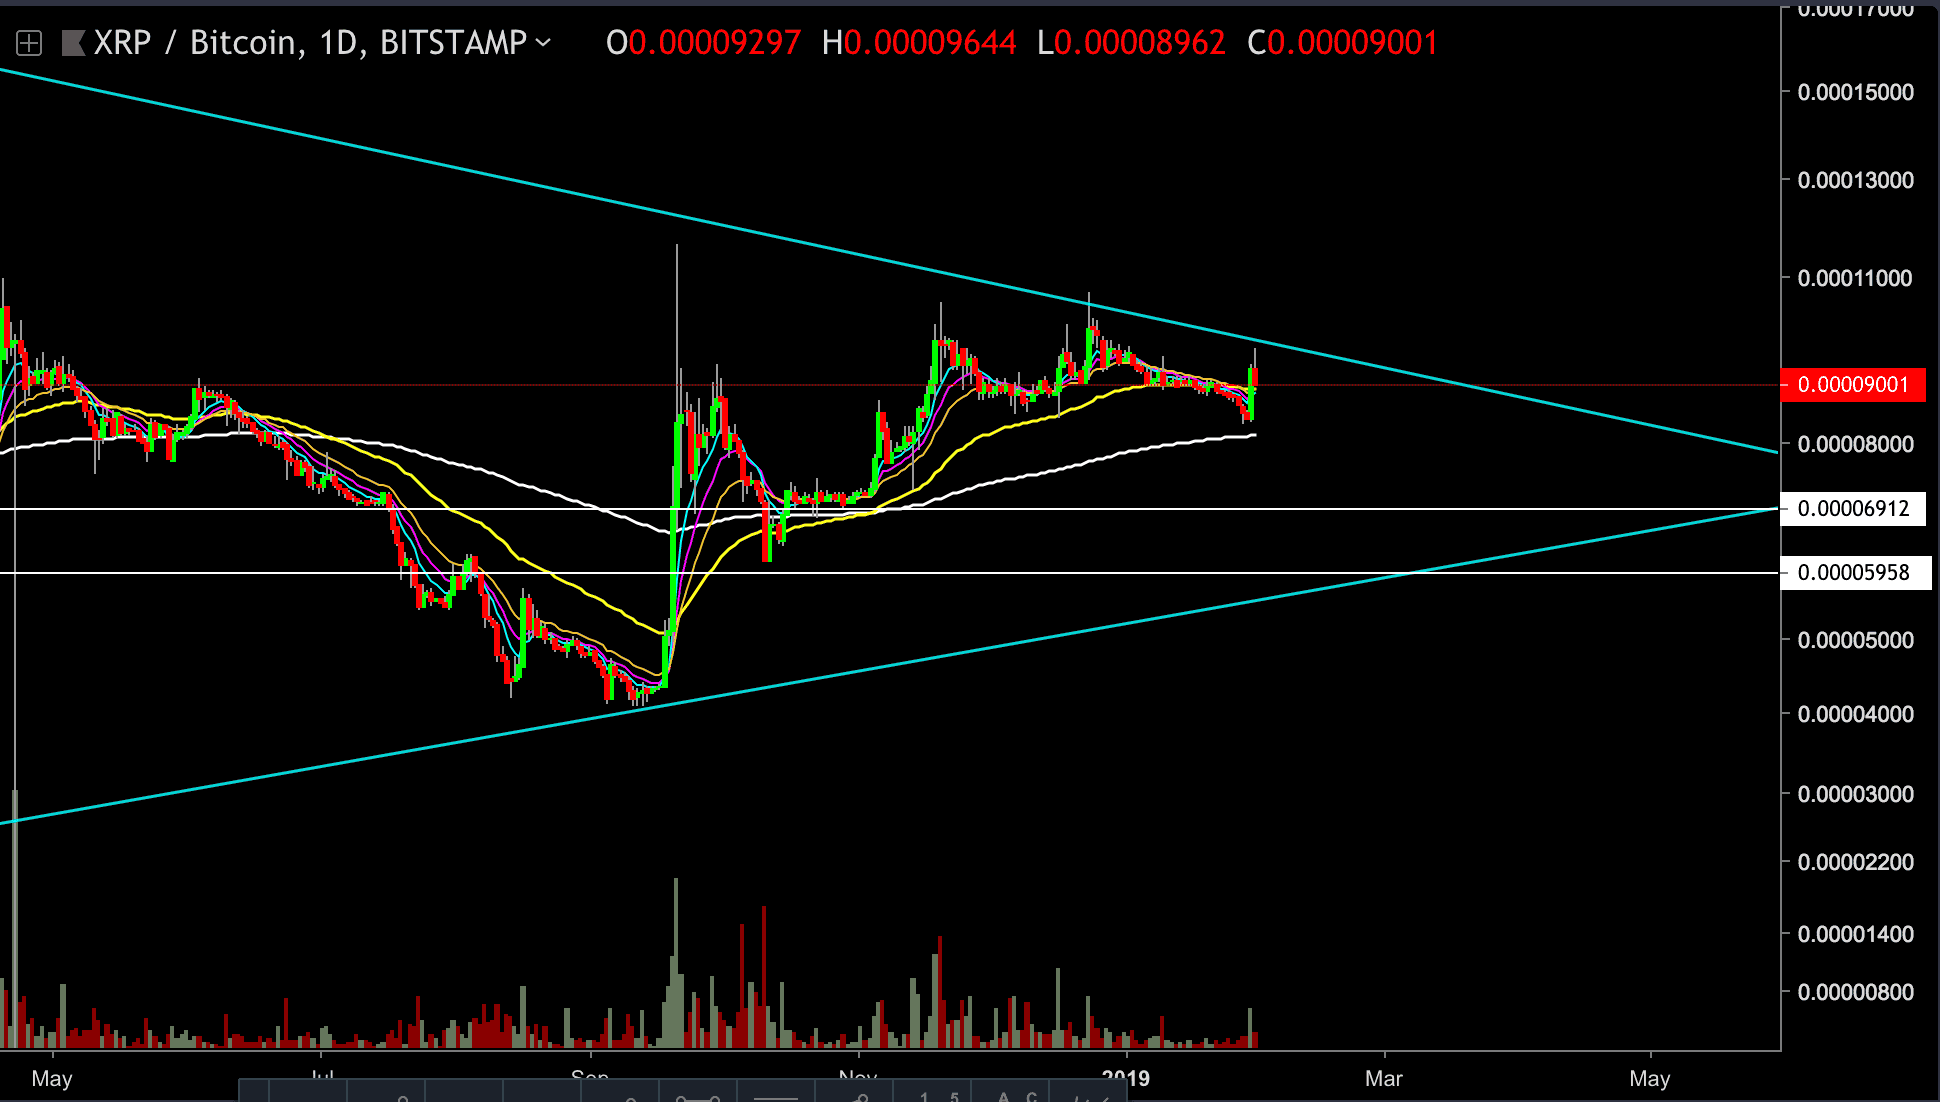
Looking at the XRP-BTC 1- Day chart:
- XRP had approached the top trend-line resistance level of the large triangle formation (marked on the daily chart) and got rejected.
- On the bearish side, XRP could decline toward the 0.00007 BTC support level. From there, might have a bearish continuation of the triangle support trend line.
- On the bullish side, XRP will have to show extra strength to move above the resistance level of the triangle formation: At the moment, the optimistic side could be a retest of this resistance level.
The post Ripple Price Analysis Jan.31: Following 7% Gains – The Daily Chart Reveals a Massive Bearish H&S Formation appeared first on CryptoPotato.