Ripple Price Analysis: Increased Bearish Momentum as XRP Fails to Break Out
After a long consolidation phase, XRP continues to underperform compared to many other altcoins despite ongoing speculation around regulatory clarity. Recent price action shows increasing bearish momentum. Buyers have failed to hold critical levels on both the USDT and BTC pairs, suggesting a cautious outlook for the short term.
Technical Analysis
By ShayanMarkets
The USDT Pair
XRP/USDT is now trading around $2.2 after getting rejected from the higher boundary of the large descending channel. The price has also lost the 100-day MA (orange) and is testing the 200-day MA (blue), both located around the $2.30 mark.
The RSI also sits near 44, reflecting weak bullish momentum and a lack of buying interest. A daily close below the psychological level at $2 would likely open the door for a deeper correction toward the $1.55 demand zone, which also aligns with the lower trendline of the channel.
Until the buyers reclaim the moving averages with strong volume, the trend favours the sellers. Structurally, the market remains neutral to bearish, with a potential shift toward bearish if the current consolidation fails to reverse. Investors should watch for a reaction around the $1.90–$2 area, which will likely dictate the next directional impulse.
The BTC Pair
The XRP/BTC pair is trading around the 2,100 SAT mark after a prolonged grind lower within a descending wedge structure. Once again, the price has lost both the 100-day and 200-day MAs, which have also created a bearish crossover around the 2,500 SAT mark, and is now hovering above the lower channel boundary and the 2,000 SAT demand zone.
There is also a notable FVG (Fair Value Gap) in the 1,600 – 1,900 SAT range, which may act as a magnet and a support zone in case the 2,000 SAT level breaks down.
Buyers will need to reclaim the moving averages and break above the channel’s higher trendline around the 2,500–2,700 SAT zone to regain any strength, which currently seems unlikely unless Bitcoin itself consolidates. As long as the price remains within the channel, short-term relief bounces are possible, but momentum still favours sellers. The broader implication is continued BTC strength or XRP relative weakness in the market cycle.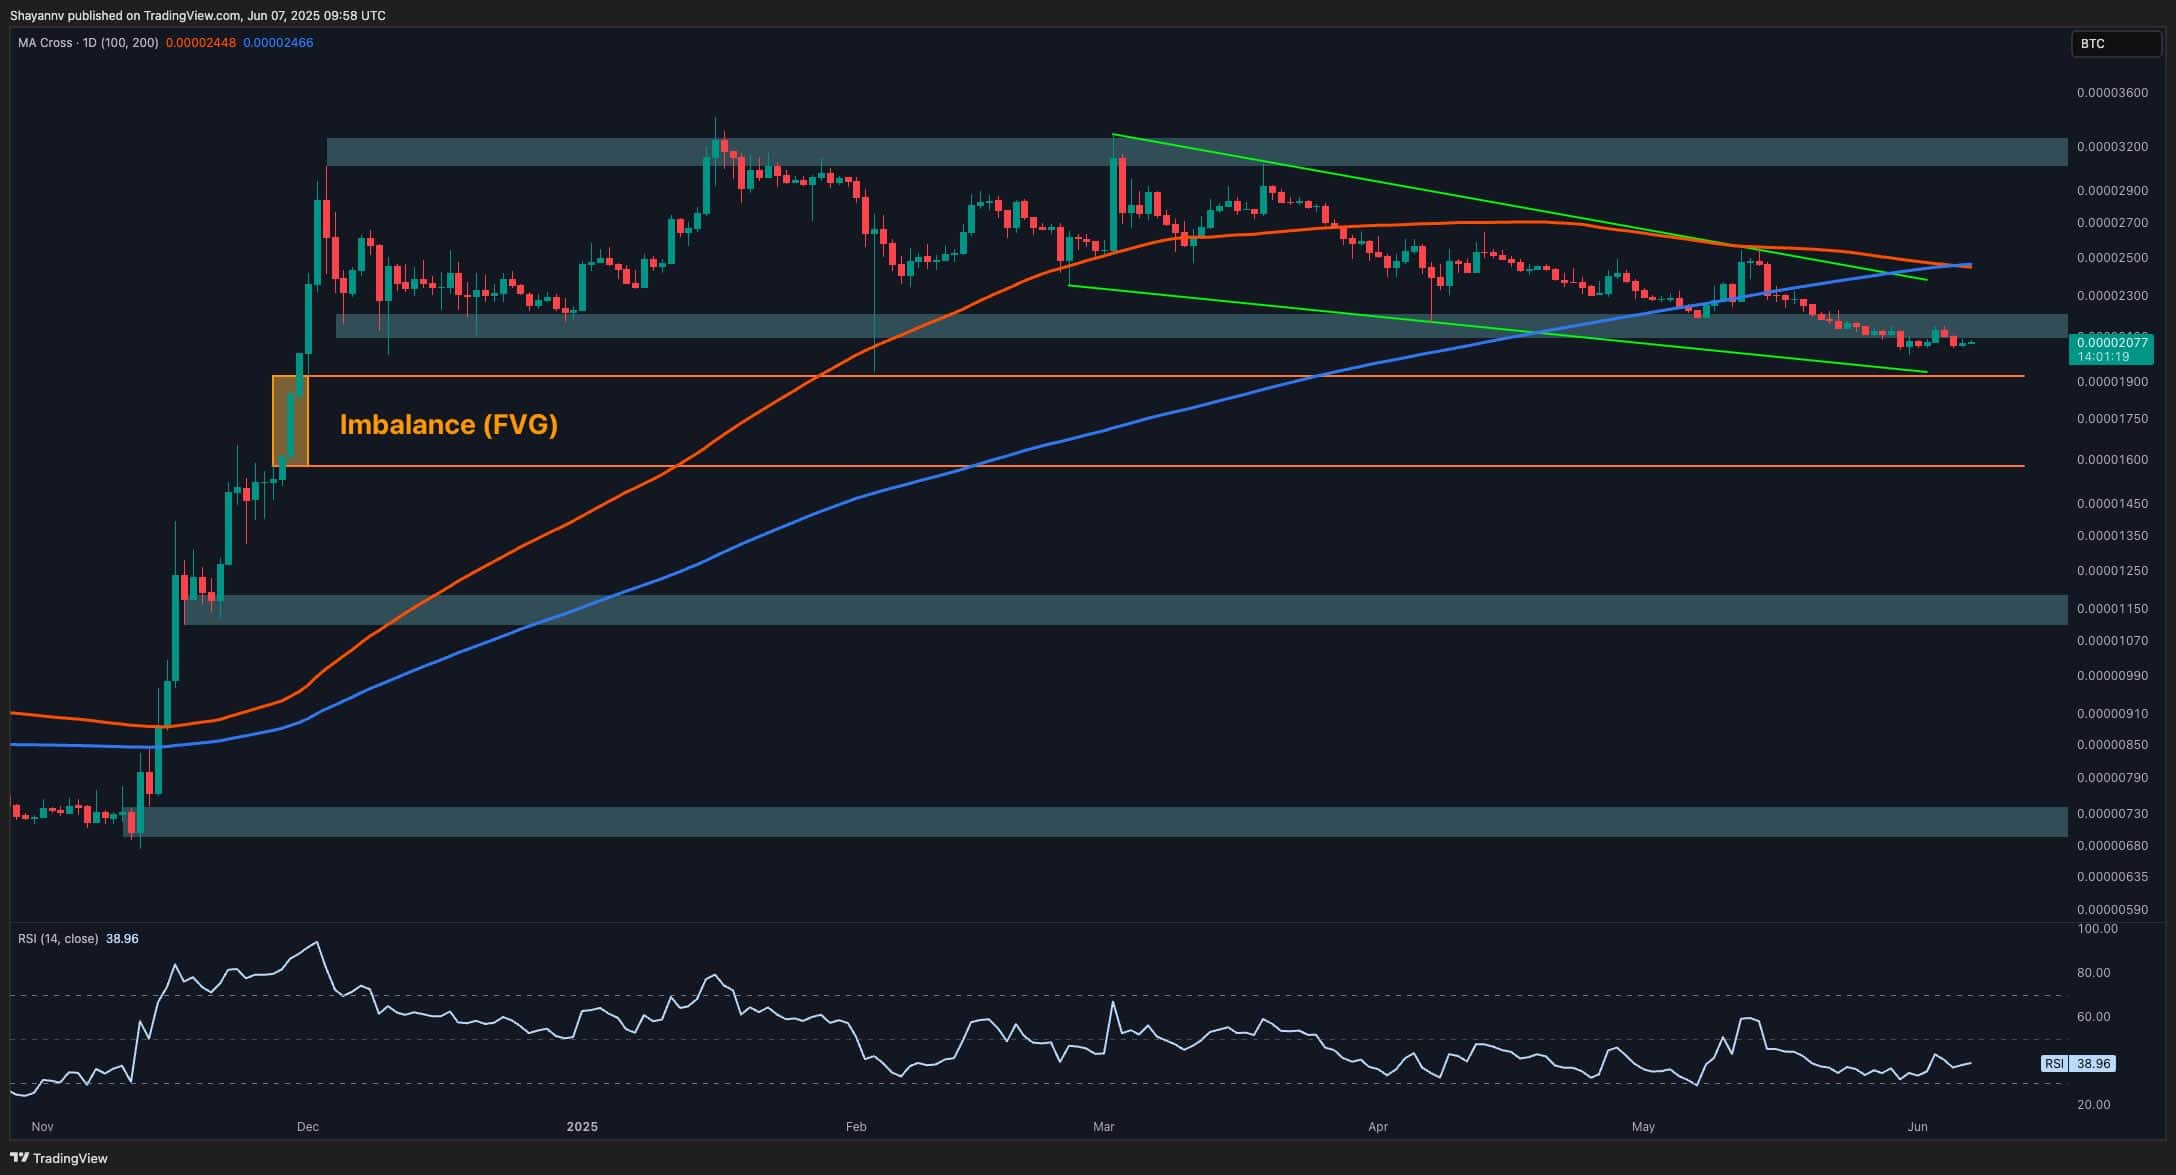
The post Ripple Price Analysis: Increased Bearish Momentum as XRP Fails to Break Out appeared first on CryptoPotato.