Ripple Price Analysis: Can XRP Continue Toward $1 After 35% Weekly Surge?
Ripple’s price is finally moving, as Bitcoin trades at all-time high values. Yet, there’s still a major obstacle the market should take out before a long-term rally begins.
By Edris Derakhshi (TradingRage)
The USDT Paired Chart
On the XRP/USDT pair’s daily chart, the asset has been rallying impulsively over the last few days, following a rebound from the $0.5 level. The 200-day moving average, around the $0.55 mark, has also been broken to the upside.
Yet, the price is struggling to break past the significant $0.7 resistance level. The RSI also shows a massive overbought signal, which could point to a potential correction in the short term. Either way, the market should break above the $0.7 area soon for a bull market to commence in the coming months.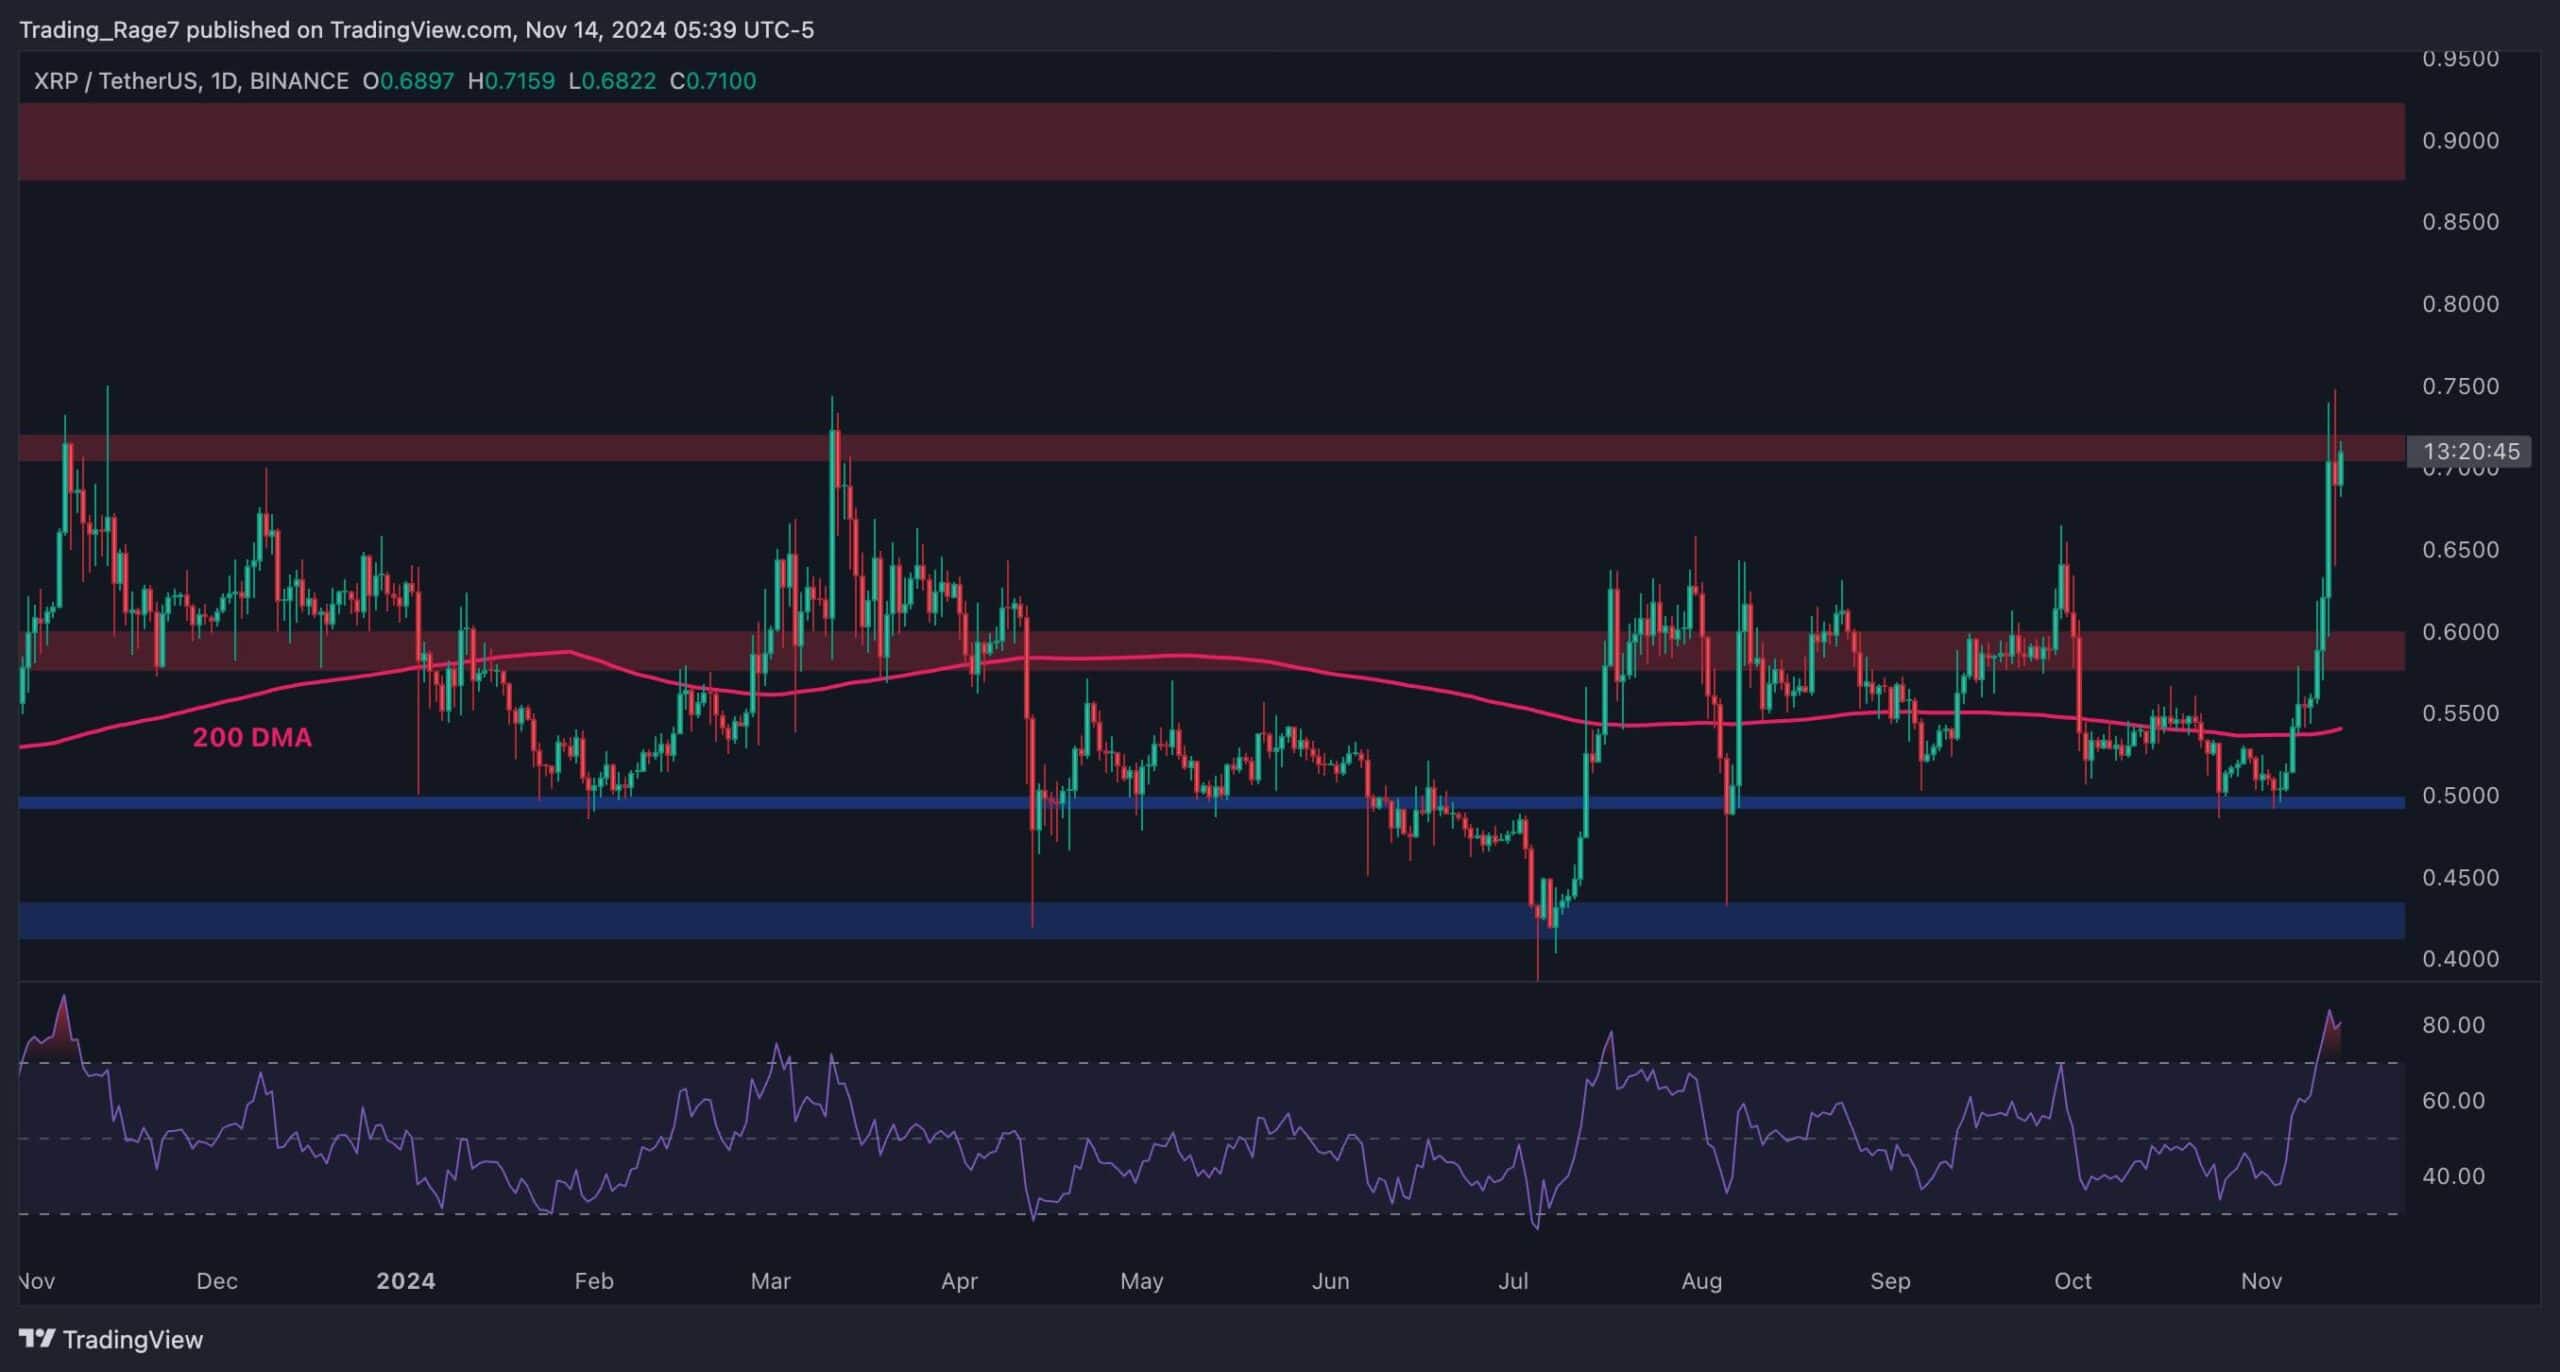
The BTC Paired Chart
As the Bitcoin price has surged rapidly, the XRP/BTC chart is not showing a similar uptrend to the USDT one. Meanwhile, the asset has bounced from the 700 SAT support zone and is currently testing the 200-day moving average, located near the 800 SAT resistance level.
For Ripple to outperform Bitcoin in the coming months, a breakout above the 800 SAT resistance zone and the 200-day moving average is crucial. On the other hand, if the market fails to continue to the upside, a drop back toward the 600 SAT support area and even lower could be expected.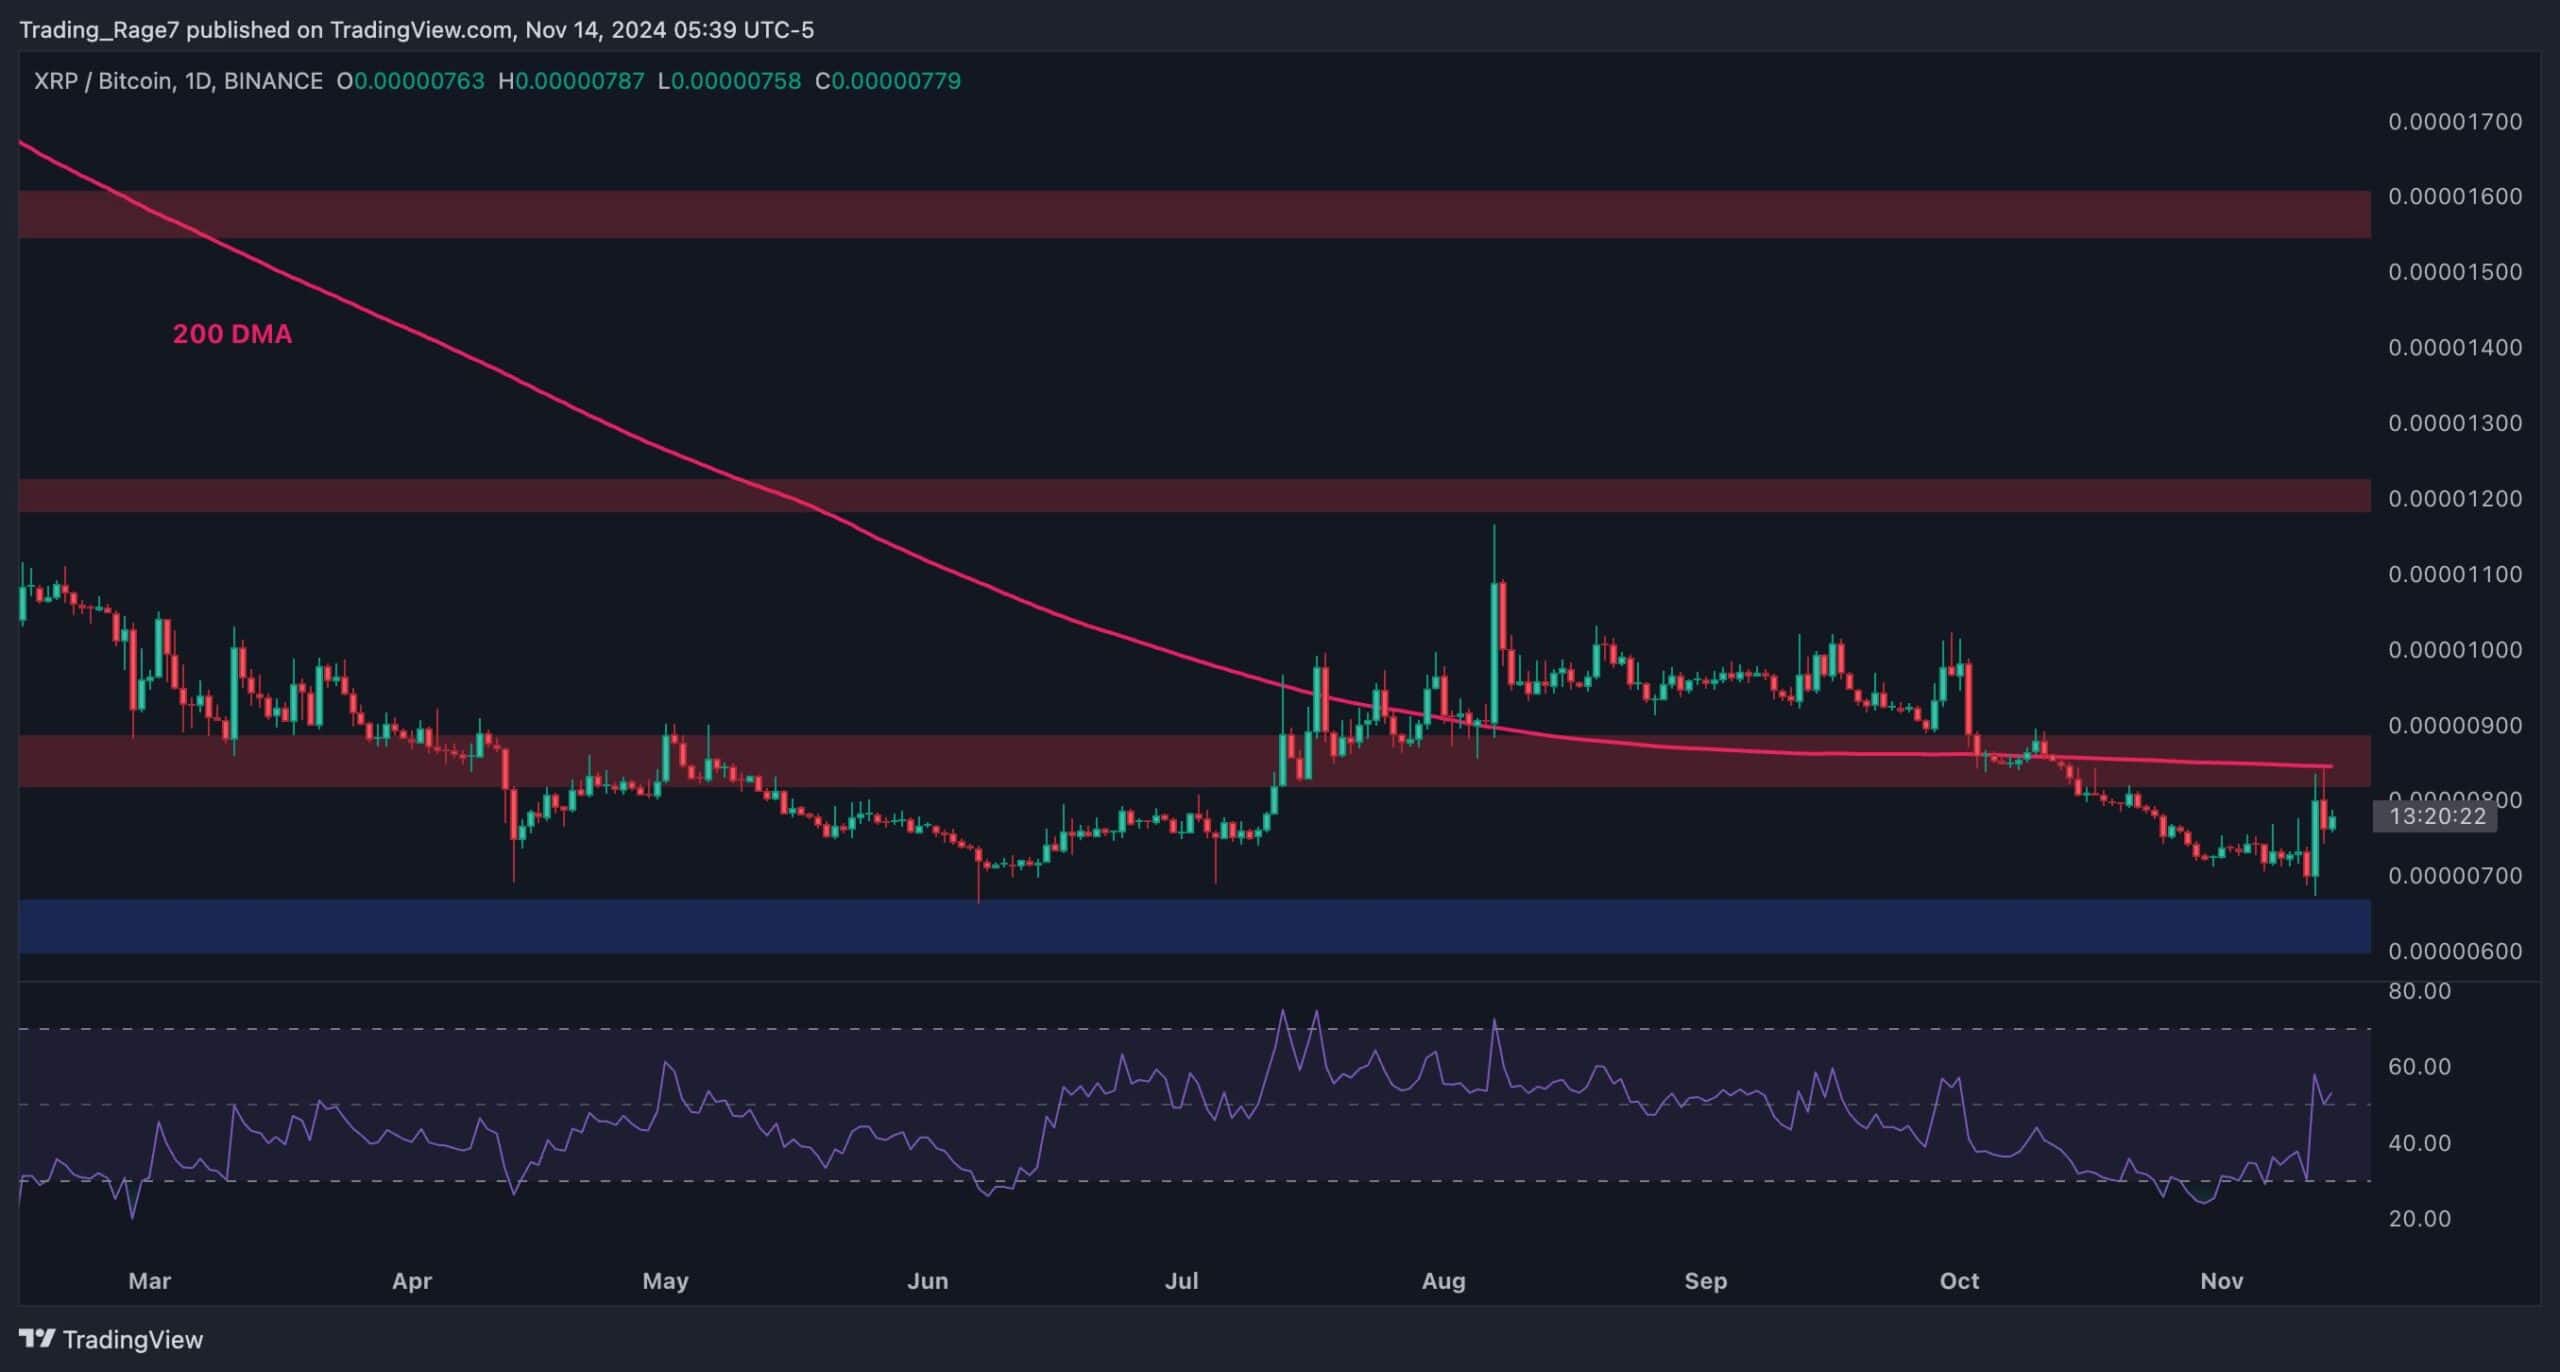
The post Ripple Price Analysis: Can XRP Continue Toward $1 After 35% Weekly Surge? appeared first on CryptoPotato.