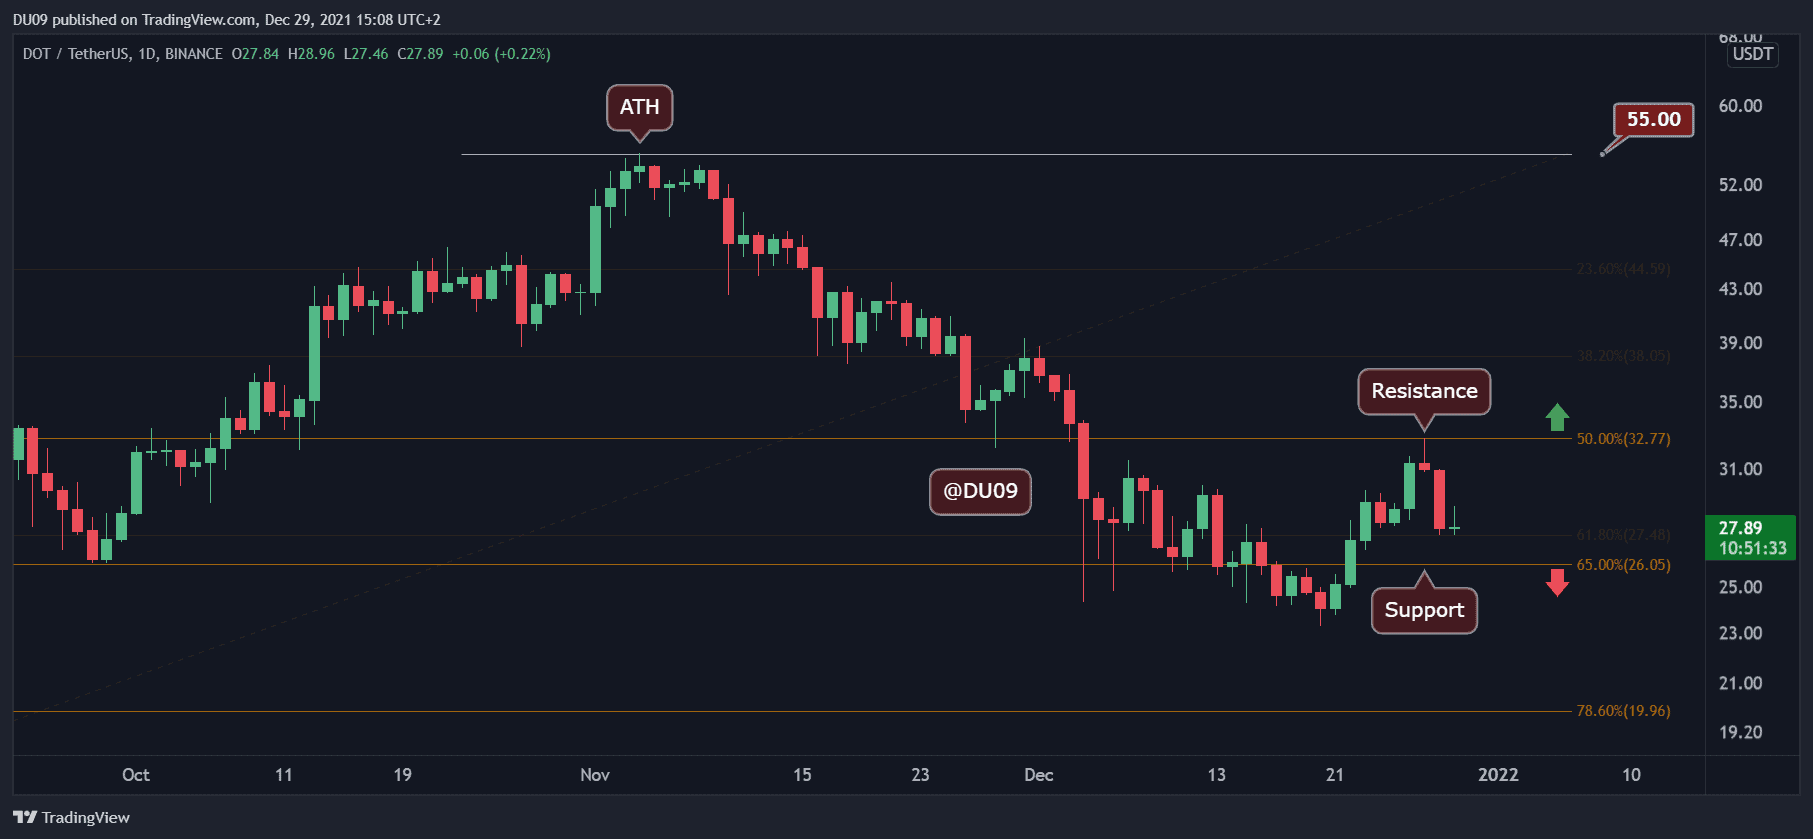
DOT had a fantastic rally last week when the price increased by 40%. However, this week, DOT’s rally ended when the resistance at $33 rejected the price from moving higher. Today, the correction continued, and DOT has fallen under $30. The current support is found at $26.
Chart by TradingView
Technical Indicators
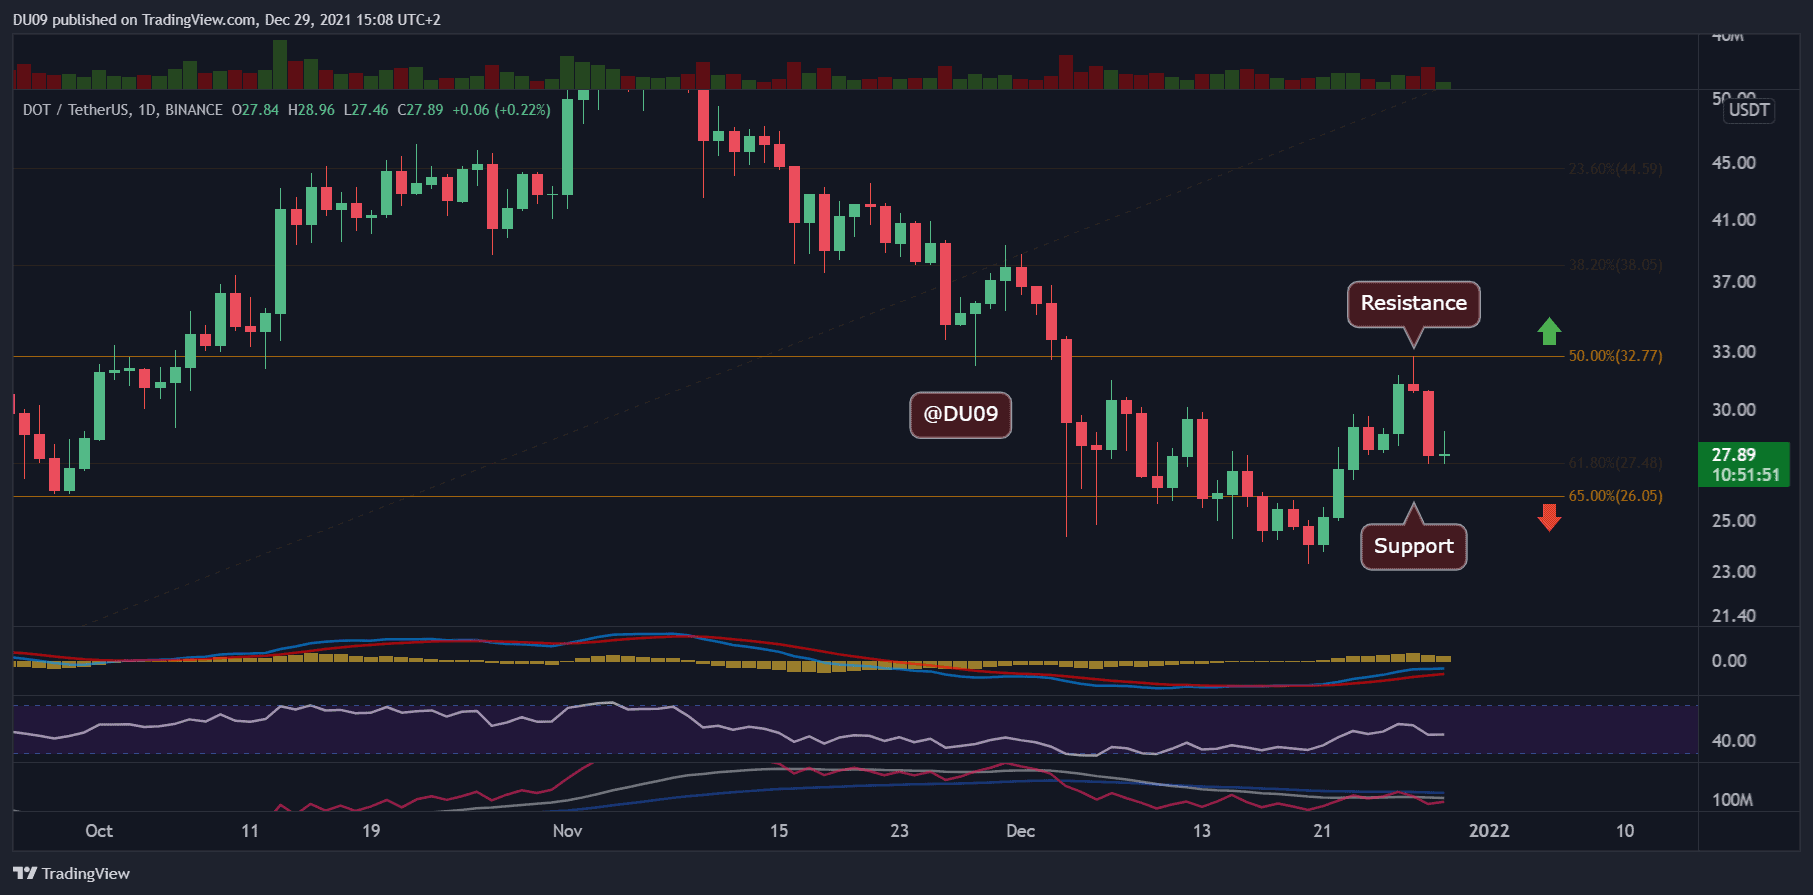
Trading Volume: Sustained volume both during the uptrend and the current downtrend. This shows that market participants have taken quite an interest in DOT recently.
RSI: The daily RSI has made a higher high during the rally, which is a strong bullish signal. However, after the rejection at $33, the RSI is falling. This can quickly change as soon as DOT finds support.
MACD: The daily MACD is bullish, but the histogram is making lower highs after the rejection at $33. This is not concerning as long as the moving averages don’t do a bearish crossover.
Chart by TradingView
Bias
The current DOT bias is neutral.
Short-Term Prediction for DOT Price
DOT had a very nice recovery last week after falling for over 40 days. It is important for the price to return to the uptrend after this correction, as otherwise, the top at $33 could be interpreted as a lower high within a larger bearish trend.
[PRESS RELEASE – Please Read Disclaimer] The newest token available on Cryptal Exchange is Chainlink (LINK). As of today, you can now buy, sell, and trade LINK for USD or BTC. Chainlink was founded and developed by Sergey Nazarov and Steve Ellis. Its ICO was held in September 2017, raising $32 million. There is a…
The cryptocurrency community has been particularly creative when it comes to finding new ways to bootstrap projects and raise funds. In late 2017 and 2018, we saw the appearance of initial coin offerings (ICOs), where teams would raise money by selling a part of their total token supply to the public. This created an absolute…
China may have banned cryptocurrencies on its territory, but blockchain technology remains a key priority area for the government. Its global ambitions in this space are just taking off with BSN Spartan Network, which is advertised to be open-source and free from the Chinese government’s snooping. BSN’s Spartan Network Blockchain-based Service Network (BSN), a project…
Grayscale Investments has removed XRP from its diversified public crypto fund — Grayscale Digital Large Cap Fund (DLC). The move could be yet another fallout from the current enforcement action by the U.S. Securities and Exchange Commission (SEC) against Ripple. Grayscale Nixes XRP, Reallocates Liquidated Position According to an announcement, Grayscale revealed that it removed…
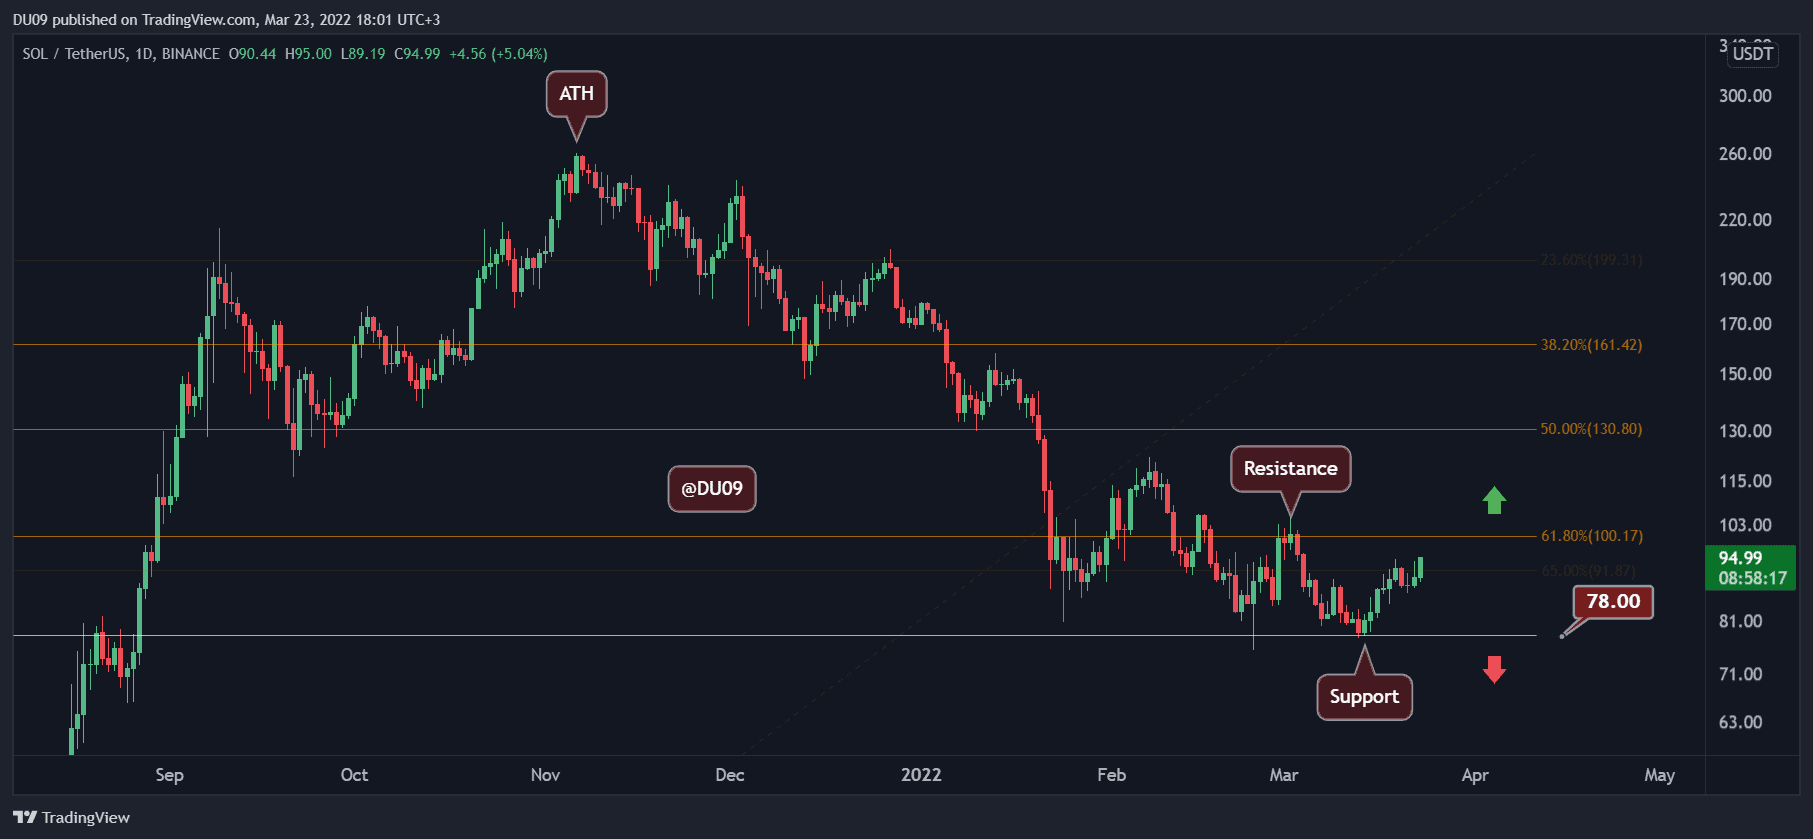
Key Support levels: $78, $56 Key Resistance level: $100, $130 In the past week, SOL has managed to find good support on the $78 level, from where price has now moved on the offensive towards the key resistance at $100. So far, buyers faced little resistance, but their resilience is about to be tested. Chart…
Bear markets always appear to be long, drawn-out affairs, but the steep downtrend only really lasts a year or so. The crypto industry hit its all-time high of just over $3 trillion in market capitalization in November 2021. Almost a year to the day later, on Nov. 22, they hit a cycle low of $820…
TL;DR Ripple’s legal battle with the SEC over XRP’s classification is set for trial on April 23, following the company’s three partial wins in 2023. The lawsuit’s outcome could significantly affect XRP’s value, but a final decision might be delayed until 2026 due to potential appeals. Ripple and the United States Securities and Exchange Commission
According to an analysis from CoinGecko, the period from 2020 to 2023 has witnessed a surge in crypto airdrops. Led by giants like Uniswap, Apecoin, and dYdX, the top 50 airdrops have distributed $26.6 billion in tokens in that period. Uniswap’s Historic $6.43 Billion Airdrop Uniswap (UNI) led the pack, which made headlines with its
The condition of the global economy seems to be in a state of knockdown. The years of financial boom after the crisis in 2008 ended with the outbreak of the COVID-19 pandemic at the beginning of 2020. Social distancing measures and “stay-at-home” rules crippled production to a serious extent, while numerous central banks took the…