Several altcoins have surrendered their recent gains this week amid rising geopolitical tensions, with Polkadot (DOT) facing similar challenges. The latest market correction pulled the altcoin’s price down to $4.04, a drop of over 14% in just three days.
At times like this, it’s important to take a step back and examine some fundamentals and traders’ sentiment in the face of popular industry analysts’ conclusions.
Polkadot On-Chain
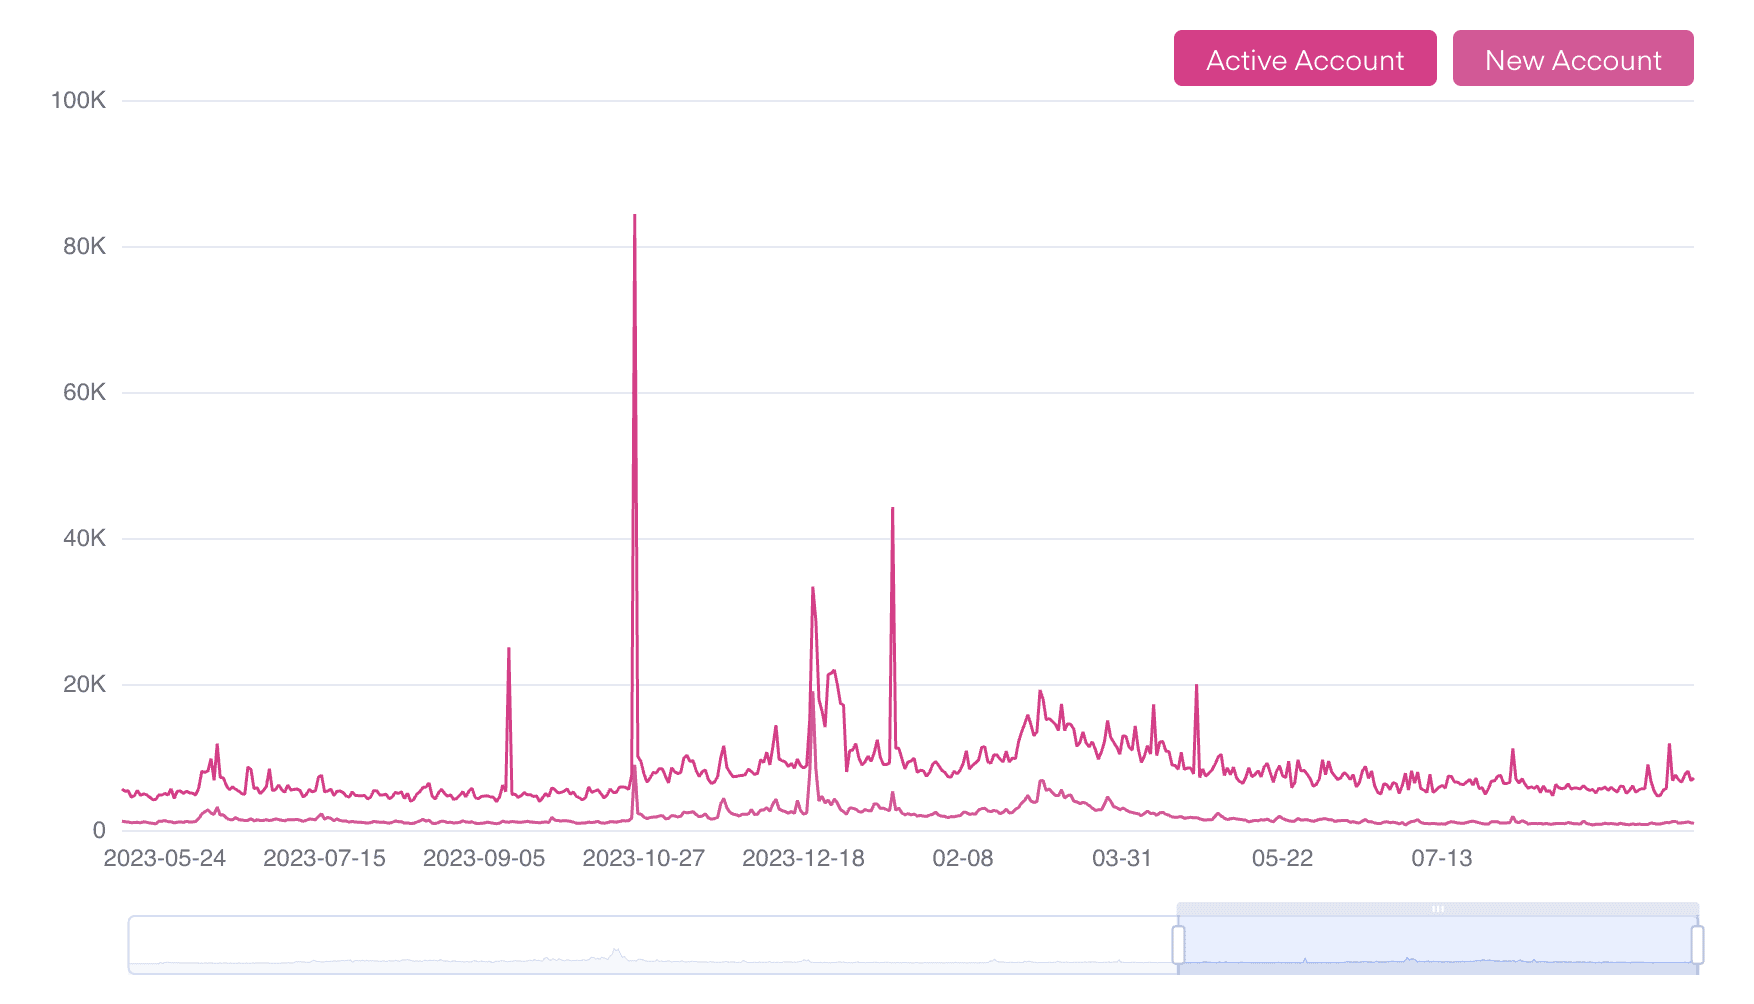
One of the most important on-chain metrics that track the network’s activity over time is the number of daily active users and new users joining the ecosystem.
While the number of new accounts on Polkadot has remained relatively the same since May last year, the number of active users has increased by more than 25%.
Source: Subscan
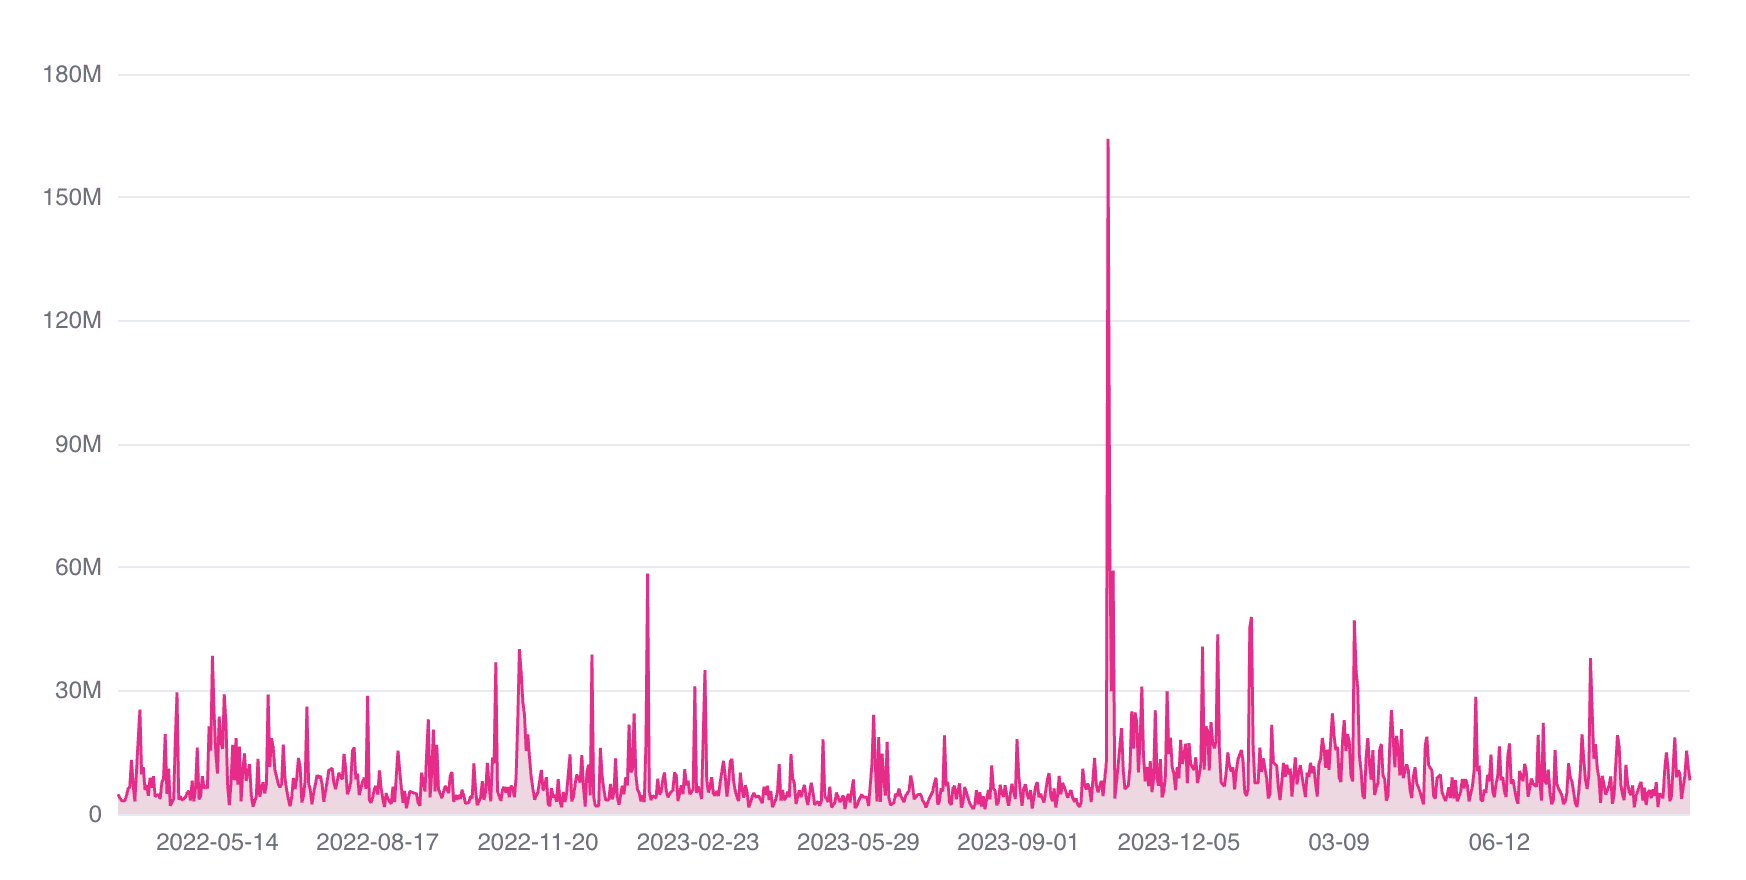
The amount of DOT transferred daily has also increased significantly during this period, showing that the network is processing larger transfer volumes.
Source: Subscan
DOT’s Imminent Breakout – Are Investors Ready?
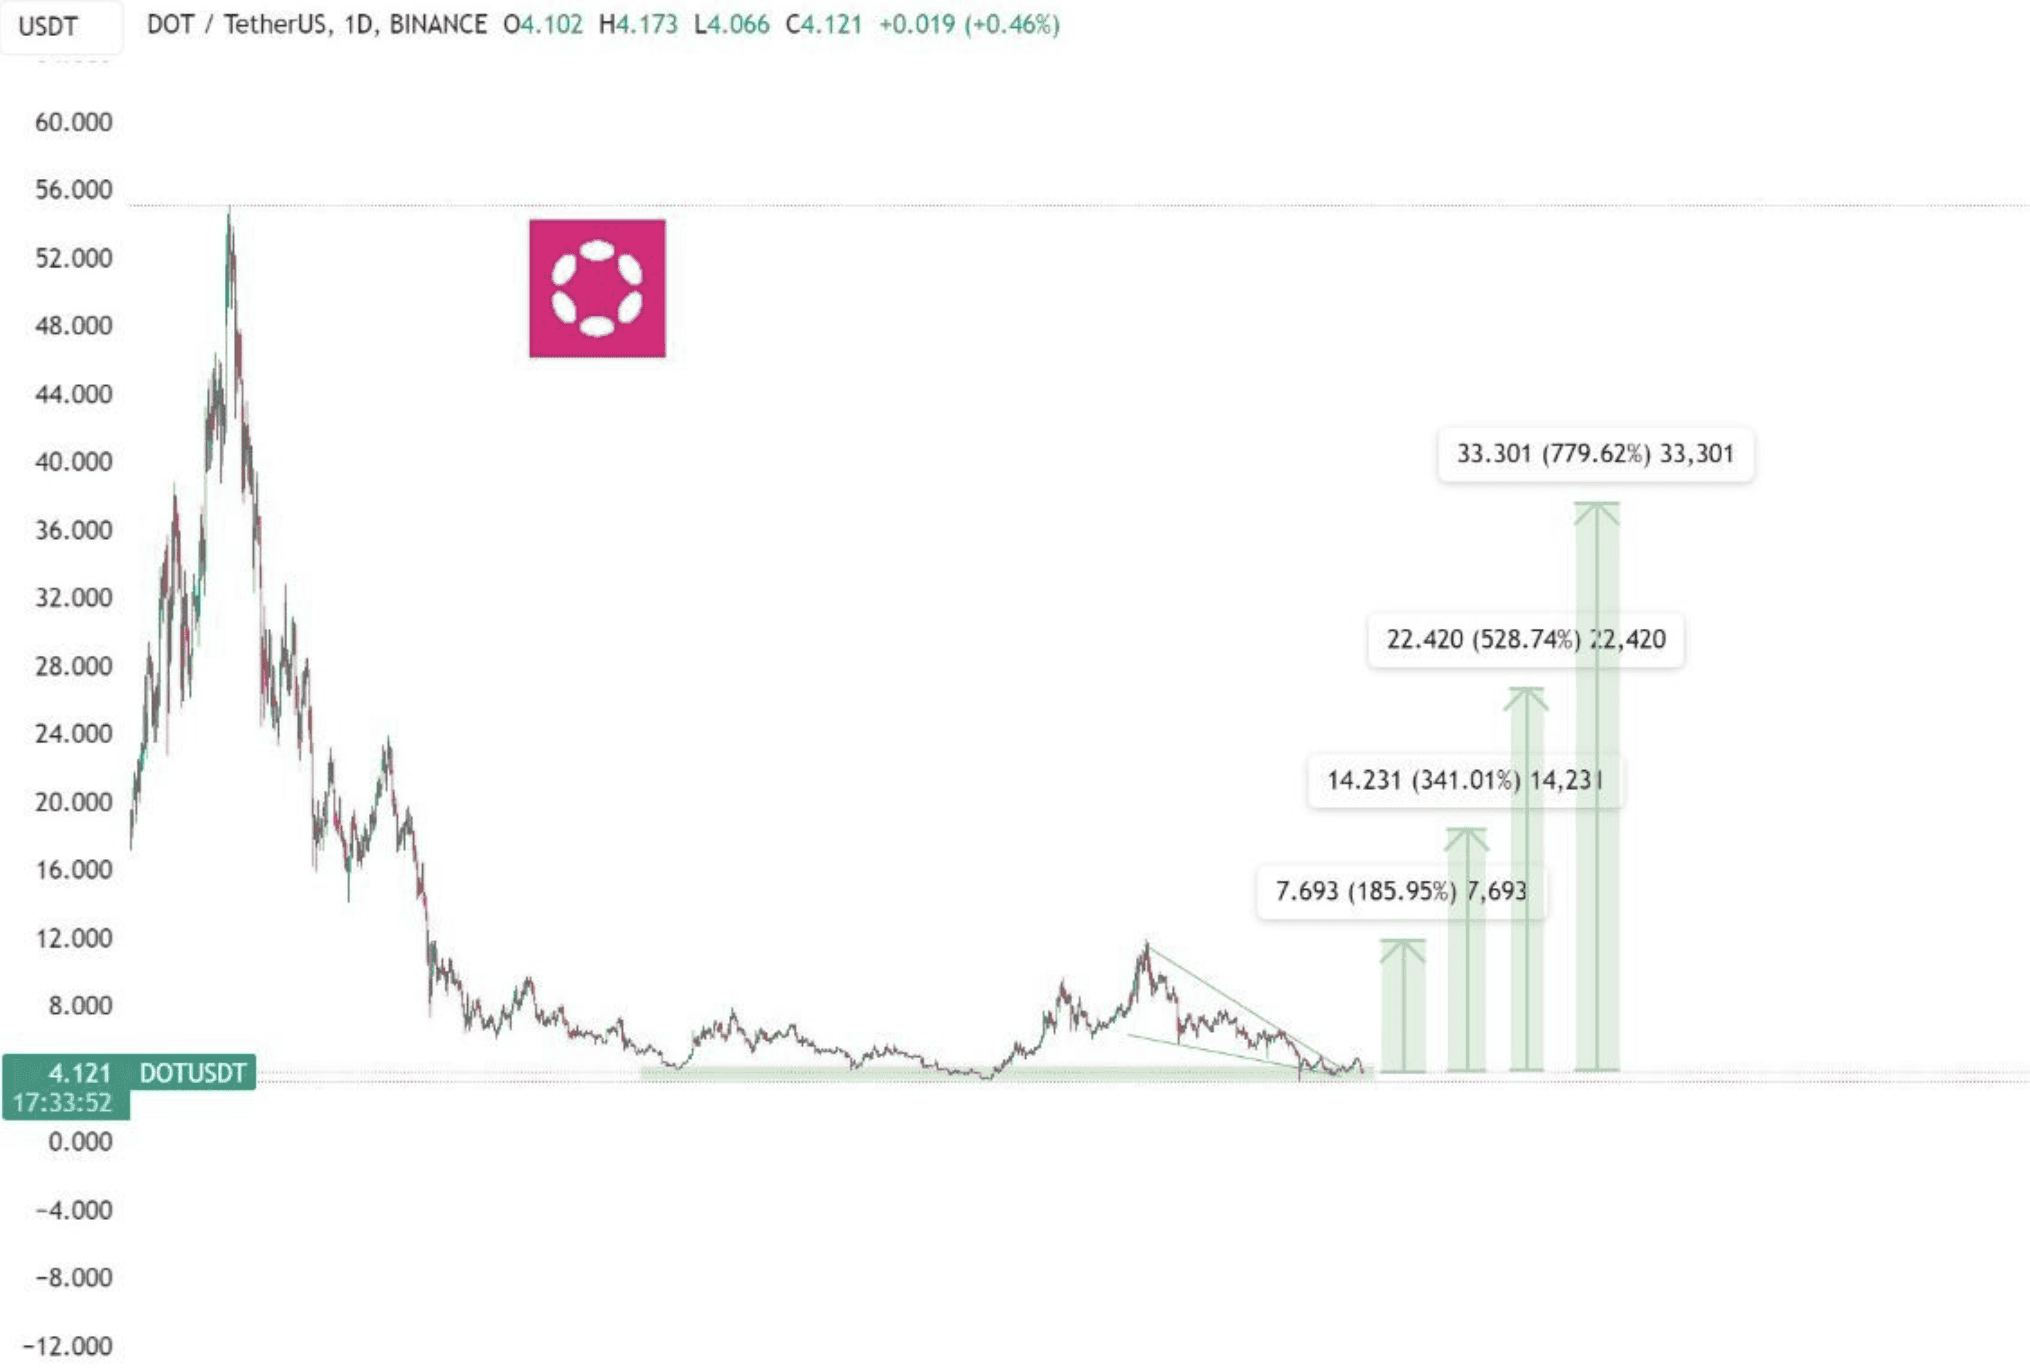
One analysis indicates that DOT is poised for a significant breakout. The altcoin appears to be approaching the conclusion of its accumulation phase and could potentially be on the verge of breaking out of a long-standing falling wedge pattern.
According to its findings, recent movements in major large-caps suggest that DOT is poised to follow this trend, making it only a matter of time before it experiences a substantial upward shift. The projected targets for this breakout, indicating key resistance levels, are set at $11.83, $18.41, $26.30, and $37.53.
“With over 600 days below the key zone, Polkadot is gearing up for a major push.”
Source: X
Another market observer, Lucky, also highlighted a similar promising outlook for DOT in his latest technical analysis. He said that the asset is nearing the end of its yearly accumulation phase, which could propel DOT’s price to “take off” soon.
An Outrageous Scenario Based on Historic Similarities
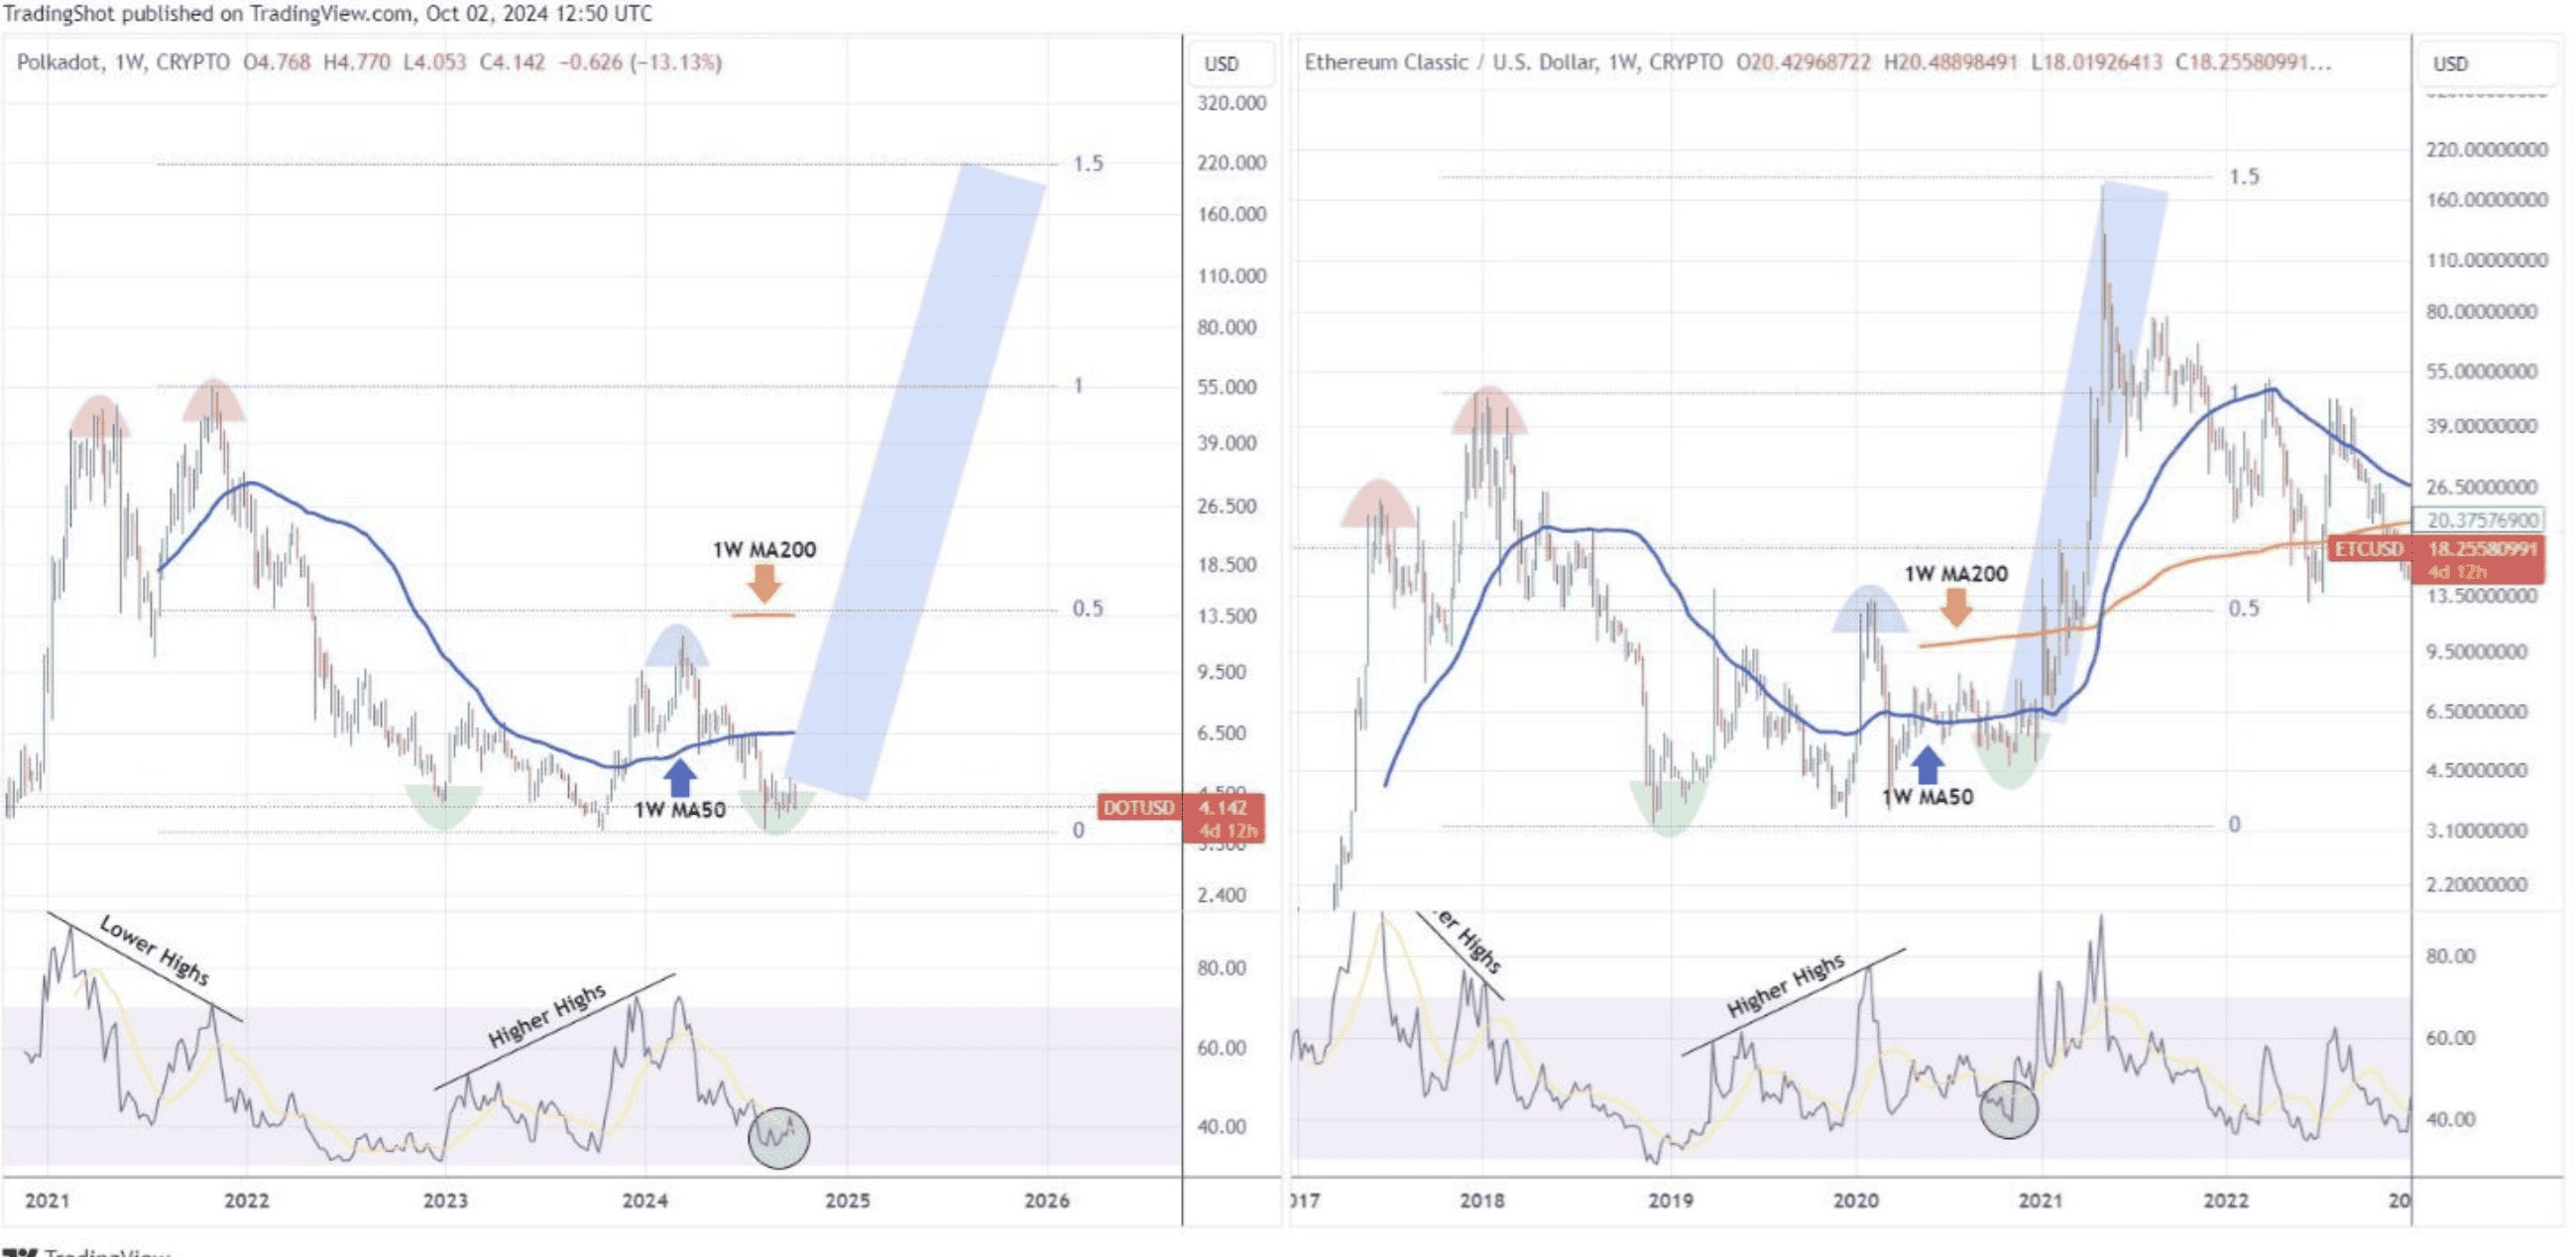
According to investment firm TradingShot’s latest analysis, DOT may be on track for a significant price surge, potentially reaching $200 by the end of 2025. The analysis suggests that Polkadot is following a pattern similar to Ethereum Classic’s (ETC) 2018-2021 cycle.
As shown on a one-week chart, both assets exhibit nearly identical RSI sequences. Lower highs and double tops lead into a bear market, followed by an RSI bottom that sparks a breakout above the one-week MA50 and the 0.5 Fibonacci retracement level.
Source: X
Currently, Polkadot’s RSI is hovering around 40.00, a key level that marked the start of a parabolic rally in Ethereum Classic. If Polkadot mirrors this cycle, it could aggressively rise toward the 1.5 Fibonacci extension, hitting $200 by late 2025.
The post Polkadot in the Charts: What do On-Chain Data and Technical Analysis Indicate for DOT’s Price? appeared first on CryptoPotato.
Stacks CEO Muneeb Ali spoke at Consensus 2023 on Friday about Bitcoin’s potential as a settlement layer, and the revival of developer culture within the community. Ali noted how a small, specific change to Bitcoin’s base layer could unlock a vast array of applications that can be built via layer 2 technology. According to the…
Following a bullish rebound over the past few days, Bitcoin has once again reached the critical resistance zone of $45K. The good news is that the price has broken above the 100-day moving average line, followed by a bullish rally compiled of five green daily candles. The Daily Chart Technical Analysis By Shayan The BTC…
Most retail investors are still very much interested in investing in digital assets despite experiencing what is arguably the worst bear market in crypto history. According to a recent survey report by the social trading platform eToro, more than two-thirds, approximately 69%, of retail investors revealed that they are positive or have mixed feelings about…
PEPE has dipped by 0.3% in the past 24 hours, with the meme token slipping back down to $0.00001732 as the crypto market gains by 1% today. This fall means that PEPE is now down by 6% in a week and by 26% in a month, although the Ethereum-based coin retains an impressive 1,300% increase
[PRESS RELEASE – Please Read Disclaimer] Interview with the Indian Sportsperson Priyanka Goswami: Thanks to AppleB, I Am at #Tokyo2020 She is a sportsperson that has already qualified for the Tokyo Olympics. However, her road to Tokyo could have been impossible. She is Priyanka Goswami from India. She has been attracted to running since high…
Bitcoin’s price has yet to hit the $100K milestone, but considering the market’s current state, it seems only a matter of time. Bitcoin Price Analysis By Edris Derakhshi (TradingRage) The Daily Chart The daily chart demonstrates a clear picture of the last 9 months of Bitcoin’s price action, where the market has been consolidating until
[PRESS RELEASE – Ljubljana, Slovenia, March 2nd, 2024] Blocksquare, a pioneering force in real estate tokenization, has confirmed that its native Blocksquare Token (BST) will be available for trading on leading cryptocurrency exchange Gate.io from March 4. The news marks a major milestone in Blocksquare’s journey to transform the property investment landscape, enabling investors to
For the third week in a row, digital asset investment products have seen investors pull out funds. This past week alone marked a historic $2.9 billion in outflows which pushed the cumulative figure to $3.8 billion over three weeks. CoinShares stated that this reversal is likely influenced by the recent security incident at Bybit, hawkish
Key metrics on Ethereum are painting a bullish outlook for the network’s native cryptocurrency, ether (ETH), despite its sluggish momentum over the past weeks. The asset has struggled to match bitcoin’s (BTC) momentum following the conclusion of the United States presidential election, but on-chain metrics indicate a bullish trend in the near term. According to