PEPE Crashes 70% From ATH, How Low Can it Go? (PEPE Price Analysis)
With the bubble burst, PEPE is in a desperate search of support.
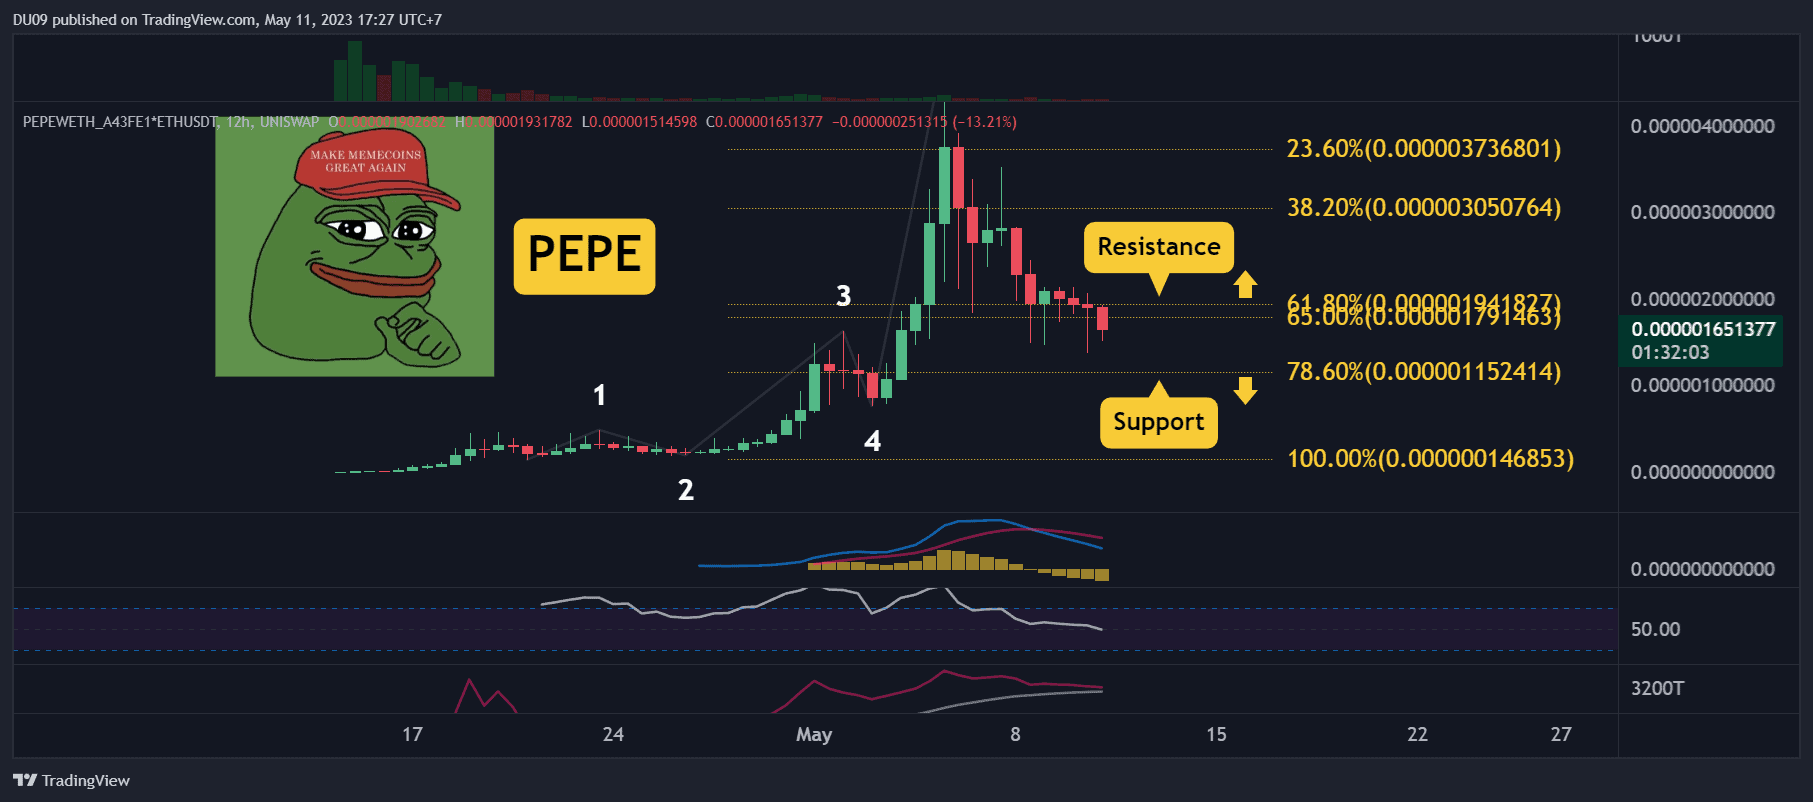
Key Support levels: $0.0000011
Key Resistance levels: $0.0000020
PEPE’s rally quickly came to an end after it passed the $1 billion market capitalization. Bubbles require exponentially more money to continue inflating, and in the case of this meme coin, the money ran out in early May. Since then, the price has crashed by 70%.
PEPE’s next key level of support is found at $0.0000011, where buyers could become interested again. The current resistance is at $0.0000020.

Trading Volume: In the past few days, sellers have dominated across the board. The volume and the price both closed in the red in the past three days.
RSI: The daily RSI fell under 50 points, and there is no sign of a reversal yet. This is bearish.
MACD: The daily MACD did a bearish cross on Monday, and since then, the price continued to make lower lows.
Bias
The bias for PEPE is bearish.
Short-Term Prediction for PEPE Price
It is important to see how the price will react if it reaches the key support level. If buyers become interested, PEPE could bounce off that level to test the key resistance at $0.0000020.
The post PEPE Crashes 70% From ATH, How Low Can it Go? (PEPE Price Analysis) appeared first on CryptoPotato.