Luna Price Analysis: LUNA Surges 15% in a Day but Can Bulls Keep Going?
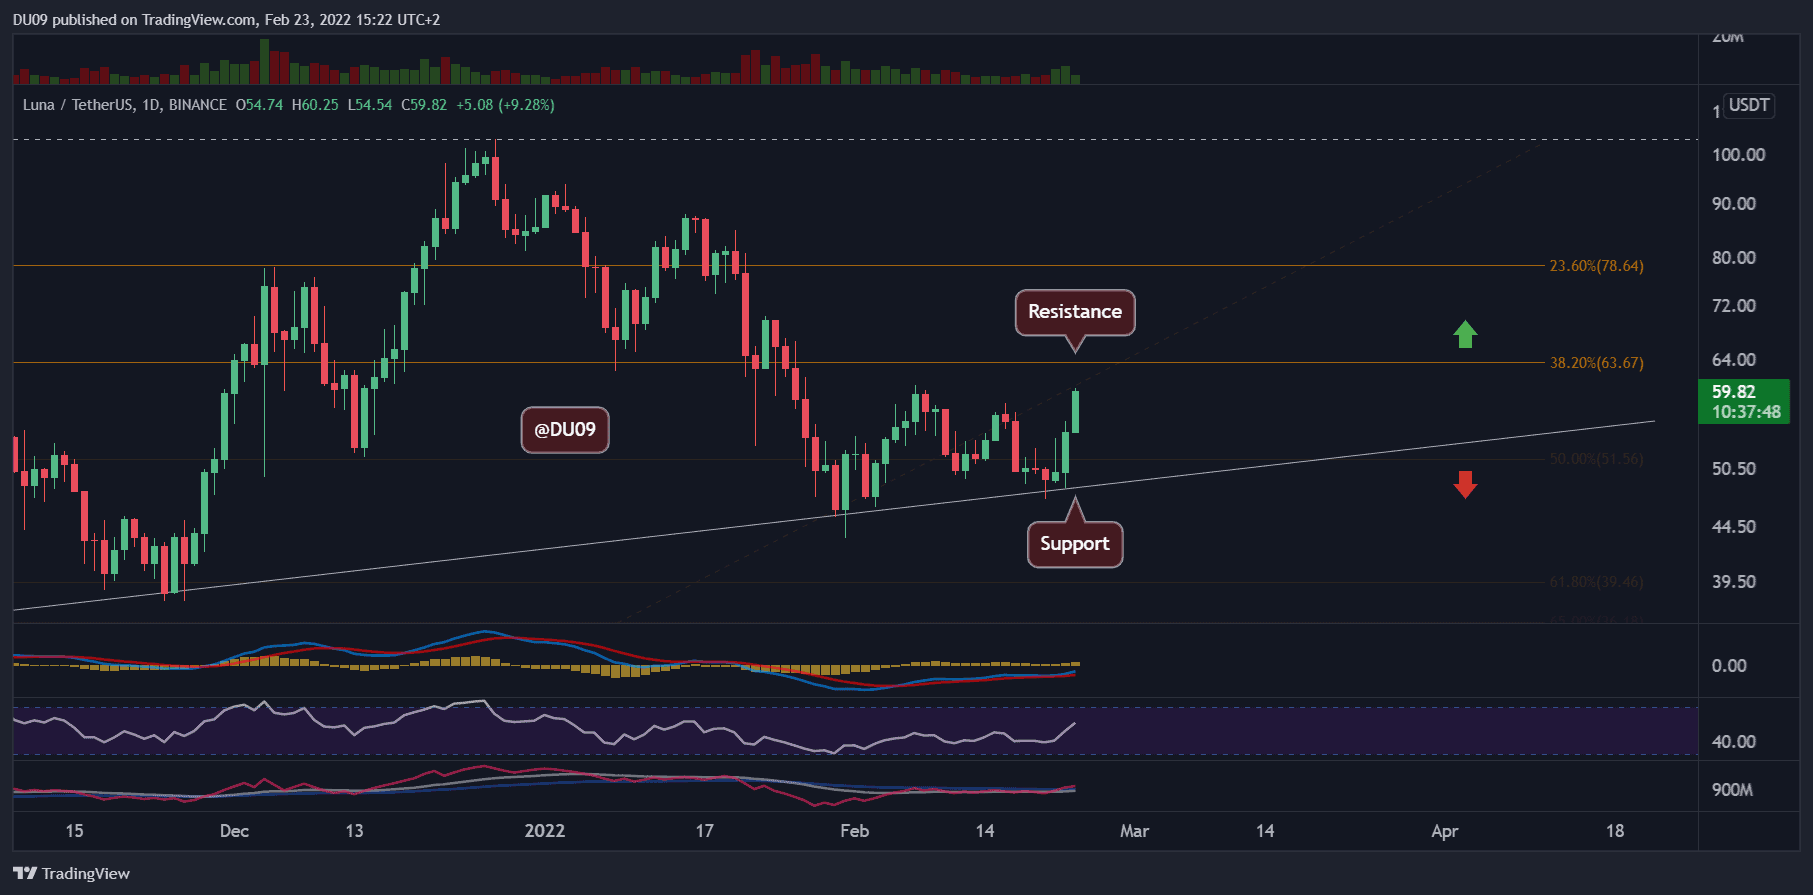
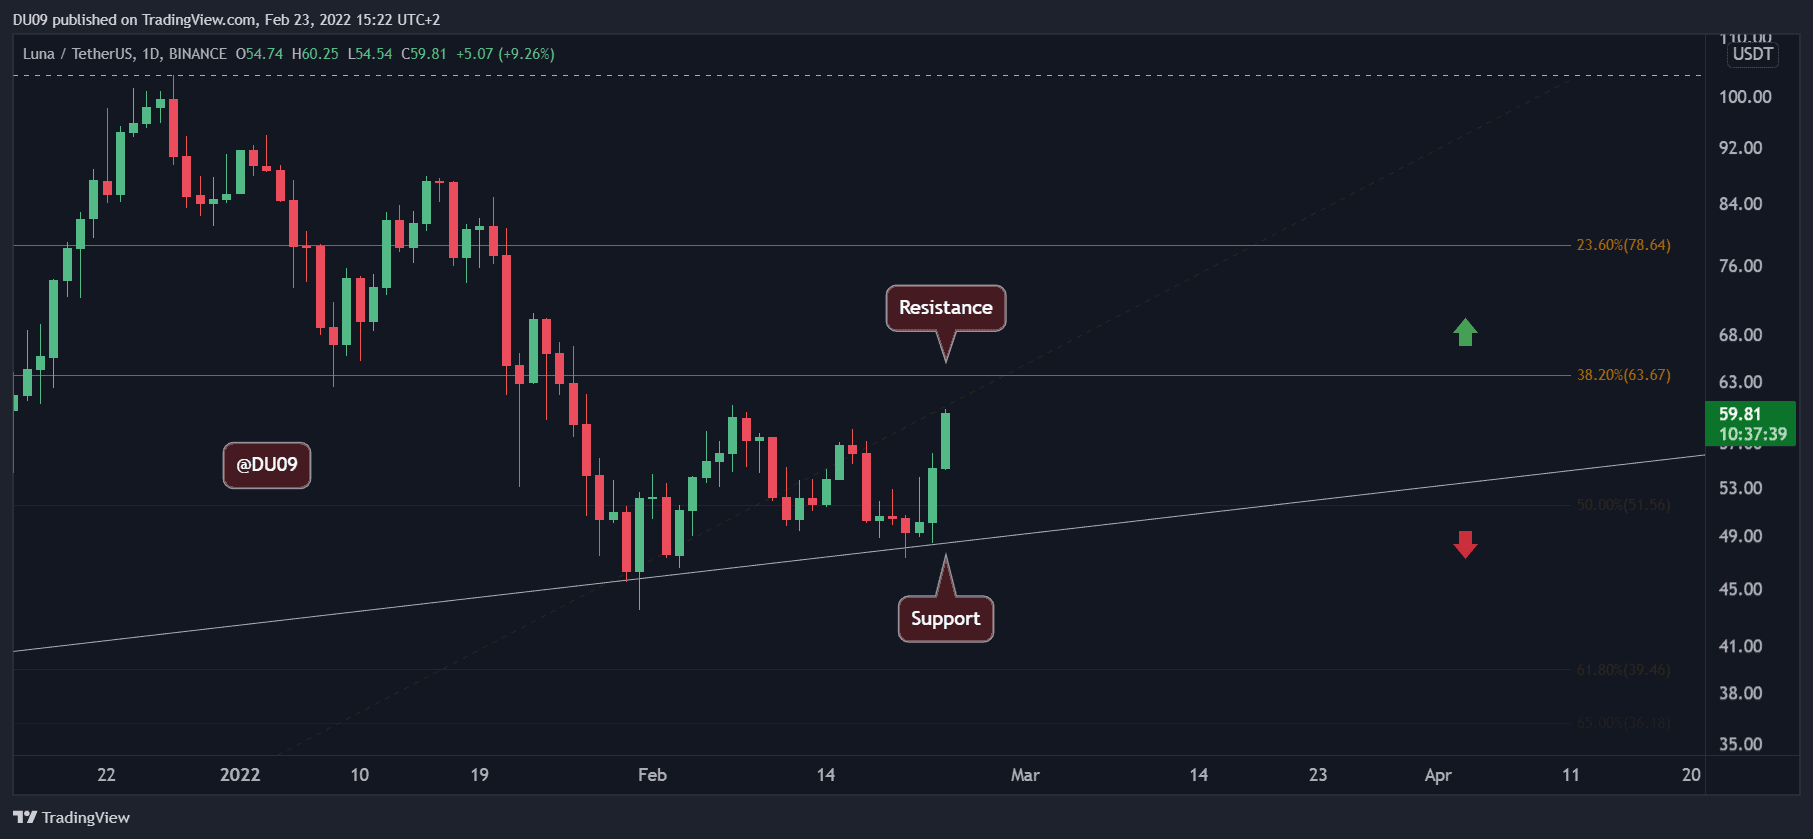
Key Support level: $48
Key Resistance level: $64, $79
The positive market sentiment is well reflected by Luna’s price, which rallied after touching the key support at $48. The cryptocurrency has skyrocketed towards $60 and does not look ready to stop until the key resistance at $64. If Luna is able to move above that level, then the next resistance is found at $79.
Technical Indicators
Trading Volume: The buying volume in the past two days was good, and this supports the price increase. This is bullish.
RSI: The RSI is above 50 points and moves higher. It also managed to make a higher high which is another bullish indicator.
MACD: The daily MACD has turned around after some hesitation, as shown by the histogram. Momentum on the buy-side appears to intensify. Let’s see how price reacts at the key resistance.
Bias
The bias on Luna is bullish in the short term.
Short-Term Prediction for Luna Price
While this price action brings optimism, there are two key resistance levels that, if not broken, may lead to a lower high on the macro picture. Therefore, Luna needs to move above $64 and $79 to remain bullish. Otherwise, the price may resume its downtrend after making a lower high.