Luna Price Analysis: Bulls Got Rejected at $78 ATH, Is a Correction Coming?
Key Support levels: $55, $64,
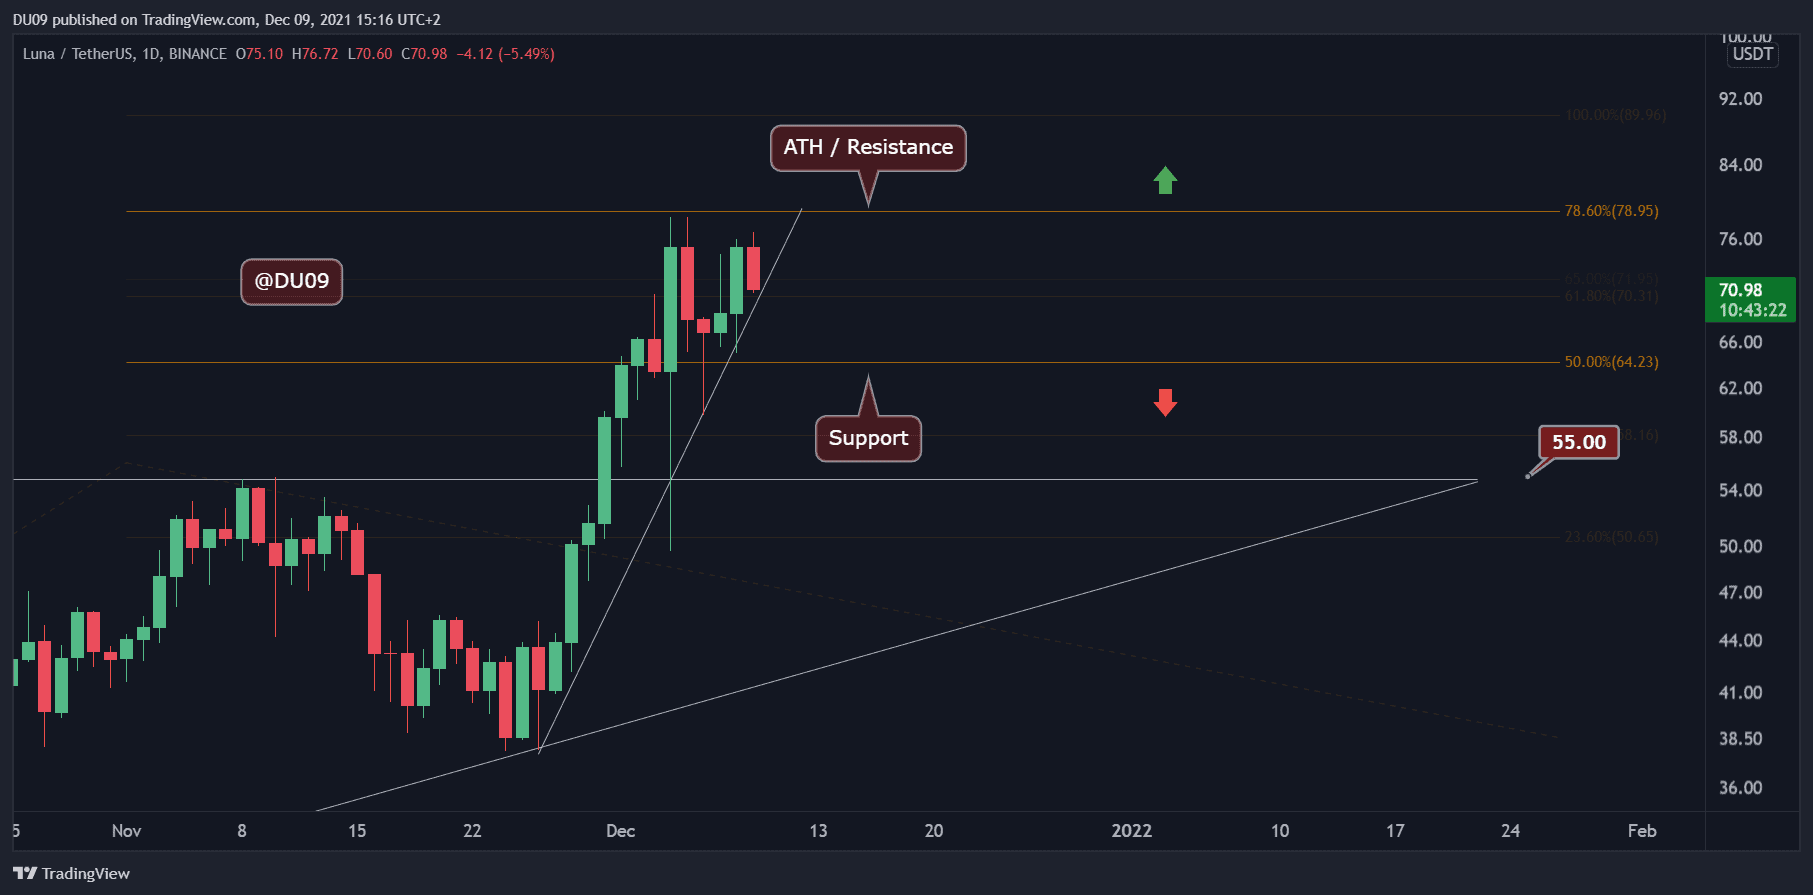
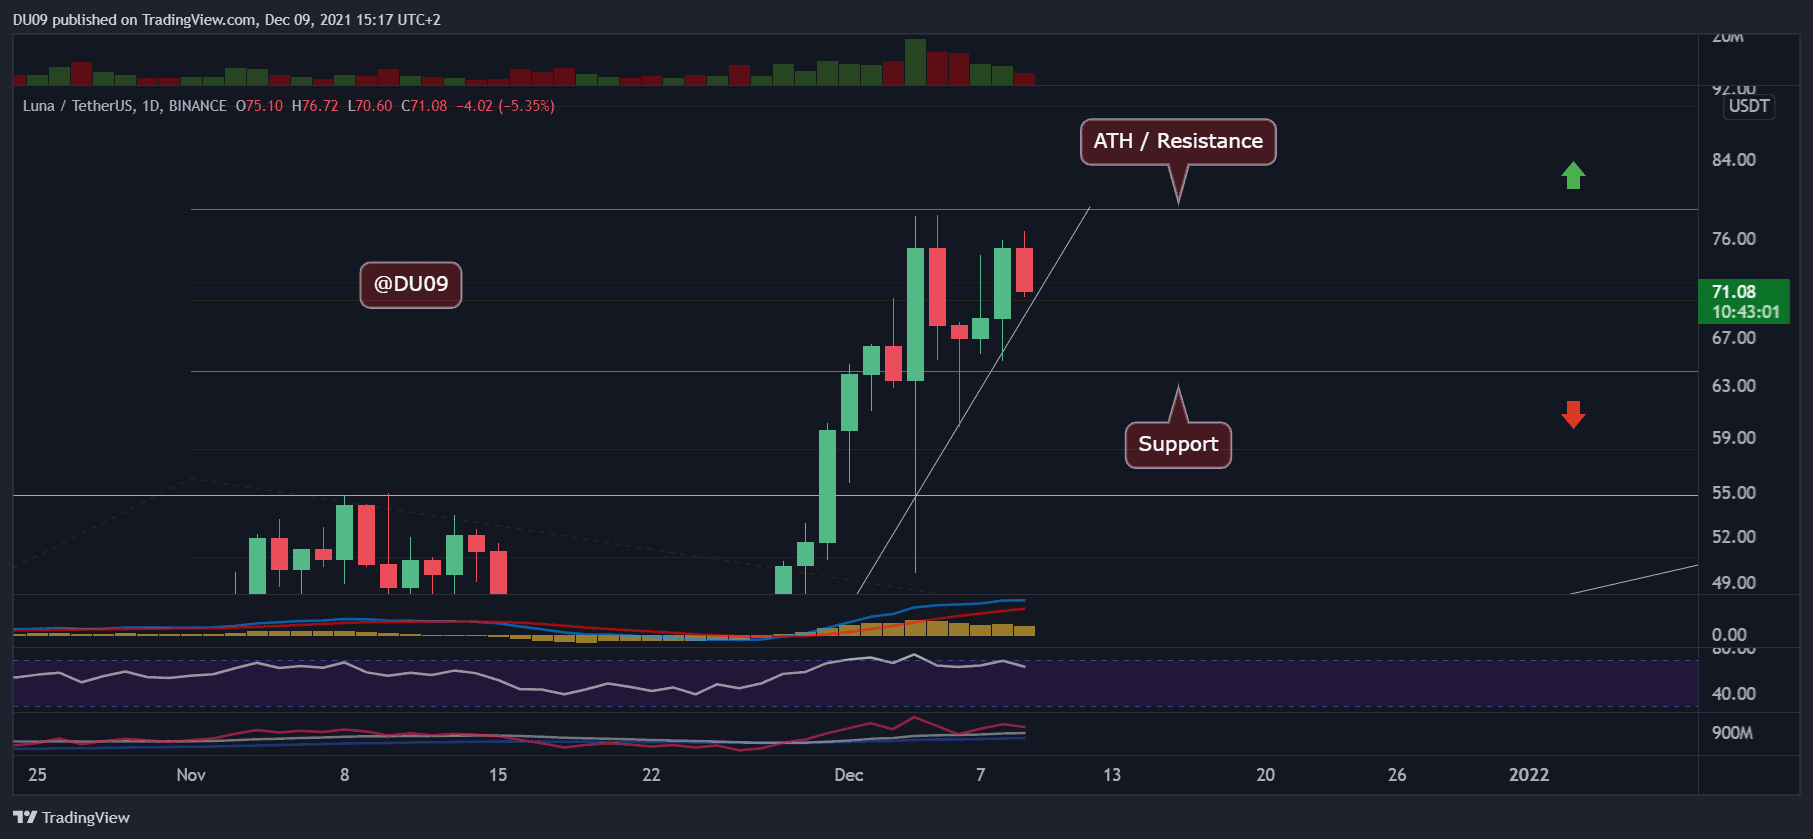
Key Resistance levels: $78
Luna’s rally came to a halt at the $78 resistance level. The fact that volume has been decreasing since then may give the bears an opening to take control of price, even if for a short period. The current key support levels are found at $64 and $55.
During the flash crash from December 4th, the bulls had full control of price at the $55 support area. Therefore, any attempts to pull Luna down should consider this critical level as a major obstacle.
Technical Indicators
Trading Volume: The volume is decreasing, and this may spell trouble in the nearby future.
RSI: The RSI is curving back down and completed a lower high while the price maintained its level. This is another sign of weakness. The bears are likely to exploit this to their advantage.
MACD: The MACD histogram is making lower highs, similar to the RSI. This is bearish, and if the daily moving averages chart a bearish crossover, then Luna is likely to fall back to its key support.
Bias
The bias for Luna is neutral. It will remain as such until the bulls are able to commit towards a further push higher.
Short-Term Price Prediction for Luna
Luna is giving some signs of weakness after setting the all-time high at $78. For this reason, it is entirely possible for the cryptocurrency to enter a short-term correction as well.