Litecoin Price Analysis: Bears Take Control Despite Recent Litecoin Halving
Litecoin has seen a sharp 5% price decline over the past 24 hours and it’s currently trading at around $86.53. In the past week, the cryptocurrency is down 11.82% while during the last 30 days LTC lost around 20 percent of its value.
The Litecoin halving failed to produce any increases, confirming what the majority believed – that it was already priced in during the run-up toward the halving.
However, it’s worth noting that it has only been a few days after the halving took place and that it would likely take more time for the supply and demand dynamics to kick in, potentially triggering some sort of price increase.
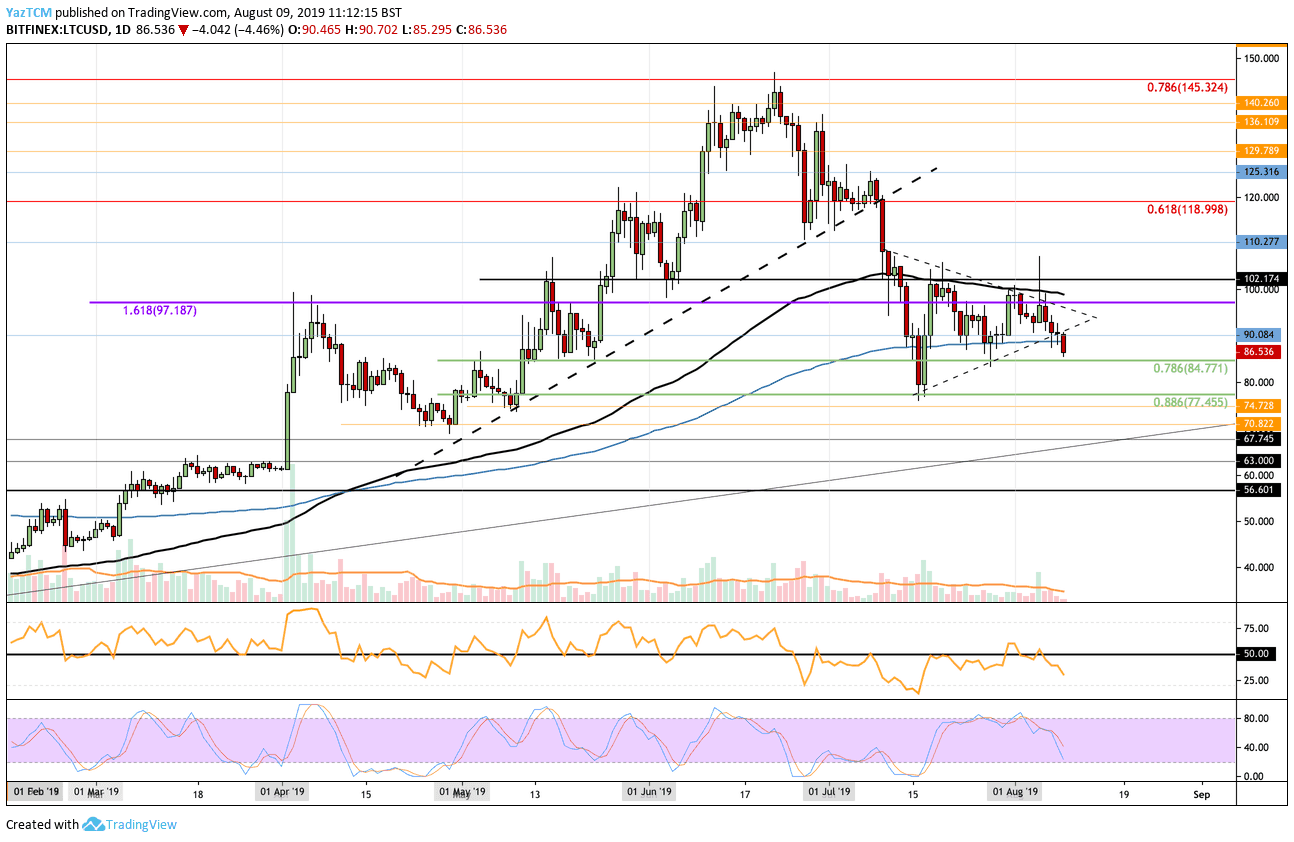
Looking at the LTC/USD 1-Day Chart:
- Since our previous Litecoin analysis, we can see that Litecoin continued to move as expected after rolling over at the upper boundary of the symmetrical triangle. Litecoin then went on to collapse beneath this triangle as the bears took control today.
- From above: The nearest level of resistance lies at $90. Above this, higher resistance is located at $95, $97, and $100. The resistance at $100 is significant due to the 100 days EMA being located here.
- From below: Support now lies at $84.77 which contains the .786 Fib Retracement. Beneath this, further support is found at $80 and $77.45 (.886 Fib Retracement). If the sellers continue to drag the price below $75, we can expect support at $70, $67.75, $63, and $60.
- The trading volume still remains below average and very low.
- The RSI has recently dipped well below 50 as the bears take control of the market momentum. Furthermore, the Stochastic RSI bearish crossover signal had recently marked the move lower.
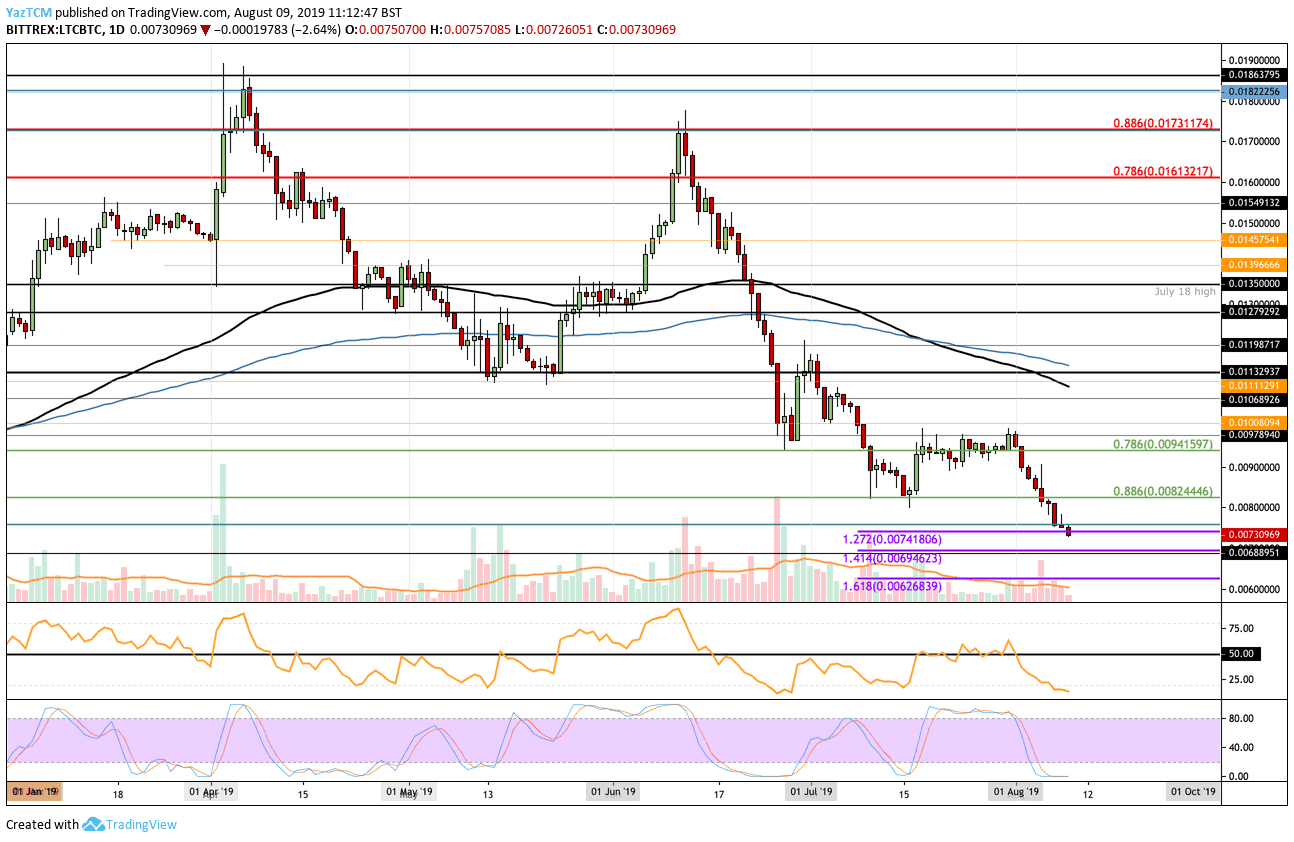
Looking at the LTC/BTC 1-Day Chart:
- Against Bitcoin, we can see that LTC has collapsed through the support at 0.008244 BTC to drop further to 0.007209 BTC. This latest price decrease now brings LTC to a low not seen since mid-December 2018.
- From above: If the bulls can start to rebound, resistance will be found at 0.0075 BTC, 0.008 BTC, and 0.008244 BTC. This is then followed with further resistance at 0.0085 BTC, 0.009 BTC, 0.009415 BTC, 0.0097 BTC, and 0.01 BTC.
- From below: The nearest level of support is now located at 0.007 BTC. This is immediately followed by some strong support at the downside 1.414 Fibonacci Extension level priced at 0.006946 BTC. This combined level of support had allowed the market to rebound during December 2018 and is expected to be strong moving forward.
- The trading volume has increased during this latest round of selling.
- The RSI has recently reached extreme oversold conditions which could be a sign that the sellers are reaching exhaustion. It is important to note, however, that the RSI can remain oversold for extended periods of time. Furthermore, this sentiment is shared by the Stochastic RSI as we wait for a bullish crossover to signal a move higher.
The post Litecoin Price Analysis: Bears Take Control Despite Recent Litecoin Halving appeared first on CryptoPotato.