Litecoin Price Analysis April.4: Following 40% Weekly Gains, Could LTC Overcome $100?
Litecoin has been on an epic surge over the past seven days rising by a total of 40% to bring the current price up to $86. This was followed by reaching the legendary level of $100 per coin yesterday. The cryptocurrency has seen a further price increase totaling 160% over the previous 90 days.
Litecoin has now raced into the 5th place on the top cryptocurrencies by market-cap value as it currently holds a $5.3337 billion market cap, very close to Bitcoin Cash ($5.338 B).
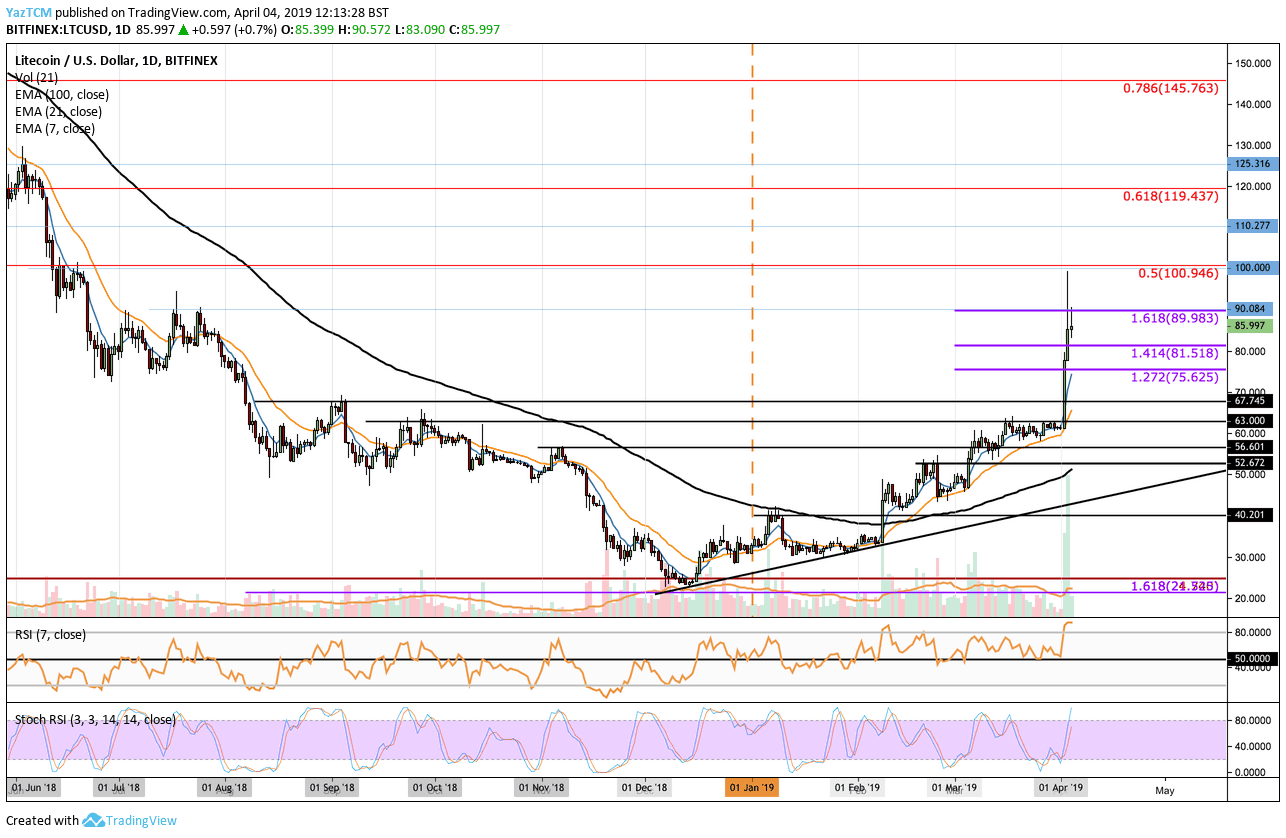
Looking at the LTC/USD 1-Day Chart:
- Litecoin has been surging since reaching the bottom of around $25 in December 2018. During February 2019, we can see that Litecoin had managed to break above the 100-day moving average line, which is a strong bullish signal. Since then, the market has continued to climb further higher and has recently nearly spiked toward the $100 level, creating a fresh 9-month price high. Price action has fallen slightly since then, and is now trading around $86.
- From above: The nearest level of resistance now lies at $90 which is the July 2018 high. Above $90, further resistance lies at $100 which contains a long term bearish 0.5 Fibonacci Retracement level. If the buyers continue above $100, further resistance lies at $110, $119 and $125.
- From below: Support now lies at $81 and $75. Beneath $70, further support lies at $63, $52 and the 4-month old ascending support trend line.
- The Stochastic RSI had recently been approaching the overbought conditions. However, there is still some time before this is reached completely. Watch crossly for a cross-over down.
- The trading volume has increased significantly during the first days of April 2019.
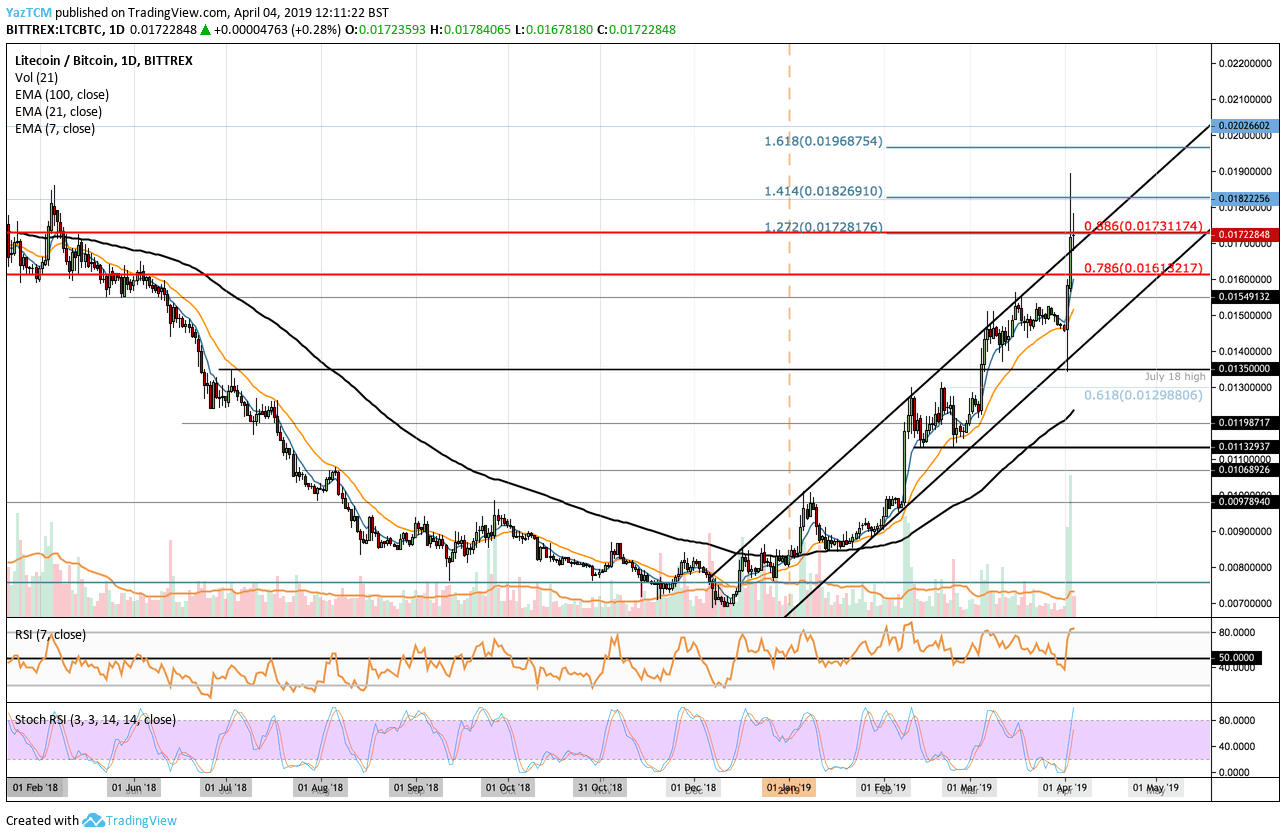
Looking at the LTC/BTC 1 Day Chart:
- Taking a look at LTC/BTC, we can see that the coin has been trading within the confines of a steep ascending price channel. During the most recent trading session, LTC/BTC has broken above this price channel and has met resistance at 0.017 BTC where lies the bearish .886 Fibonacci Retracement level.
- From above: If the buyers break above the current resistance at 0.017 BTC, further resistance lies at 0.0182 BTC and between 0.0196 BTC, and 0.02 BTC. Above 0.02 BTC further resistance lies at 0.023 BTC.
- From below: The nearest support lies at 0.016 BTC. Beneath this, further support lies at 0.0154 BTC and the lower boundary of the steep ascending price channel. Beneath the price channel, support lies at 0.0135 BTC and 0.0129 BTC.
- The RSI has reached overbought conditions as confirmed by slightly lagging Stochastic RSI which indicates that the bullish momentum may be overstretched.
- The trading volume has also increased significantly to more than double the average volume.
The post Litecoin Price Analysis April.4: Following 40% Weekly Gains, Could LTC Overcome $100? appeared first on CryptoPotato.