Is XRP Ready to Join the Crypto Market Rally? (Ripple Price Analysis)
After a period of muted price action and consolidation, Ripple has found support at the 100-day moving average, triggering a modest bullish rebound.
However, the price remains confined between the 100 and 200-day MAs, making a decisive breakout essential for initiating a strong rally.
XRP Analysis
By Shayan
The Daily Chart
XRP has recently found support at the 100-day moving average, prompting a slight bullish rebound. However, the asset remains trapped between the 100-day and 200-day moving averages, currently positioned at $2 and $2.4, respectively.
After facing rejection at the key $2.4 resistance, Ripple retraced toward the $2 range, which is acting as a significant support zone. The influx of demand at this level has led to a moderate bounce. Still, a decisive breakout above or below this tight range is crucial for confirming the next directional move.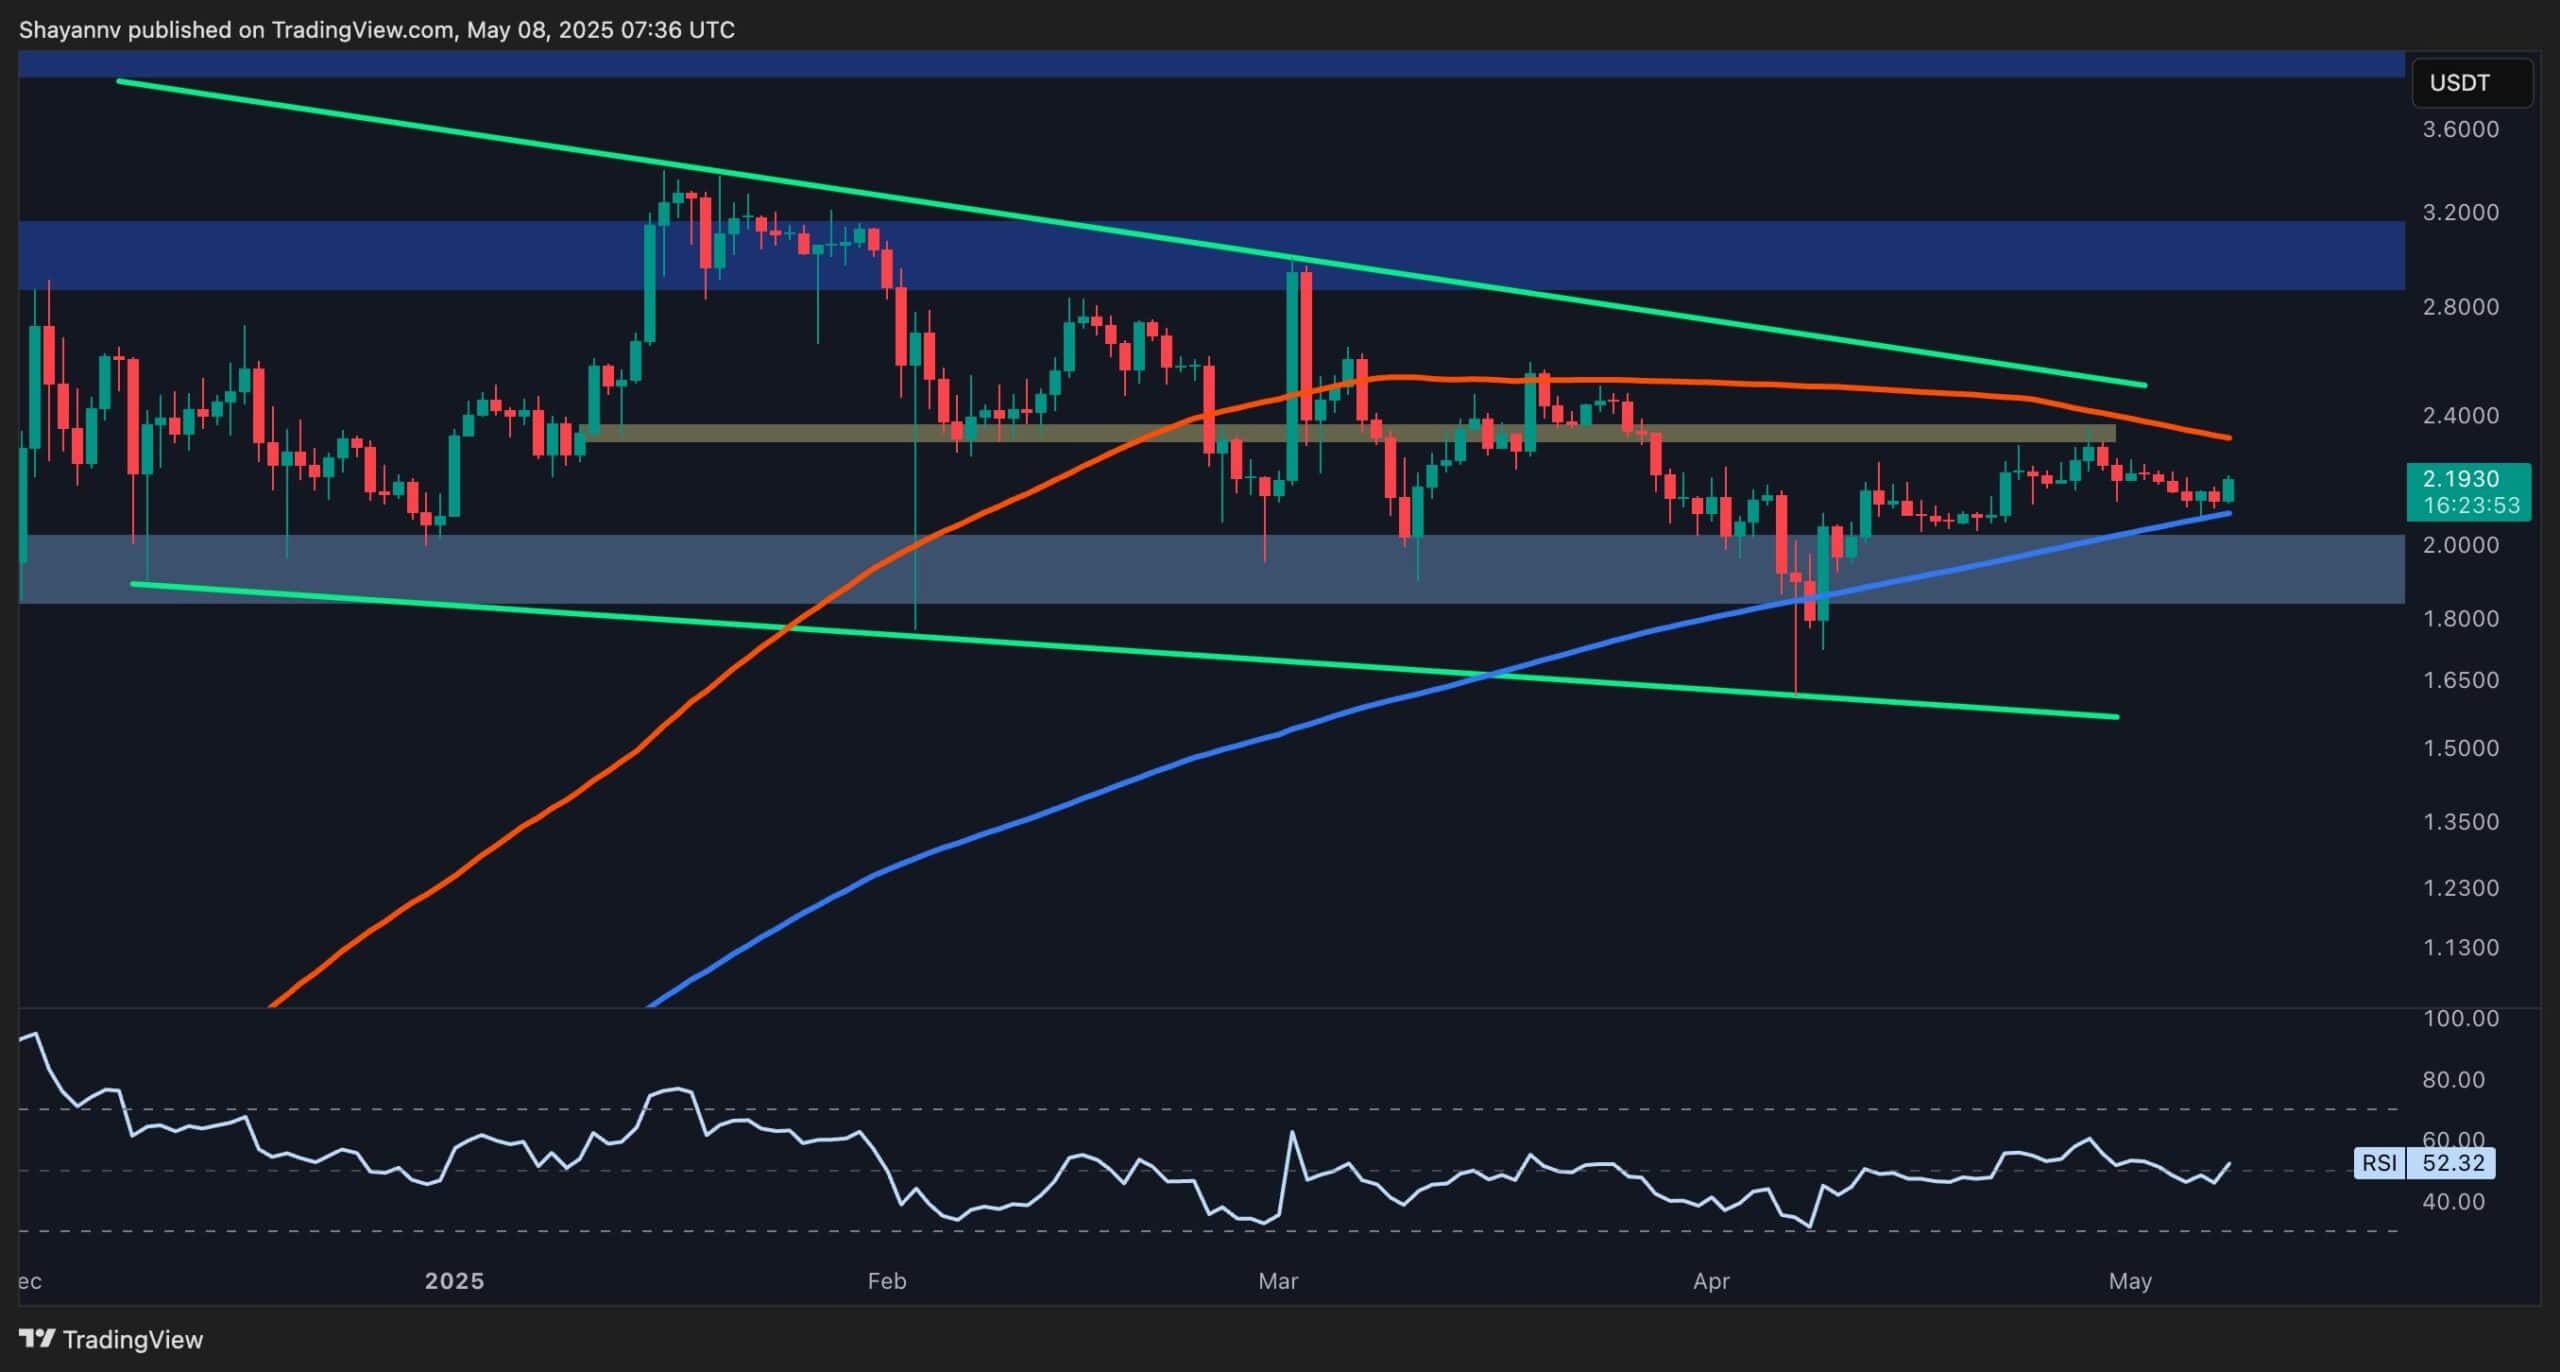
The 4-Hour Chart
On the 4-hour timeframe, technical weakness is more apparent. XRP was rejected at the $2.4 resistance and pulled back shortly after failing to breach this level. However, it found support at the $2 psychological level, sparking a short-term rebound. For this bullish momentum to continue, additional buying pressure is needed to overcome the $2.4 resistance.
Given current conditions, a retest of the $2.4 level seems likely in the short term, followed by potential consolidation. If demand strengthens near this zone, a breakout could drive the price toward the $2.8 resistance level.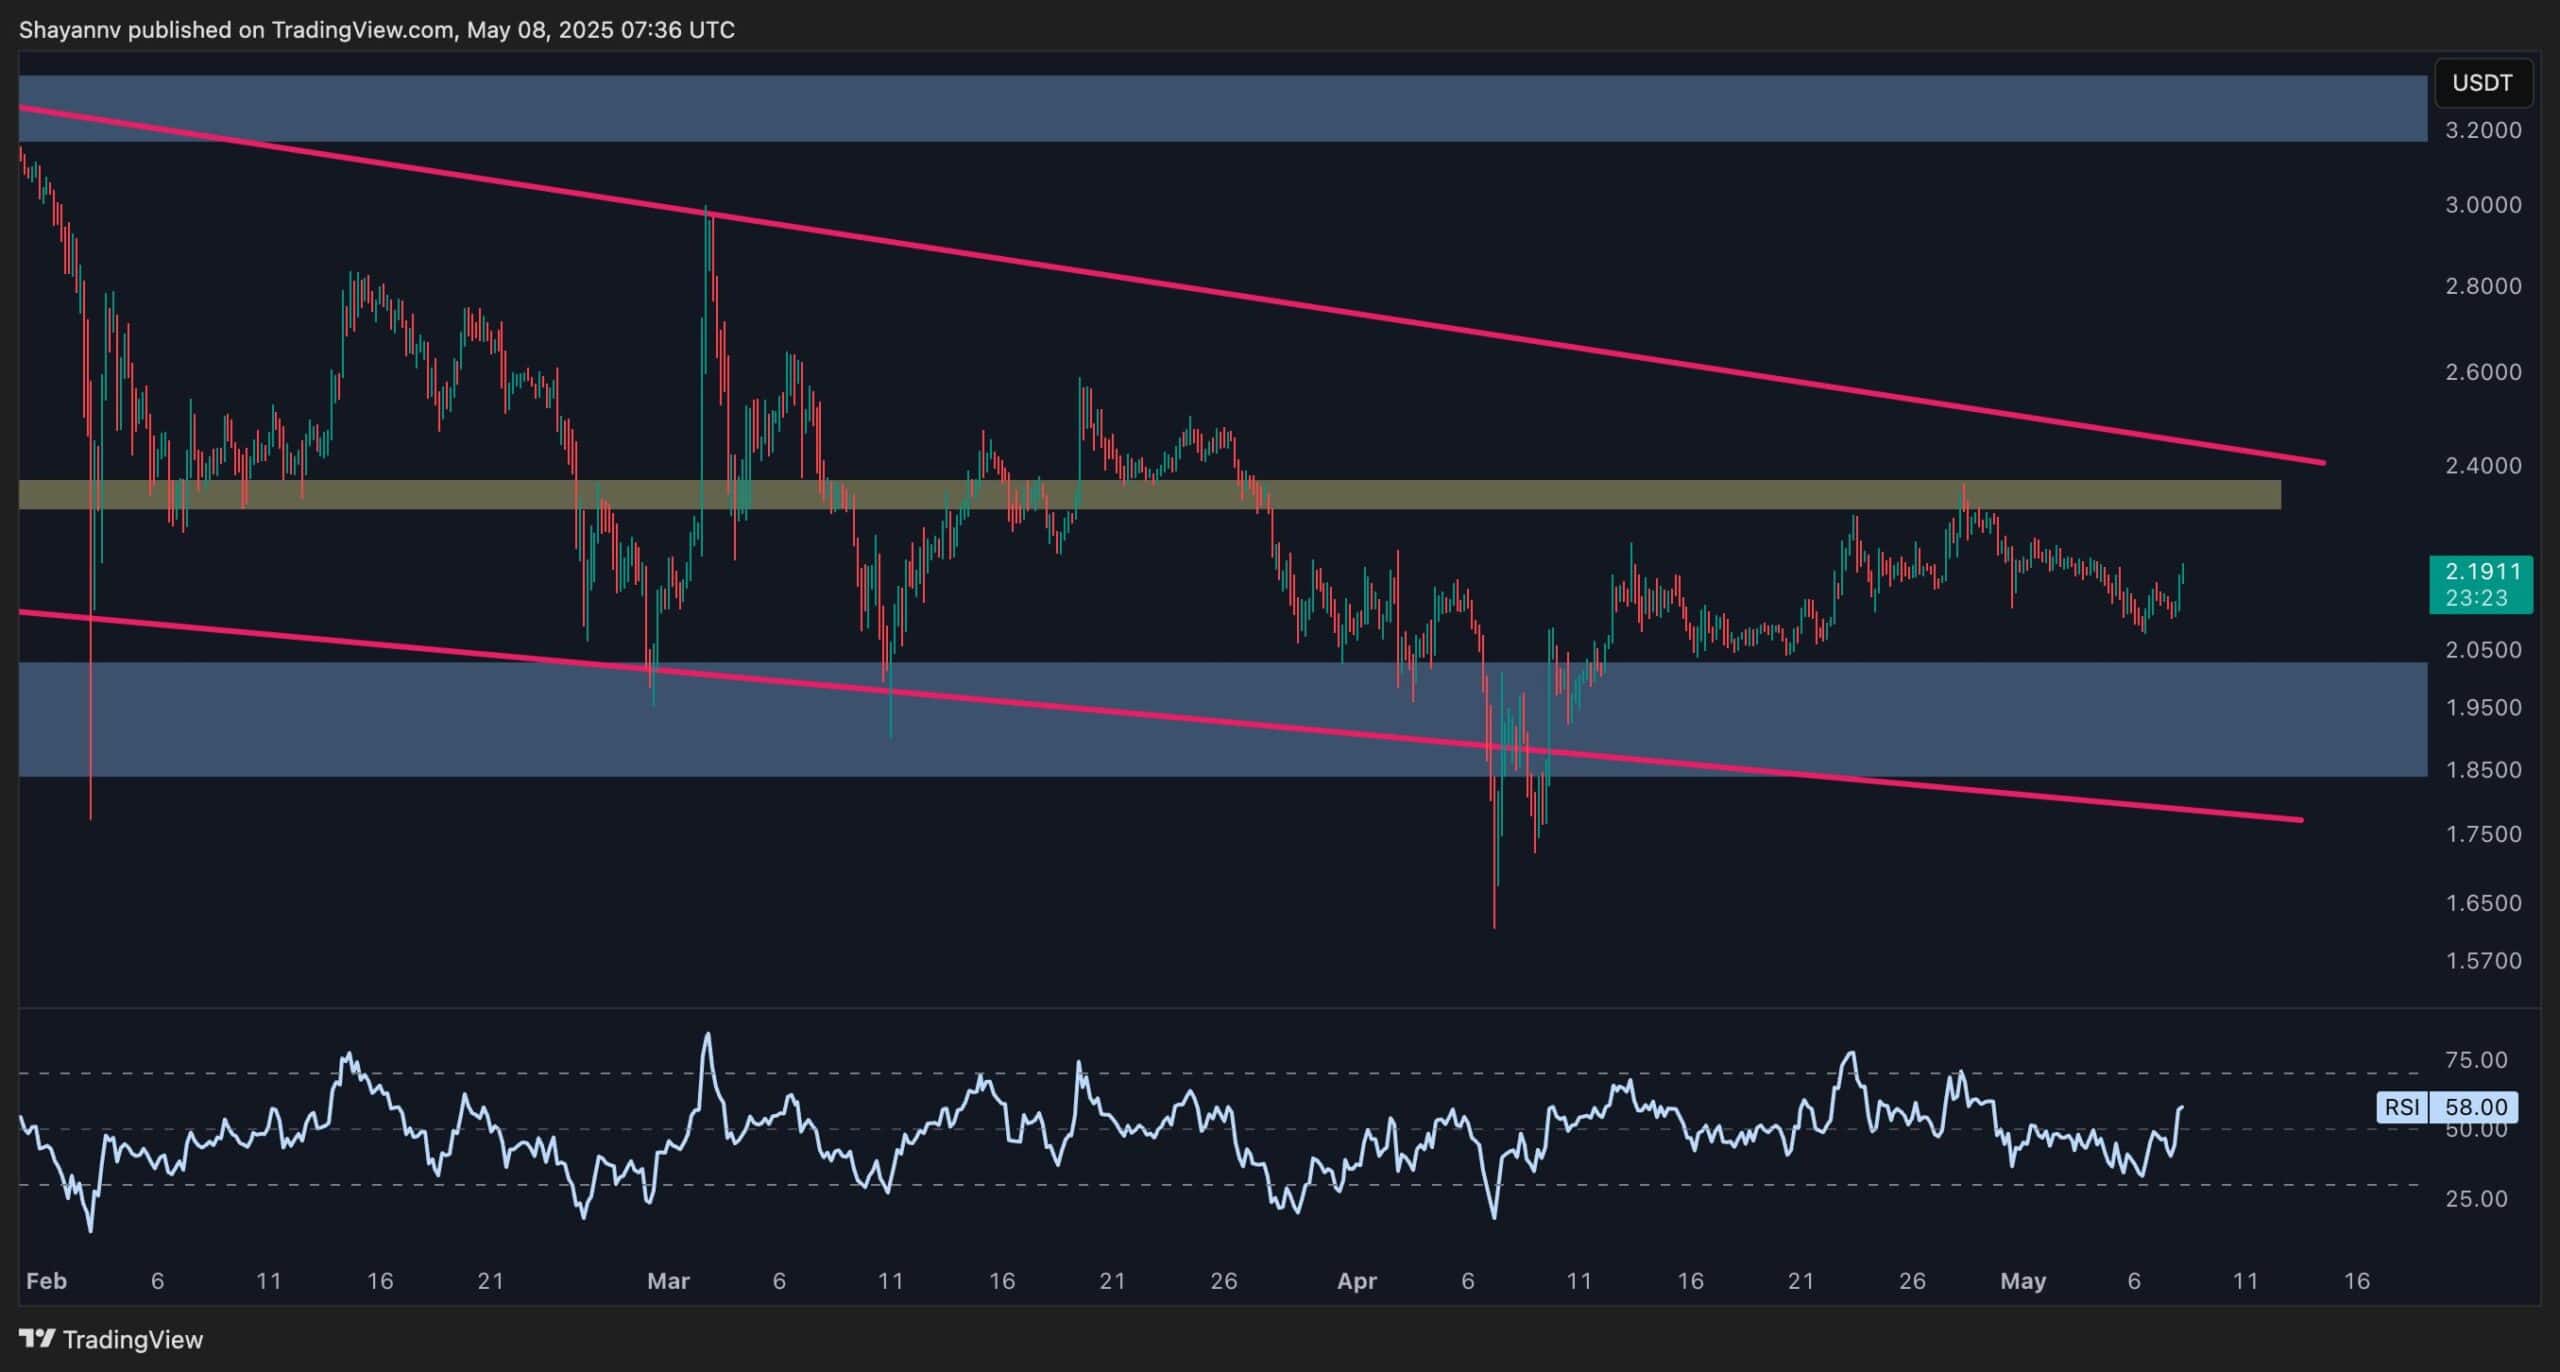
The post Is XRP Ready to Join the Crypto Market Rally? (Ripple Price Analysis) appeared first on CryptoPotato.