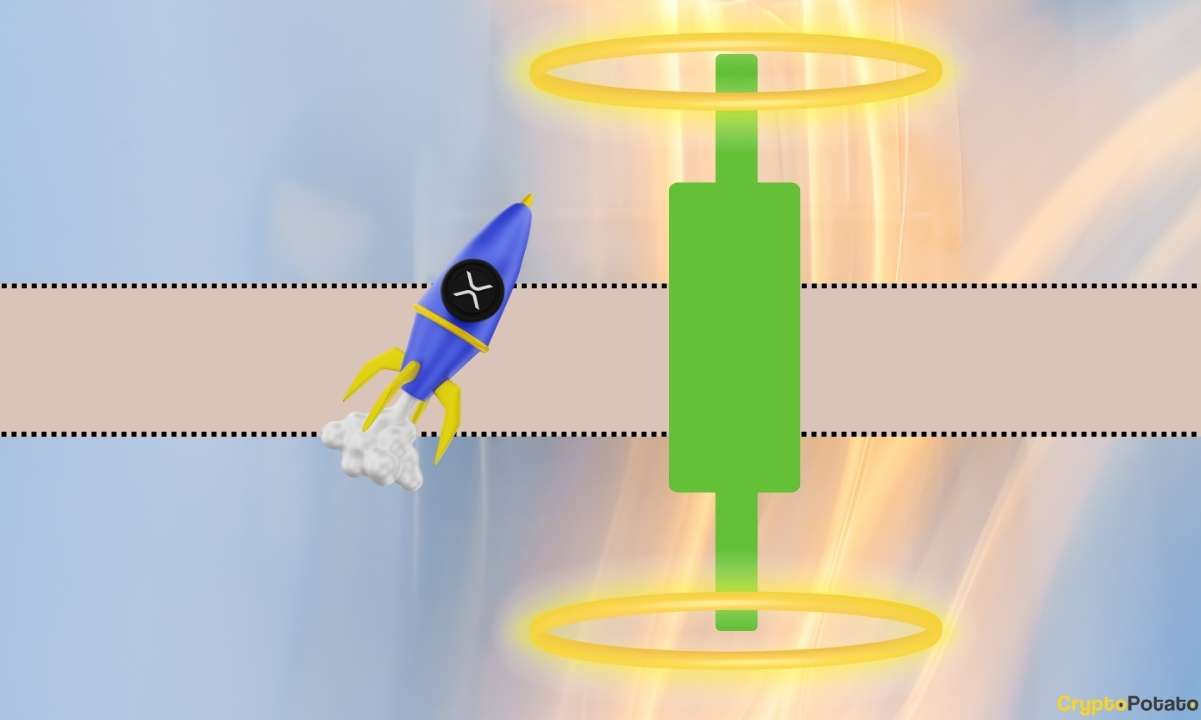
Is Ripple (XRP) Price About to Chart a God Candle? The Last Time This Pattern Appeared, Price Soared 900%
TL;DR
- Tony “The Bull,” an XRP analyst, identifies a chart pattern on Ripple’s price chart similar to 2017, suggesting a potential upcoming surge in XRP value, akin to the previous 900% increase.
- Recent large XRP transfers by anonymous whales imply possible market activity preparation, highlighted by multimillion-dollar transactions between unknown wallets.
- Ripple’s price has surpassed its 100-day and 200-day moving averages, aiming for the next resistance level at $0.80, amid growing global adoption and successes against the SEC.
The bullish XRP analyst recently spotted a pattern on the Ripple price chart that preceded a holy grail candle during the crypto bull run in 2017.
The last time Ripple’s price traced this pattern, it followed up with a 900% candle. By the time XRP prices peaked a month later, the blue-chip cryptocurrency had gained 1,600% in market exchange value.
900% Ripple God Candle Ahead?
Tony “The Bull,” a Level 3 certified Chartered Market Technician, recently wrote in a post on X.com:
“Imagine if it happened that fast, when everyone thinks they have months to years to accumulate #XRP
$XRP has formed the same 1M Japanese candlestick setup as late 2017, right before a 900% candle
Thin order books, unwinding of shorts, and FOMO can pack a powerful punch”
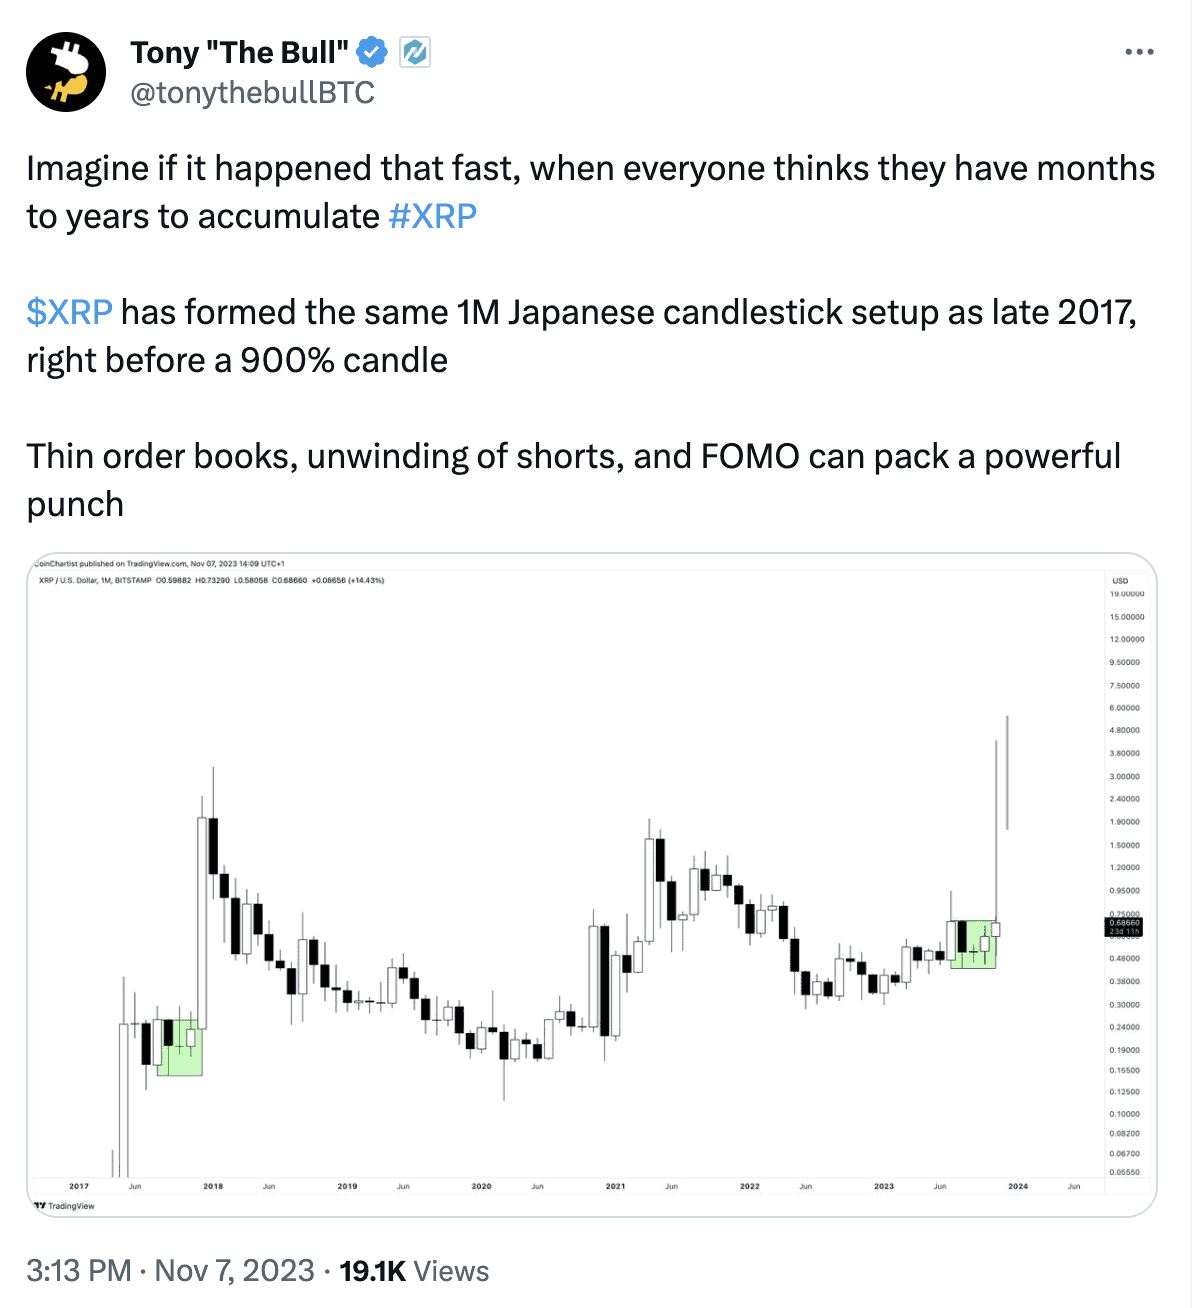
Back in 2017, the chart pattern preceded a rise in Ripple price from $0.16 on Dec 8, 2017, to $2.70 by Jan 5, 2018. With XRP trading at an average price of $0.65 on crypto exchange markets Monday, a repeat of the late 2017 bull run would move the price to $10.96.
Meanwhile, if you’re interested in some shocking XRP price predictions for Q4 of this year, please take a look at our video on the matter:
XRP Bulls, Whales Make November Moves
Meanwhile, anonymous Ripple whales have made some giant splashes on chain. On Saturday, November 11, an unknown wallet transferred 425,807,780 XRP (worth $288.5 million) to a new unknown wallet.
Then, on Sunday, November 12, another unknown wallet moved 424,307,758 tokens (worth $218 million) to an unknown new wallet.
Are they gearing up for an XRP god candle move in exchange markets? The fast-growing pace of global adoption and big wins against the SEC are bringing out the XRP bulls. It might also be Ripple moving tokens around in preparation to liquidate, as they do regularly.
Zooming in on the daily Ripple price chart, exchange rates for the fifth largest crypto by market cap recently broke above their 100-day and 200-day moving averages. The next key resistance target for bulls is the $0.80 level.
The post Is Ripple (XRP) Price About to Chart a God Candle? The Last Time This Pattern Appeared, Price Soared 900% appeared first on CryptoPotato.