Is PEPE Coin Crash Imminent? Three Things to Watch (PEPE Price Analysis)
With the price just above a critical support, PEPE is approaching a decisive moment.
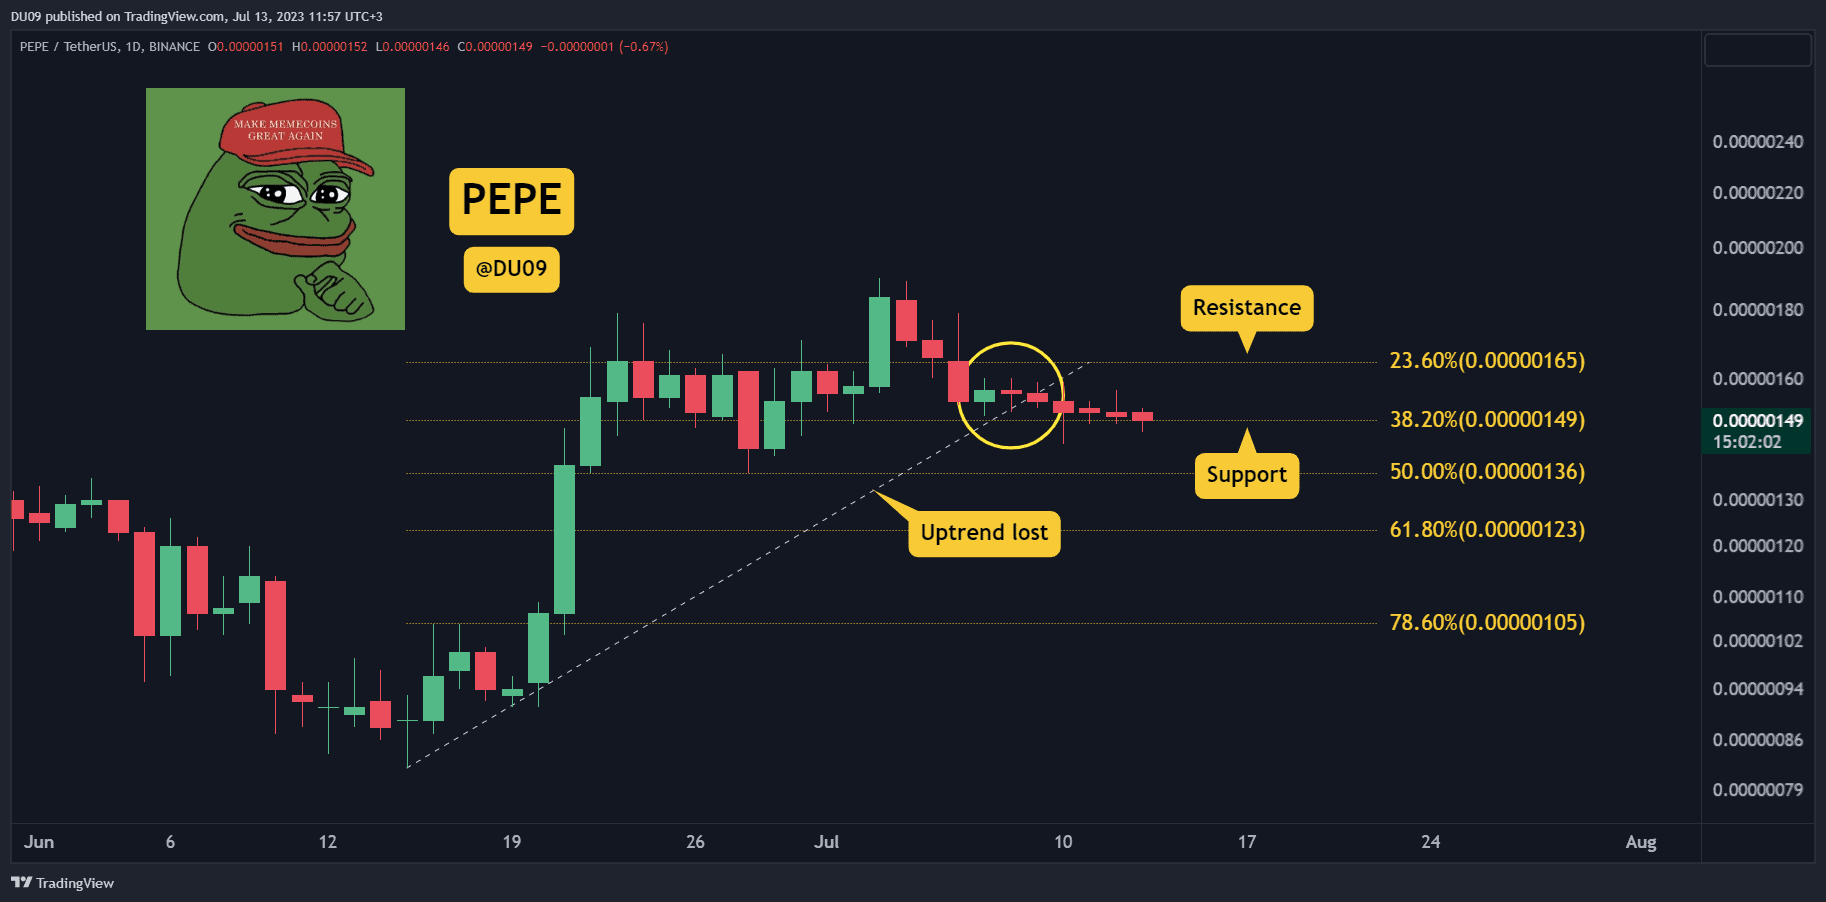
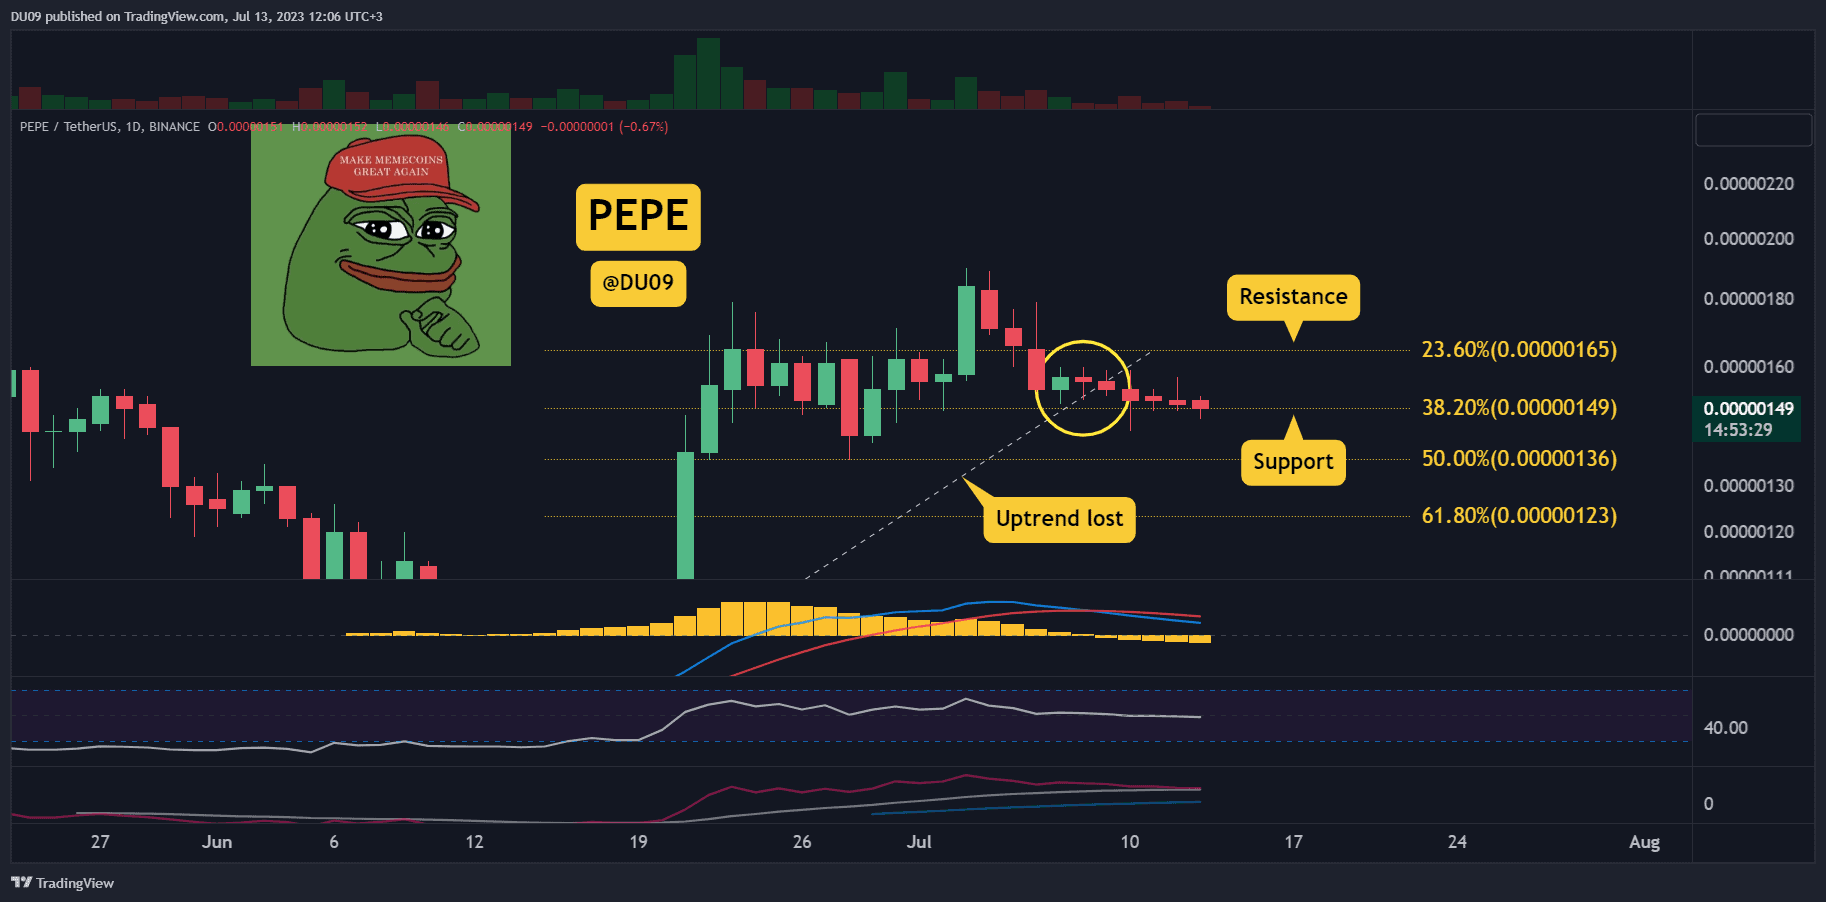
Key Support levels: $0.00000149
Key Resistance levels: $0.00000164
1. Uptrend Lost
PEPE doubled in price during its rally in June, but this quickly ended in early July after making a local high. Since then, the price entered into a downtrend, which so far has found some relief on the key support at $0.00000149. However, with six consecutive daily candles in red right now, PEPE is not in a position of strength.
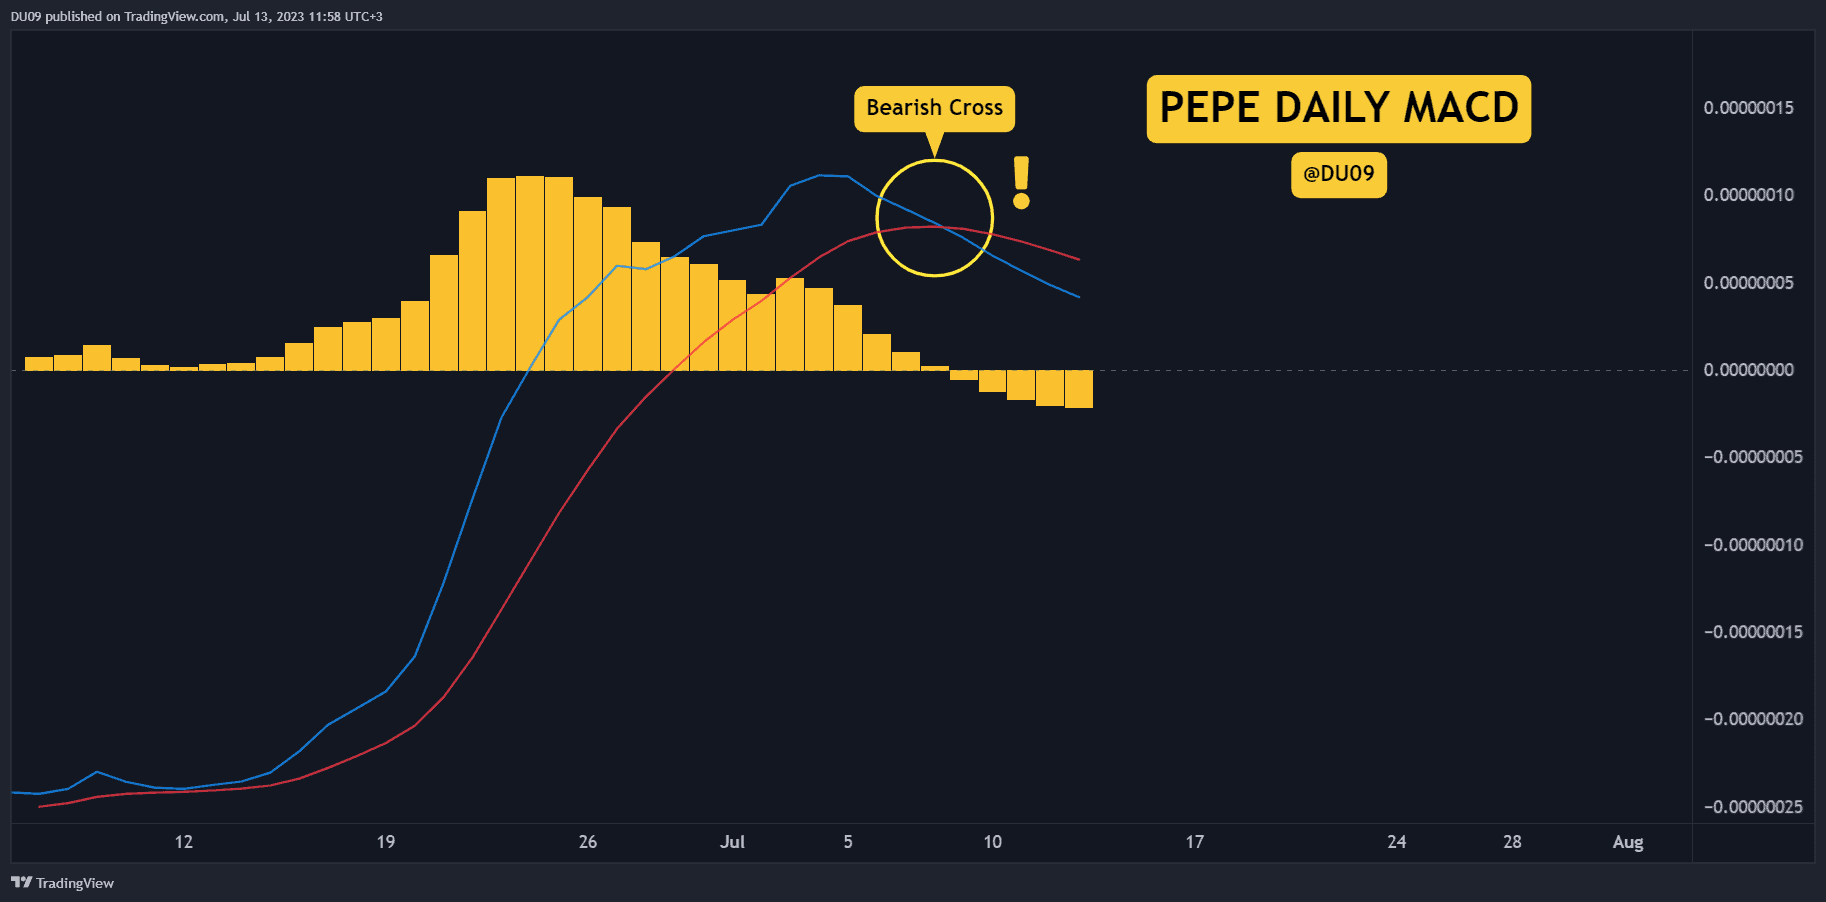
2. MACD Bearish Crossover
The daily MACD of PEPE had done a bearish crossover on Sunday, which coincided with the price losing its uptrend. Taken together, these signals point towards a bearish bias, and this seems likely to continue so long buyers don’t return.
3. Support Under Pressure
The key support at $0.00000149 is under constant pressure from sellers. Volume has closed in red for days, and buyers are nowhere to be seen. This makes a breakdown more likely based on this price action.
Bias
The bias for PEPE is bearish.
Short-Term Prediction for PEPE Price
This meme coin is in a weak position right now, and bears may take advantage of this. If the current support falls, then the price might move quickly to $0.00000136, which is the next level of support.
The post Is PEPE Coin Crash Imminent? Three Things to Watch (PEPE Price Analysis) appeared first on CryptoPotato.