Is Bitcoin’s Chart Similar to the Last Bull Market?
Bitcoin’s price recently plunged below $10,000. As the market remains volatile, a comparison of the 2019 cycle with that of 2016 suggests that Bitcoin might be nearing another massive price spike. According to Faisal Sohail, who has a Ph.D in economics, Bitcoin’s technical analysis at the moment strongly resembles that of 3 years ago. The world’s most popular cryptocurrency experienced its biggest bull run yet the following year.
Bitcoin History Lesson
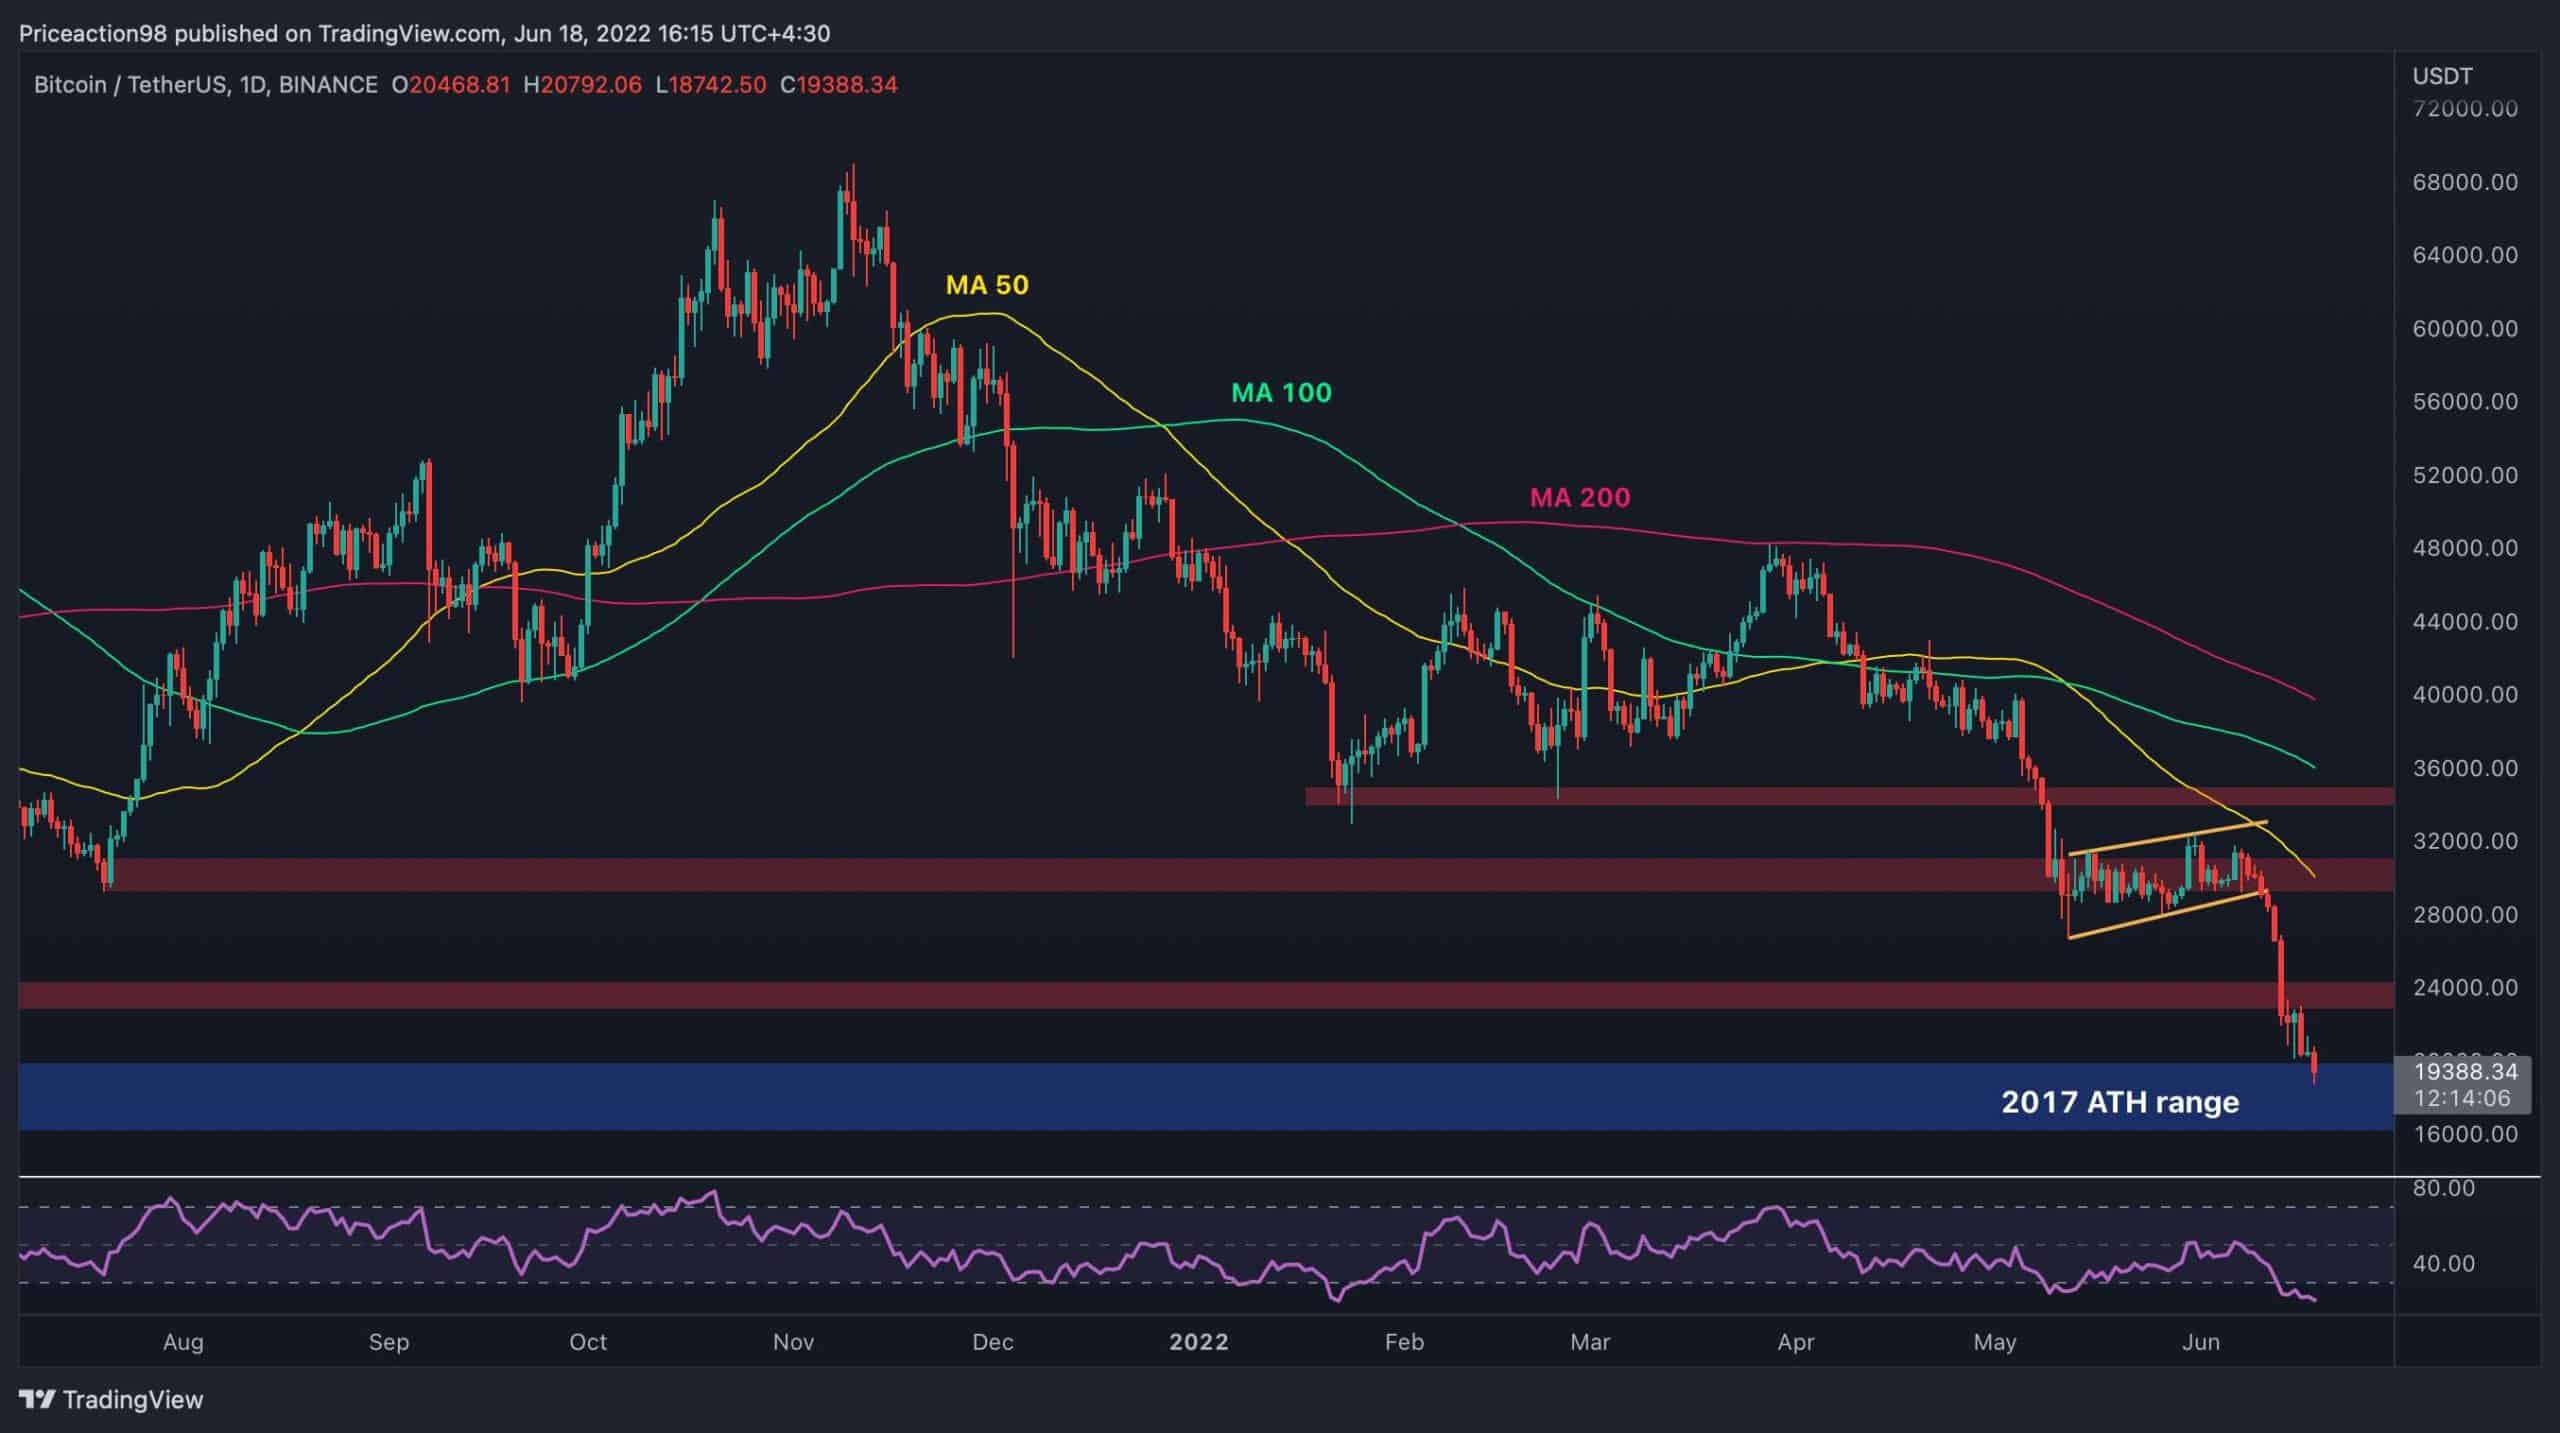
Bitcoin’s weekly chart clearly shows that the price is finding support at the 20-week EMA. The RSI is over 55, and the first red candle in the MACD has occurred along with a bearish MACD cross. During approximately the same period (July-September) back in 2016, the signs were very similar to today’s chart. The support level of the EMA was just above 20, the RSI was at 52, and there was a bearish MACD cross with the first red candle. Sohail’s video analysis emphasizes that both years saw bull markets despite corrections. Shortly after the 2016 correction was a bull run resulting in the all-time high of $20,000.
Sohail’s analysis contains positive predictions about Bitcoin’s future. If history is any indicator, Bitcoin’s all-time high will be surpassed easily in the coming years. Sohail added, “Don’t get manipulated, this might be the best chance to load more on dips.”
What’s to Come for Bitcoin?
As CryptoPotato reported a few weeks ago, 2020 may be the best year in Bitcoin’s history. Several important factors like the May halving, mass adoption, and scarcity make Bitcoin appear to be on the rise when its fundamentals are in check.
However, a more recent analysis is worth sharing as well. While the 2016 comparison appears to be very bullish for Bitcoin, another one from 2018 is less positive. A descending triangle pattern which strongly resembles one from last year which dragged the price down from $6,000 to $3,120 suggests that Bitcoin may be heading to $6,000.
The post Is Bitcoin’s Chart Similar to the Last Bull Market? appeared first on CryptoPotato.