Is Bitcoin Price Heading to Fill CME Gap at $11,100? BTC Analysis & Overview
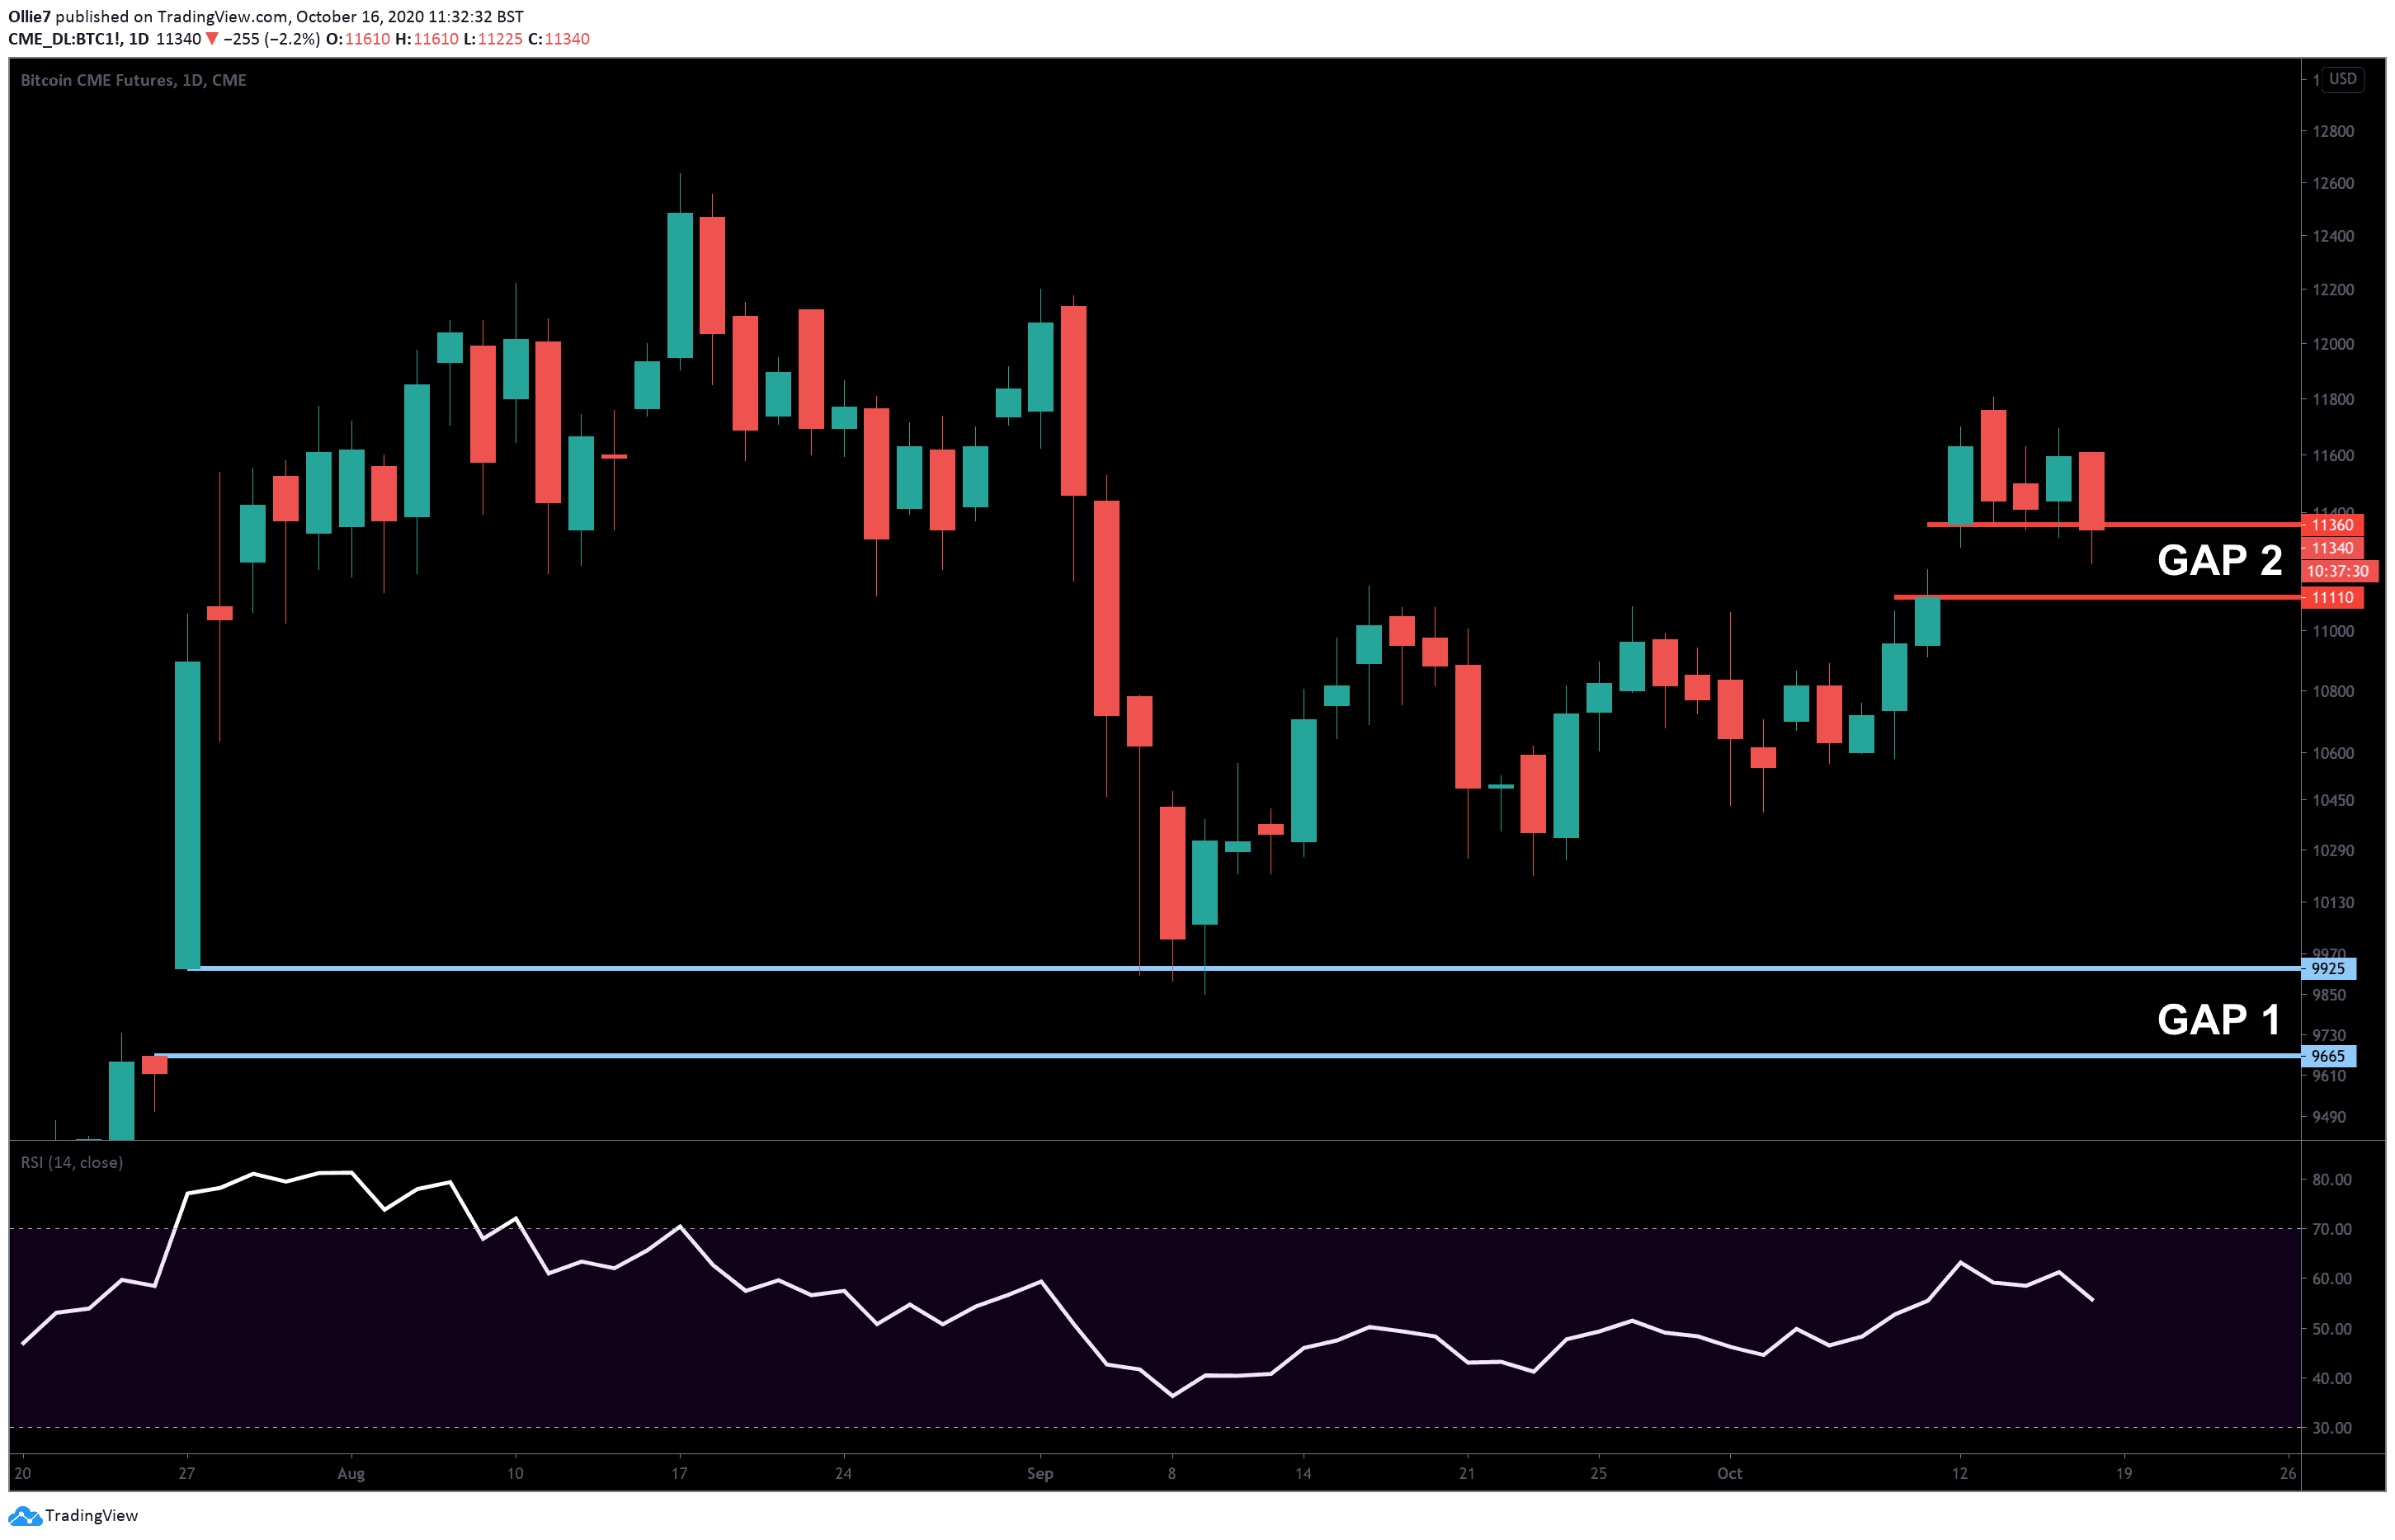
Bitcoin has failed to hold above $11,500 for the second time this week as bears continue to drive prices back down towards the unfilled CME gap at $11,100 (GAP 2).
CME bitcoin futures gaps appear because traditional markets close before the weekend and reopen the following Monday, while BTC continues to be traded 24/7. This means that if the leading crypto experiences high volatility over the weekend and the price changes dramatically when the traditional markets reopen, then a gap will appear in the chart.
These gaps are important because they act like magnets on the price action and are almost always filled. This week when the traditional markets reopened, a gap appeared between $11,110 and $11,360. This is the second unfilled gap to appear on the CME bitcoin futures chart (BTC1!).
Price Levels to Watch in the Short-term
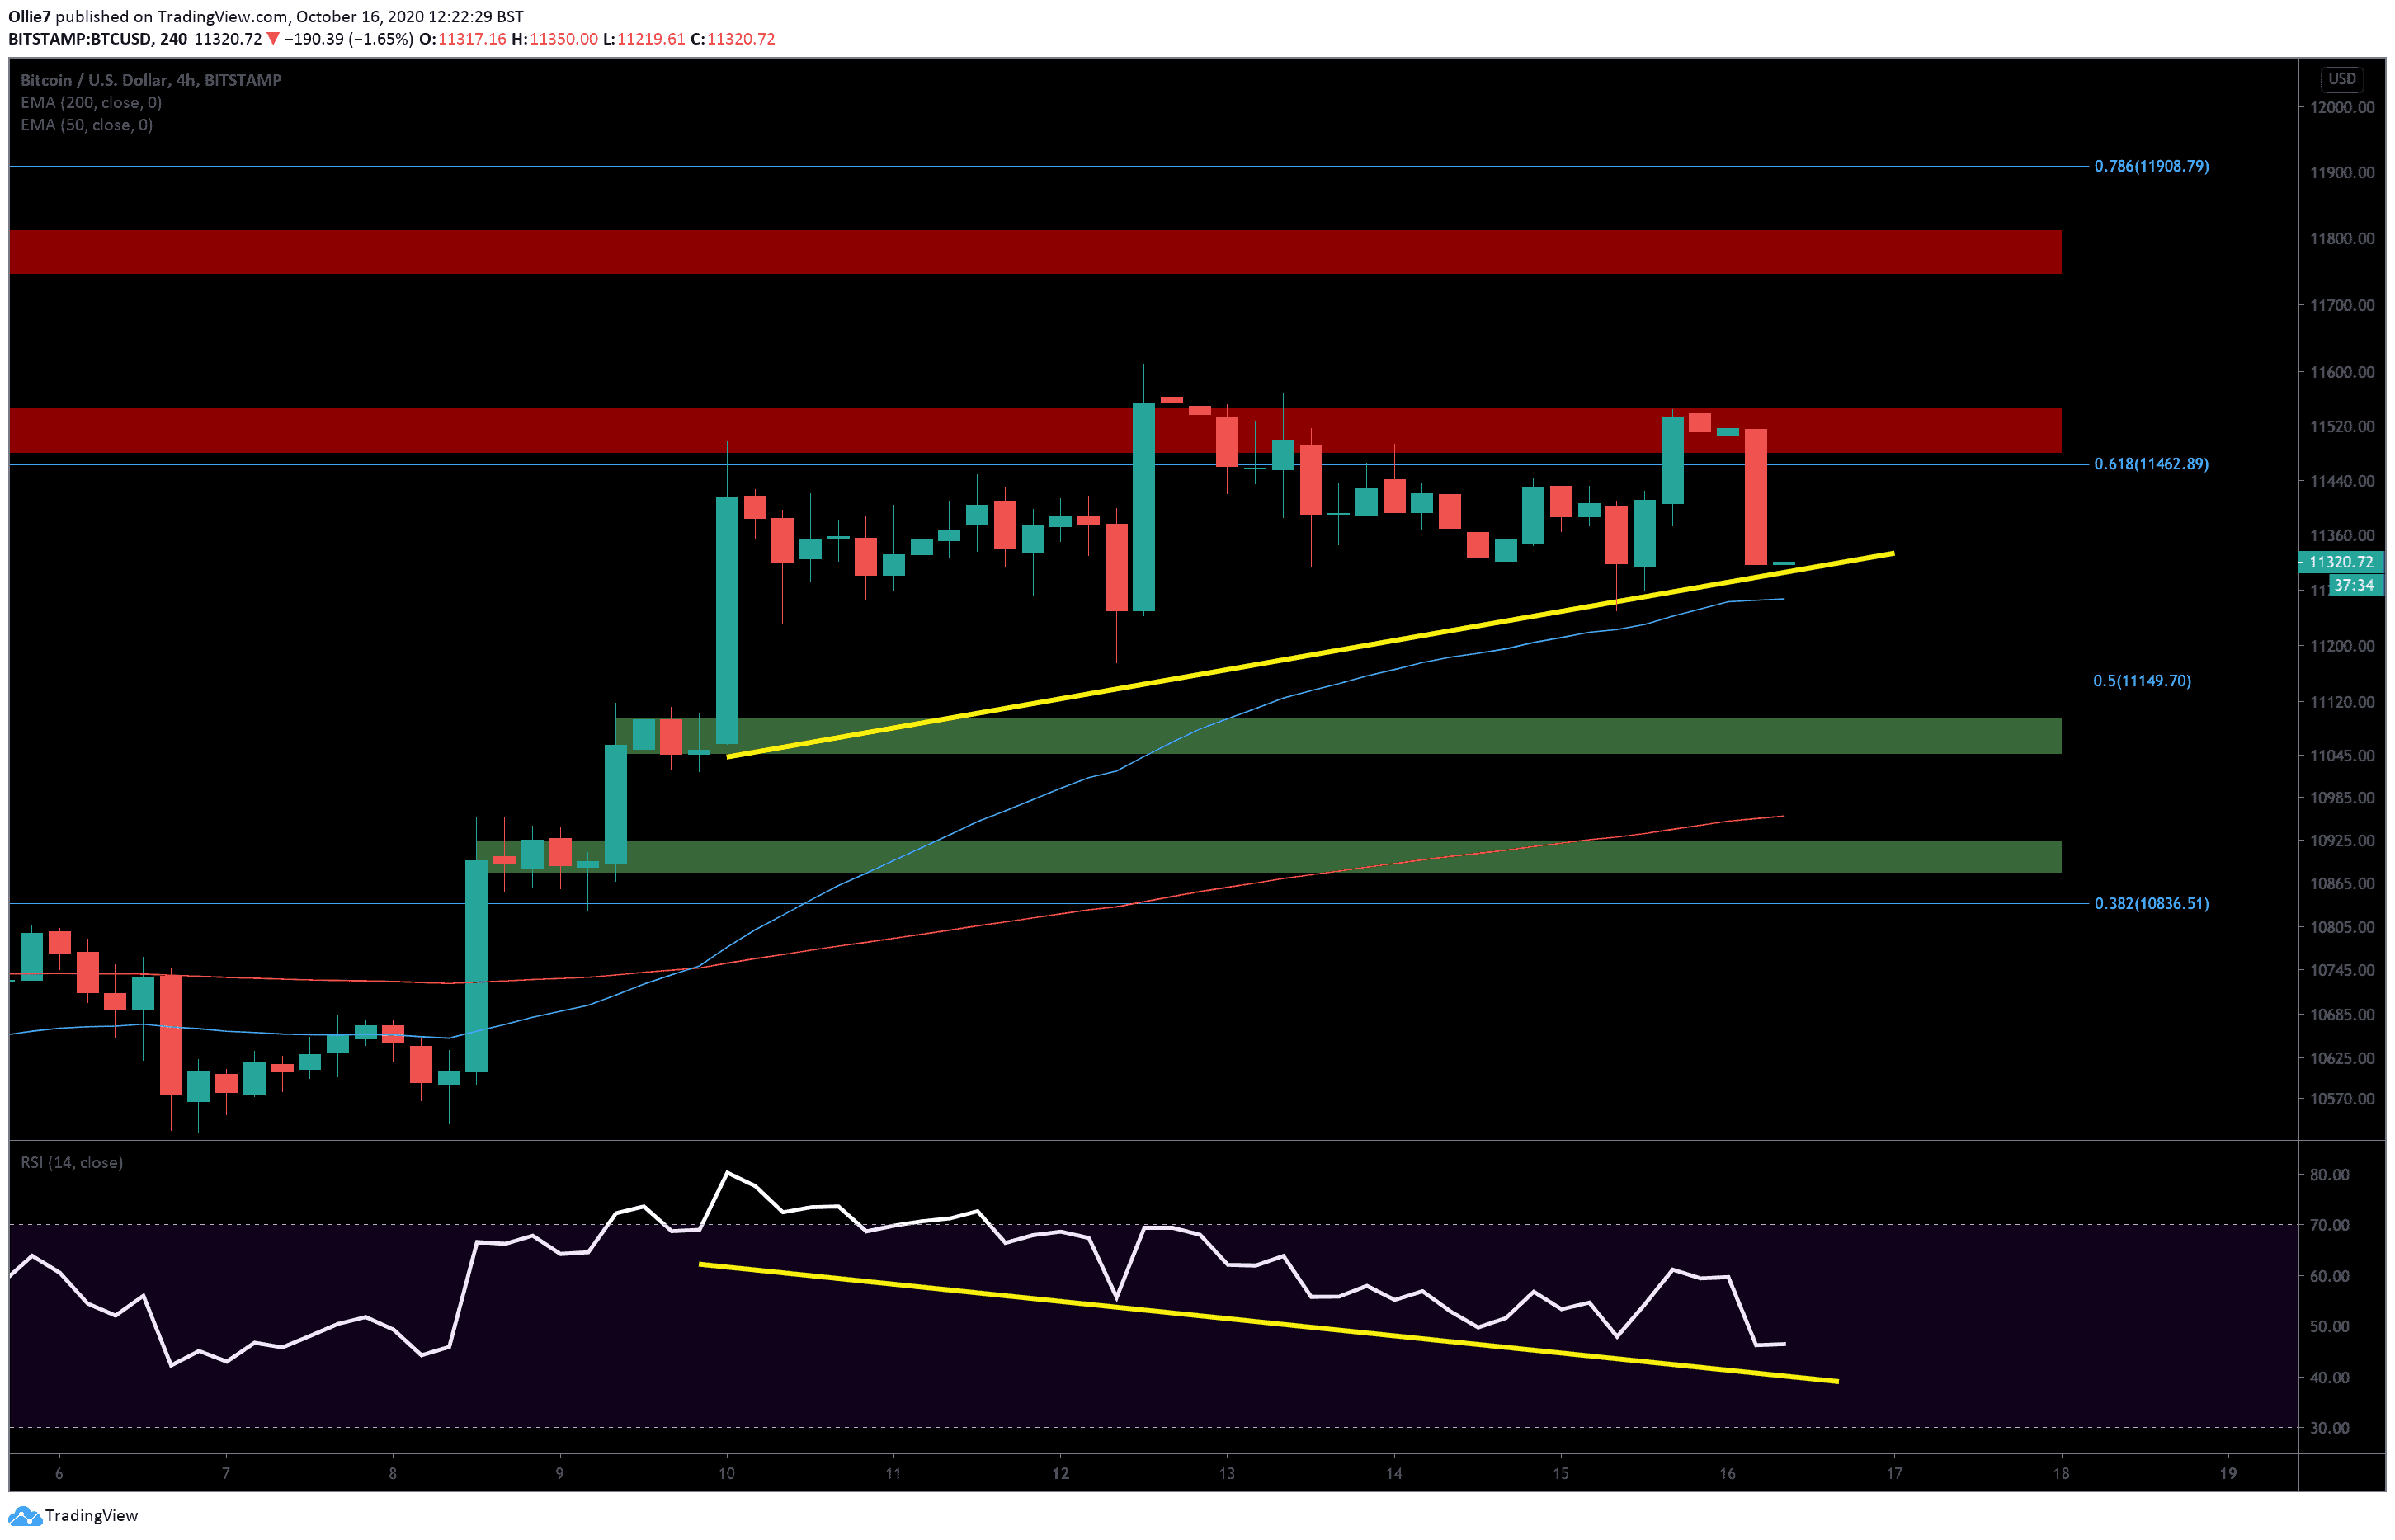
On the 4-hour BTC/USD chart, we can see that there is still a strong divergence between the RSI and the bitcoin price action, as the indicator line continues to make lower lows while BTC candles set higher lows. This reaffirms the previous analysis that we should expect to see bitcoin fall towards the $11K level in the short-term.
Right now, bulls are attempting to hold on to the $11,300 support which is the first area to watch over the intraday session. A fall below this will likely mean prices are headed towards the 50 EMA (blue) at $11,260 and potentially the 0.5 Fibonacci level below at $11,150.
Underneath that, we have two order block supports (green shaded zones) around the $11K and $10.8K levels respectively. We also have the 200 EMA (red) at $10,950 which may see a reaction if prices tumble beneath the psychological $11,000 mark.
Looking above, if bullish traders can defend the $11,300 support and stage a new rally then the first set of price points to overcome will be the 0.618 Fibonacci level at $11,460 and the first main resistance zone (red shaded area) around $11,500.
The $11,800 will continue to be the top target for any breakout attempt in the short-term.
Total market capital: $360 billion
Bitcoin market capital: $209 billion
Bitcoin dominance: 58.1%
*Data by Coingecko.
Bitstamp BTC/USD 4-Hour Chart
CME BTC1! Daily Chart
The post Is Bitcoin Price Heading to Fill CME Gap at $11,100? BTC Analysis & Overview appeared first on CryptoPotato.