Huobi’s Stablecoin Reserves Down 30% Amid Reports of Executive Arrests
A spokesperson for Huobi is denying reports that several executives were arrested in China as outflow from the exchange picks up. Over the weekend, financial media in Hong Kong reported that several executives at Huobi had been taken away by police in China.
According to data from Nansen.ai, Huobi’s stablecoin exchange balances have dipped by 33% in the last week, with traders withdrawing $49 million in stables.
Earlier, Colin Wu of Wu Blockchain had posted that “a large number of senior executives of offshore cryptocurrency exchanges… have been detained and investigated by the Chinese police” without adding specifics.
Data from DeFiLlama shows that Huobi currently has a balance of approximately $2.5 billion. This balance is down from $3.1 billion at the start of the year. On-chain data also shows that some of the exchange’s largest holdings are from tokens connected to the Justin Sun universe of companies and protocols.
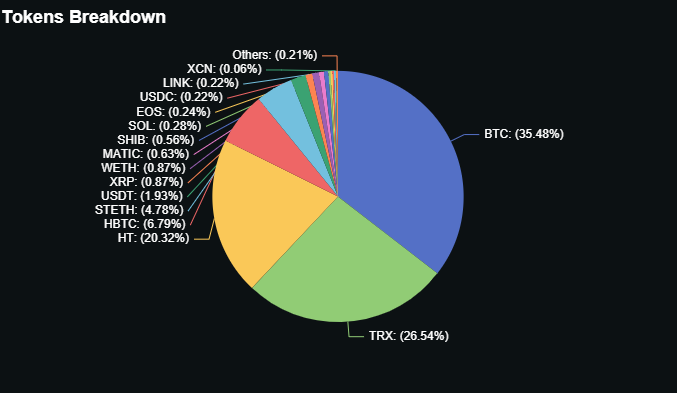
Data shows that 26.5% of the exchange’s holdings are in TRX, TRON’s token, and 20.32% of the holdings are in HT, its exchange token.
Huobi has roughly $1 billion in highly liquid assets, including $886.92 million in bitcoin, $48.27 million in USDT, and $5.41 million in USDC, according to DeFi Llama data.
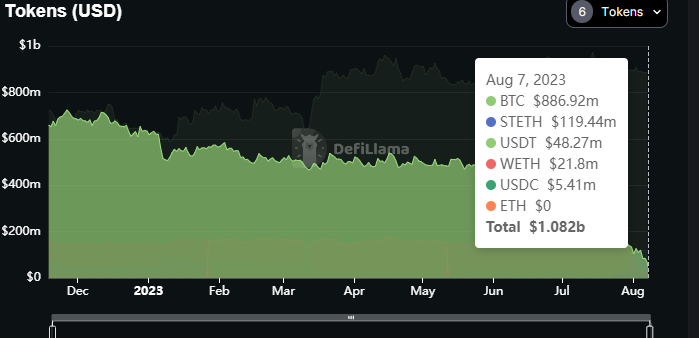
While it doesn’t have any ether, it does have $119.4 million in stETH and $21.8 million in wETH.
Late last year, analytics firm CryptoQuant had flagged concerns over the quality of Huobi’s reserves.
Edited by Parikshit Mishra.