Here’s What XRP Has to Do to Challenge $3 Again: Ripple Price Analysis
Ripple’s price is starting to recover on both the USDT and BTC pairs. However, the extent of this recovery remains to be seen, as there are a few warning signs that are still present.
By Edris Derakhshi
The USDT Paired Chart
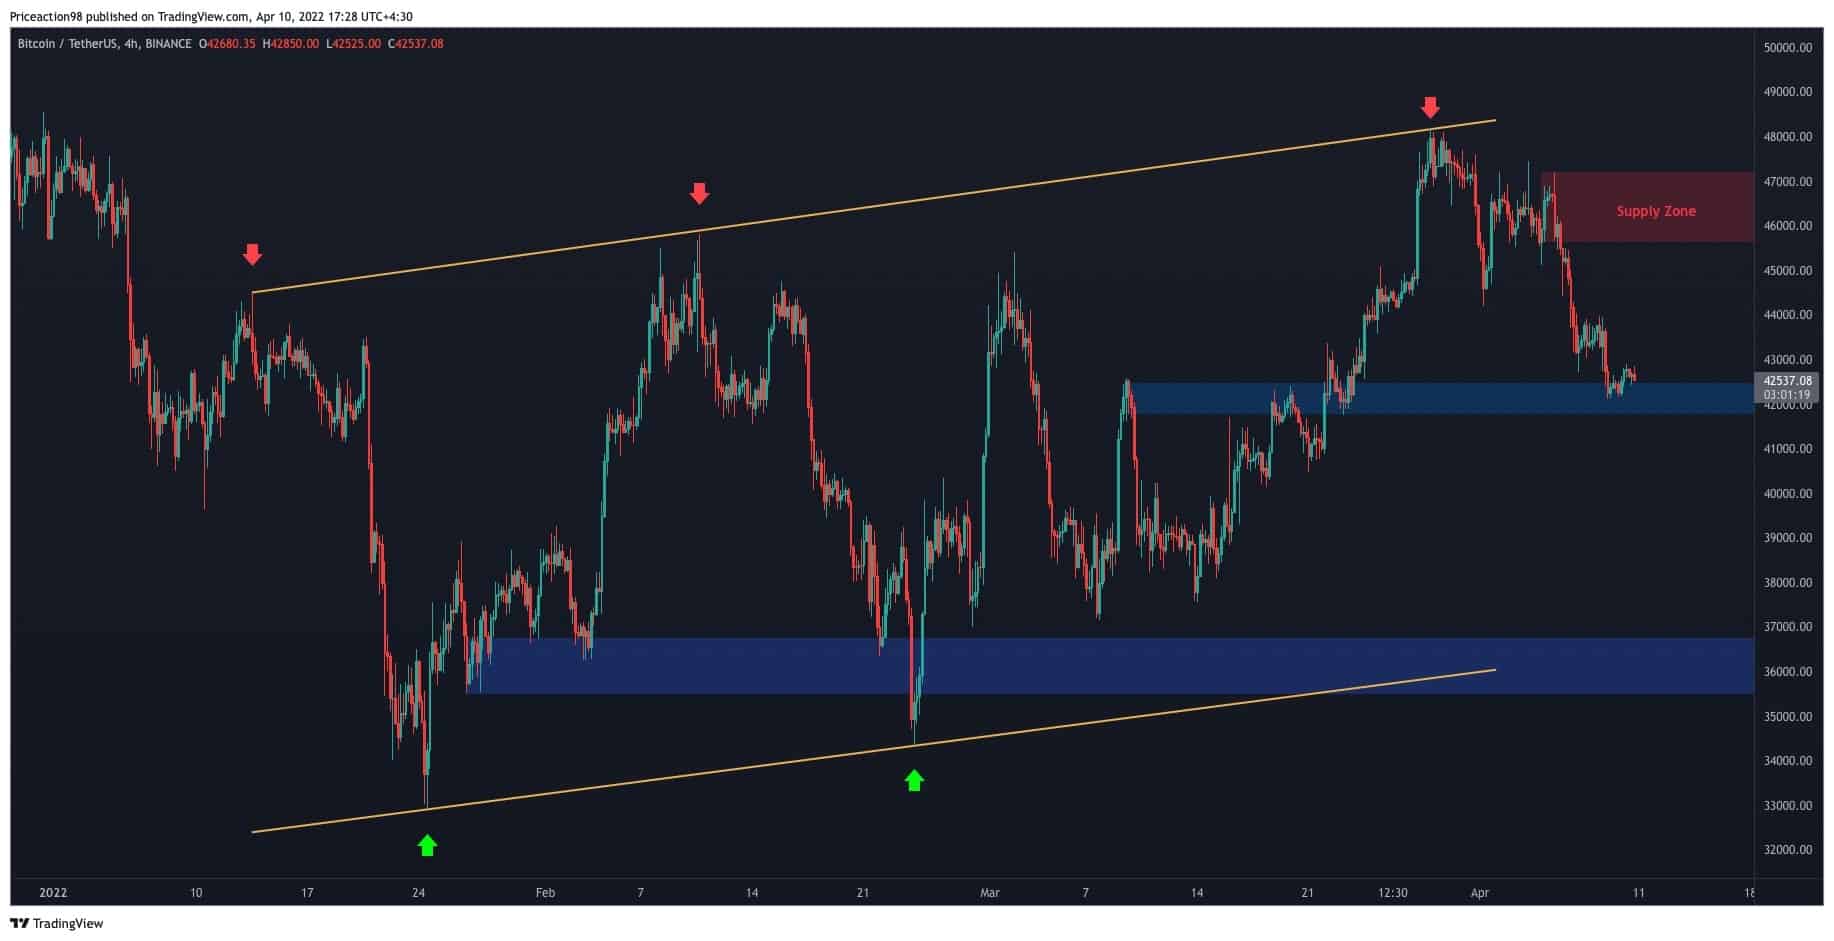
On the USDT chart, XRP is showing renewed strength after bouncing from the $2.00 support zone, which also aligns closely with the 200-day moving average.
The bullish engulfing candle formed recently confirms buyers stepping back in after weeks of sideways movement near the range lows. The price is now approaching the $2.5 mid-range resistance area, which is a key level to break before rising toward the $3 region.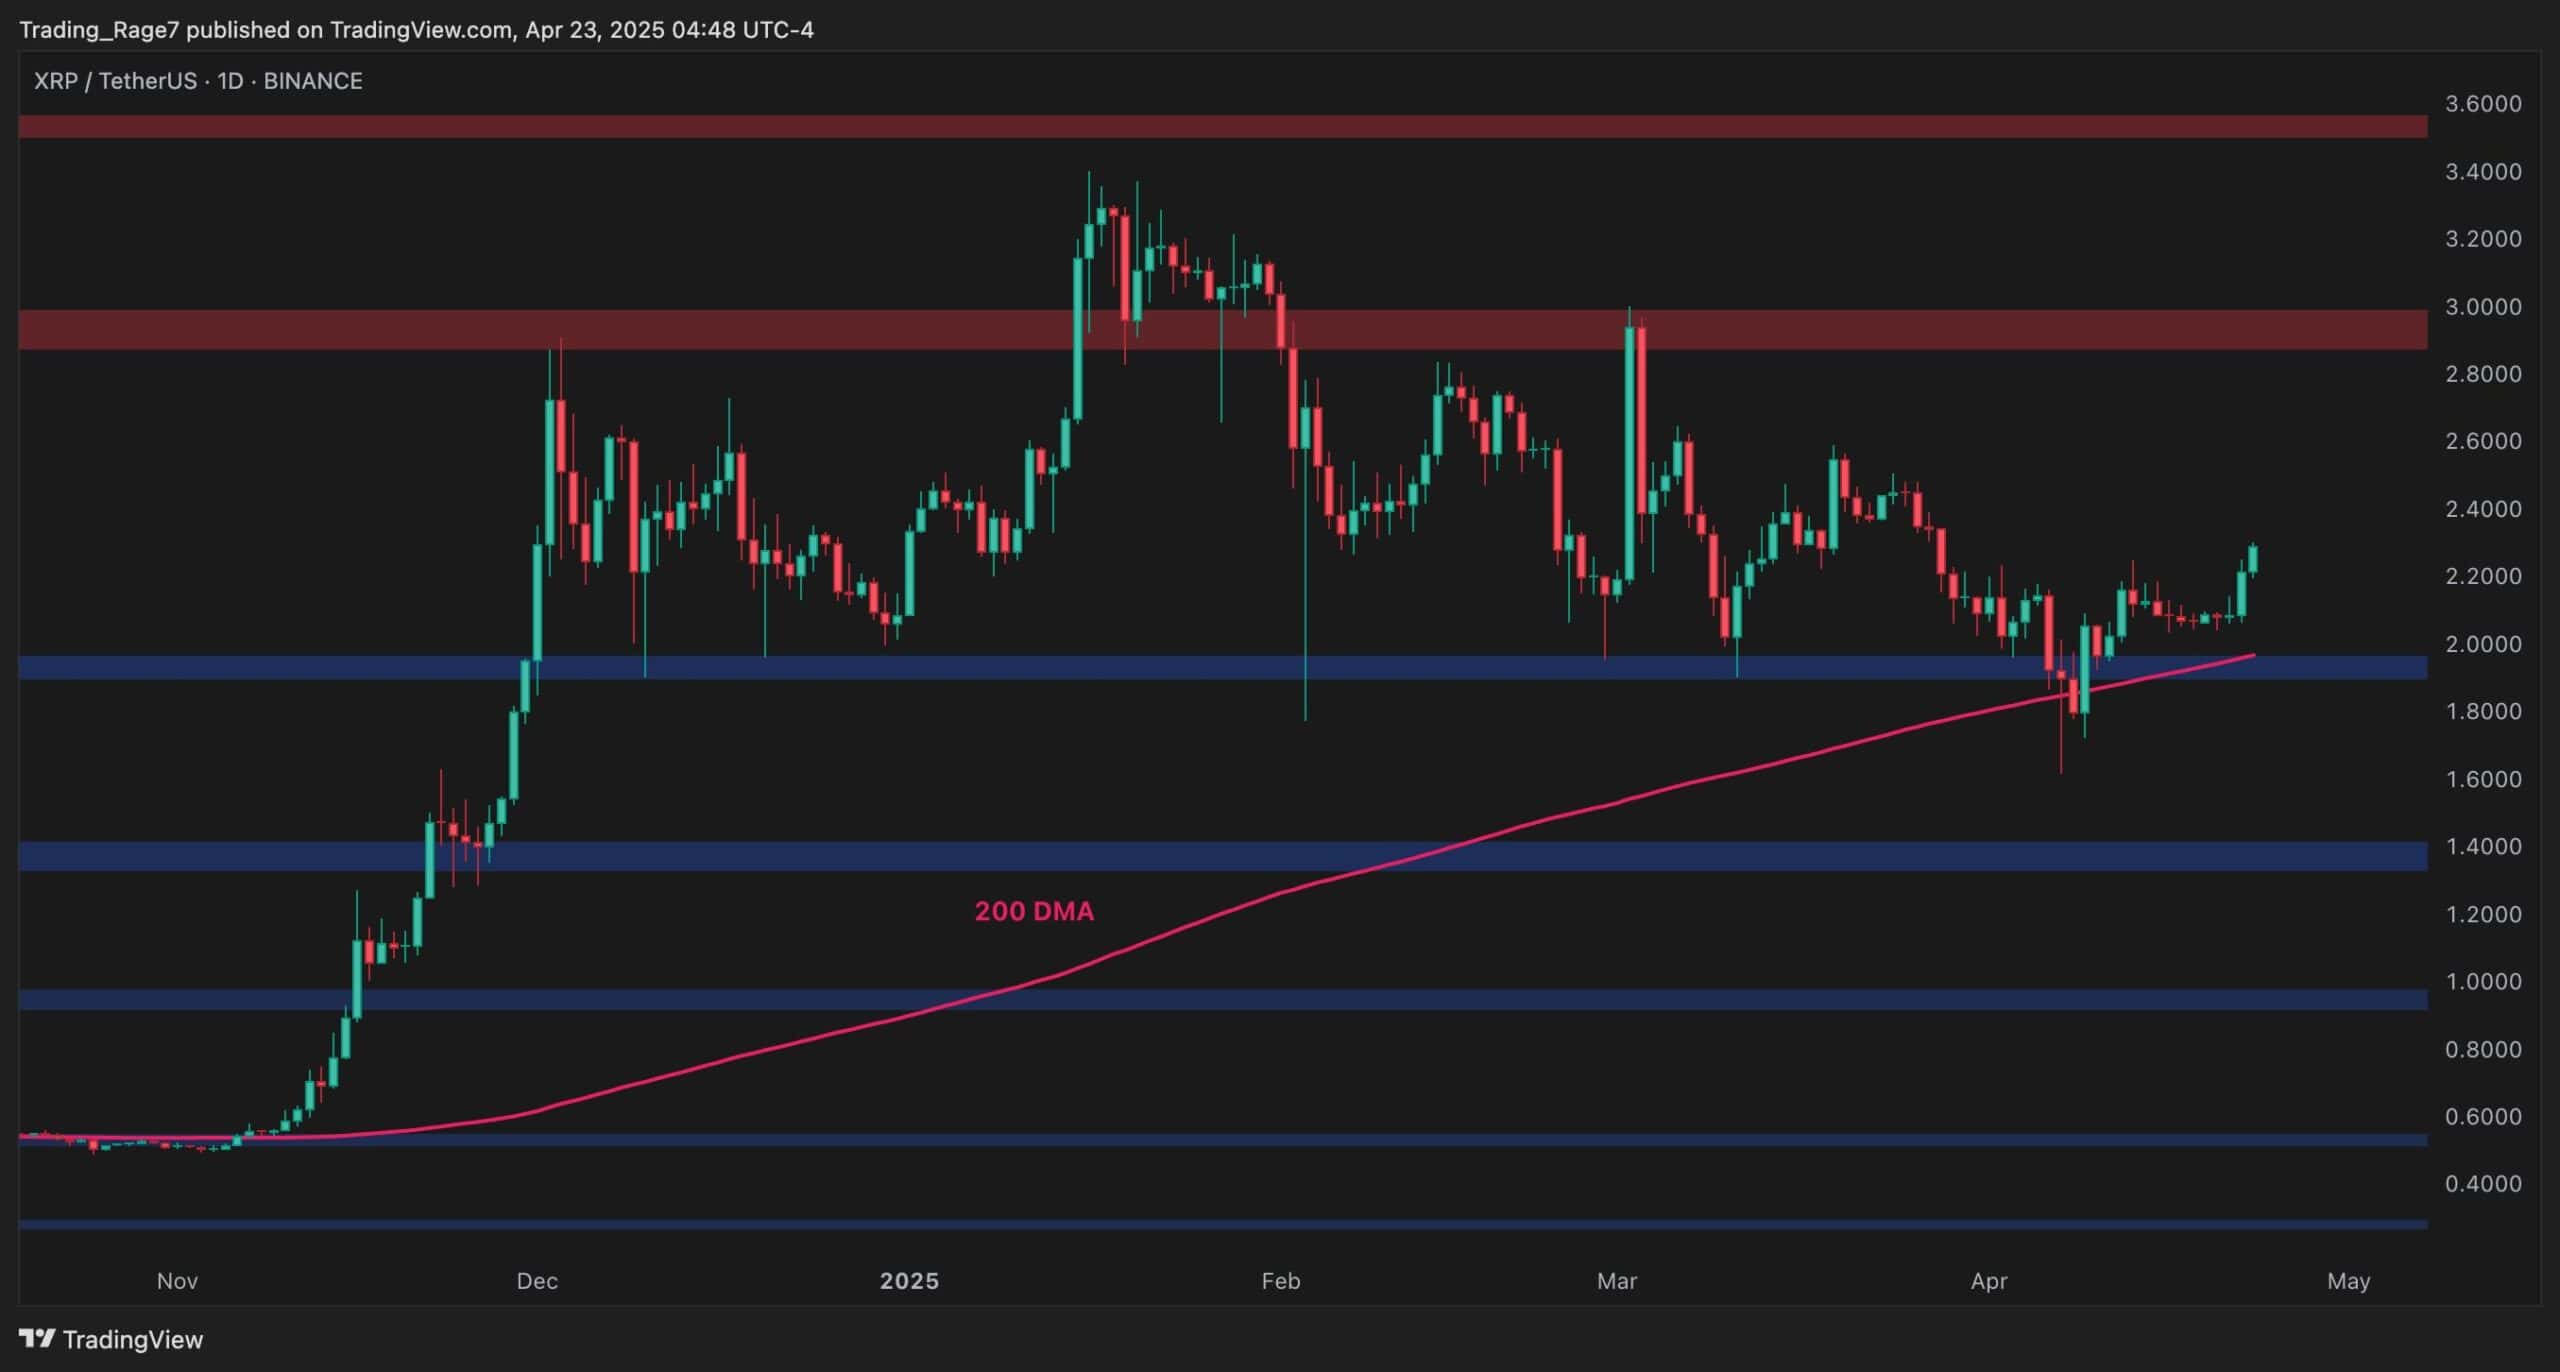
The BTC Paired Chart
The XRP/BTC pair is consolidating just above the 200-day moving average, located around the 2,100 SAT mark. Although bearish momentum has cooled down, buyers are yet to reclaim the key 2,800 SAT resistance zone. This range has capped every major rally attempt since January, and breaking above it would signal a shift in trend favoring XRP over BTC.
Traders should monitor whether the BTC pair starts to rise alongside the USDT pair, as a divergence here could limit the upside on the dollar pair rally.
The post Here’s What XRP Has to Do to Challenge $3 Again: Ripple Price Analysis appeared first on CryptoPotato.