Here’s the Next Target for Ethereum if $1,300 Holds (ETH Price Analysis)
Ethereum’s price is on the verge of breaking out from a significant resistance level after testing it for quite a while. However, there are still some obstacles for the price to overcome in order for a new bullish phase to begin.
Technical Analysis
By: Edris
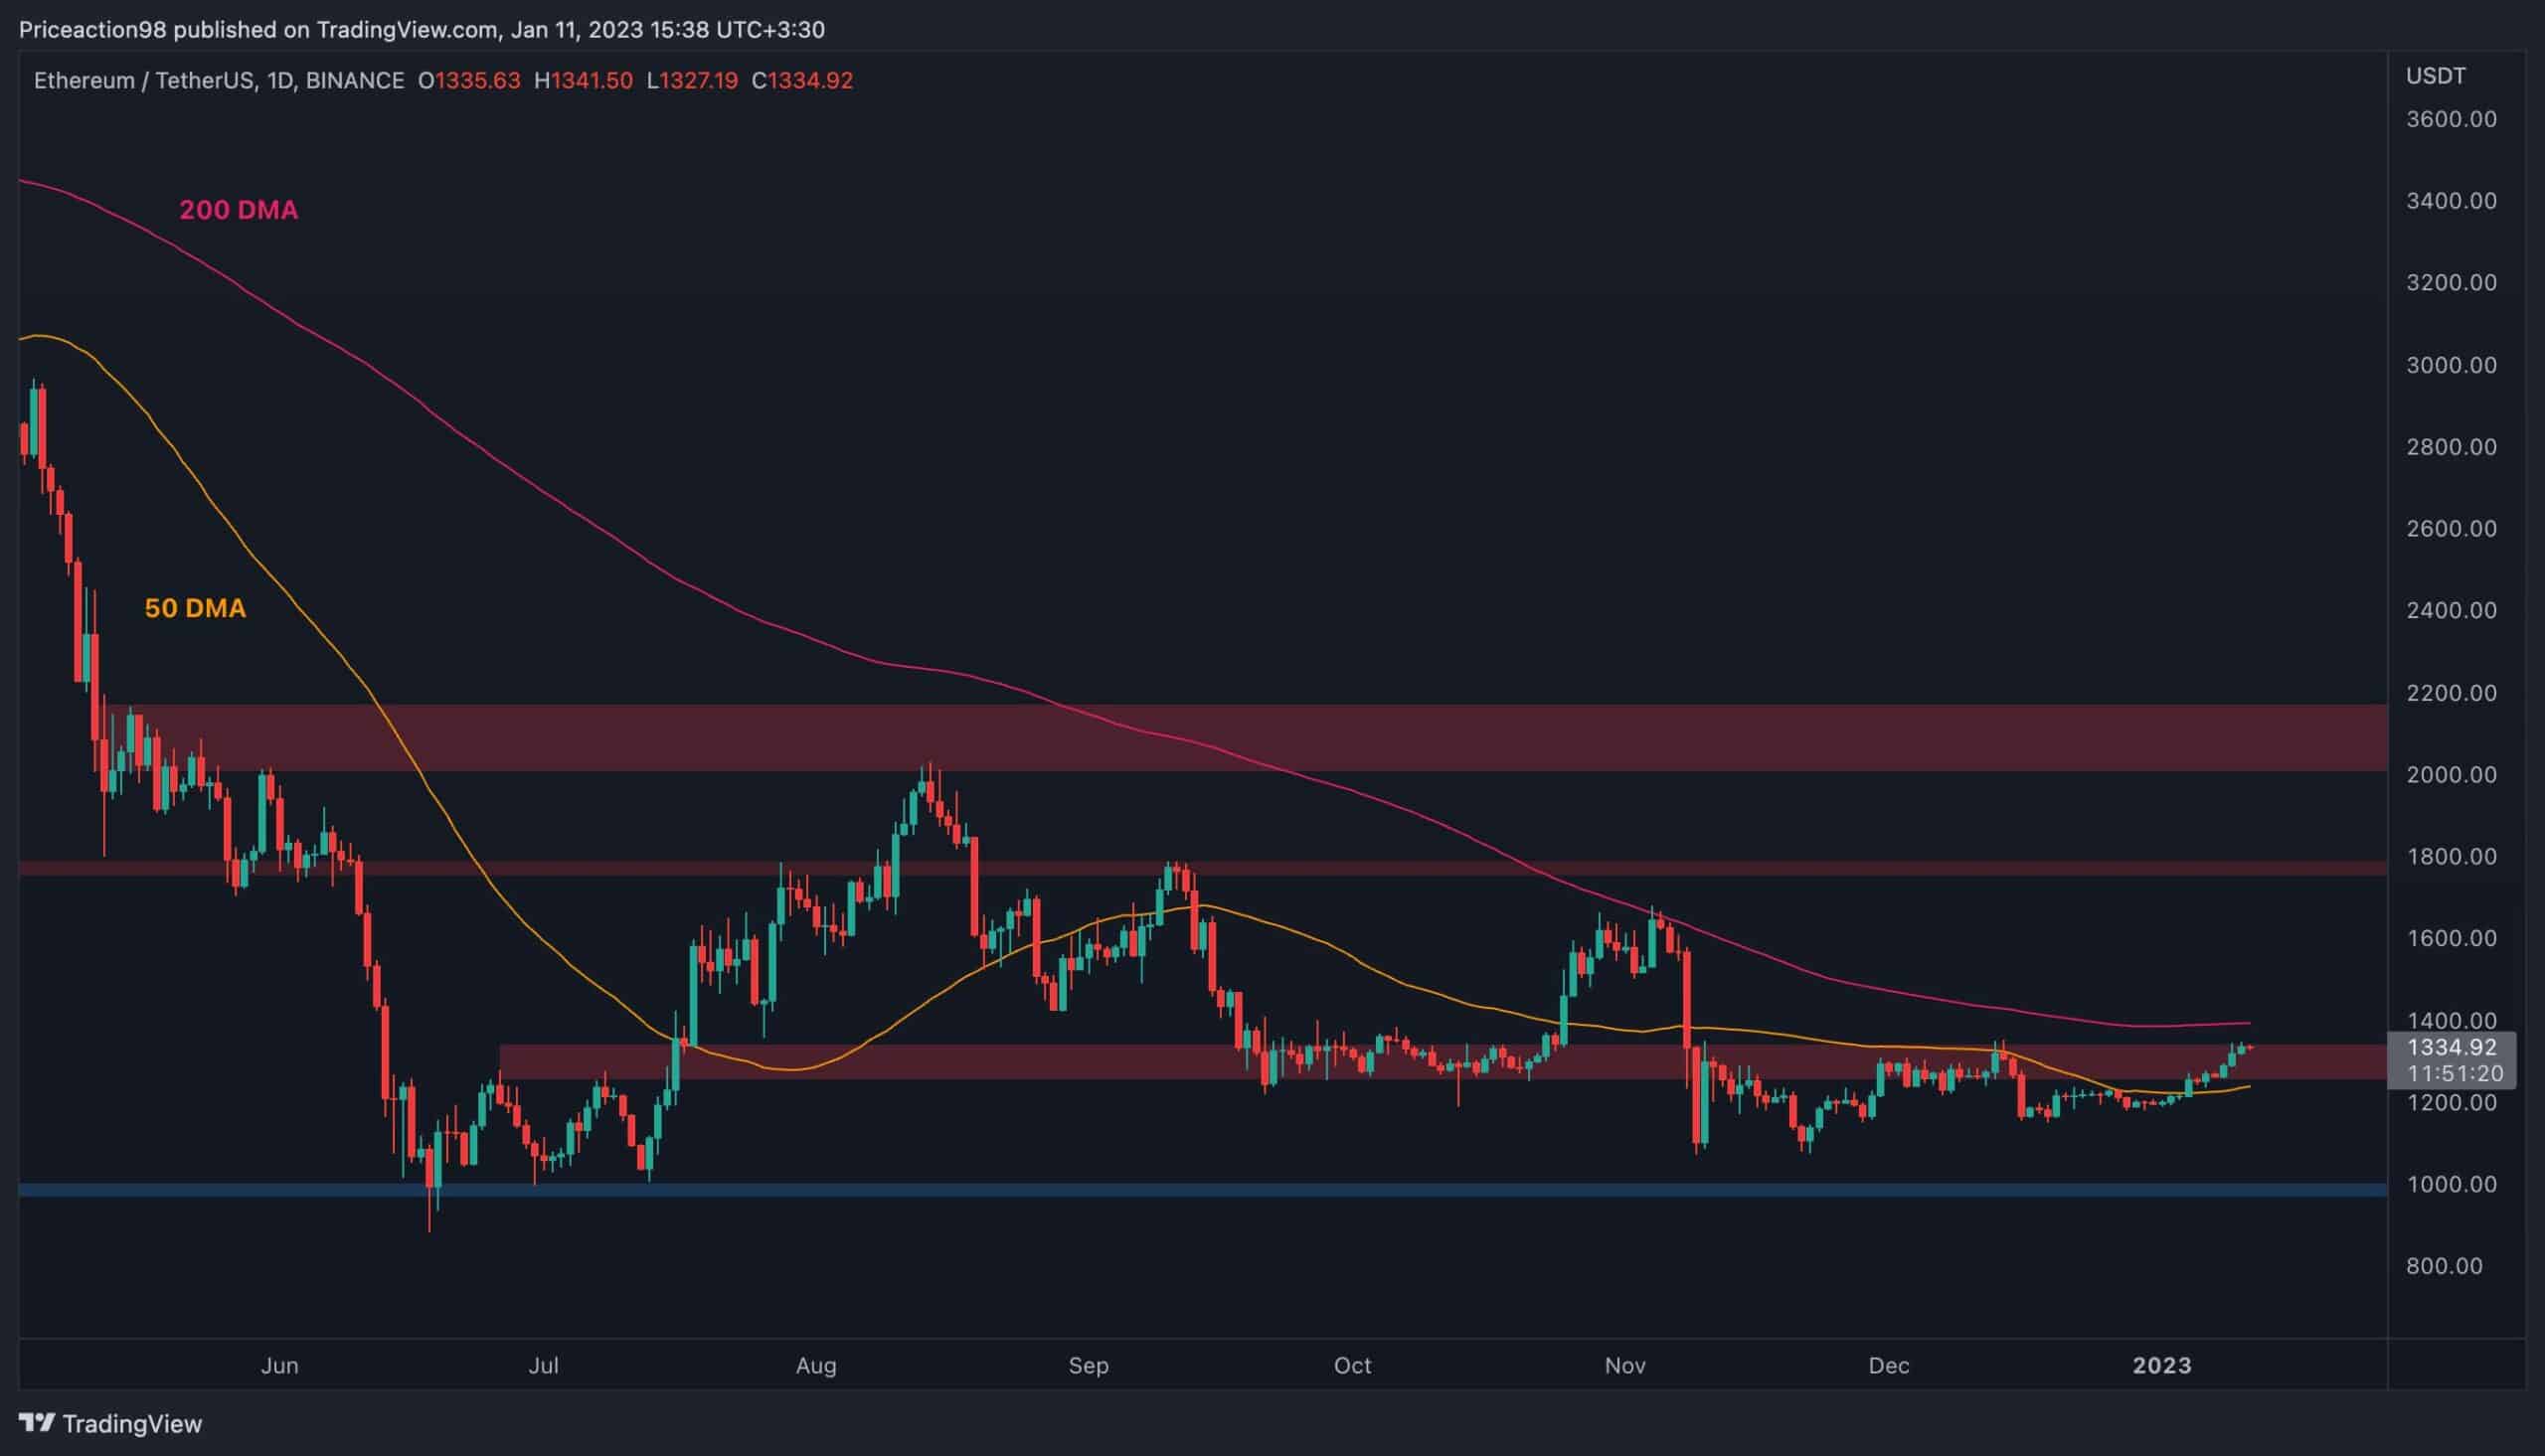
The Daily Chart
On the daily timeframe, the price is breaking above the key $1300 resistance level after finally surpassing the 50-day moving average. In case of a bullish breakout, the 200-day moving average found at around $1400 would be next in line, followed by the $1800 level.
The 200-day moving average is considered a benchmark used to indicate whether the market is in a bullish or bearish trend, and a breakout above it could potentially lead to a mid-term uptrend.
However, there is still a considerable chance for rejection, which could lead to a drop back toward the $1000 support level.
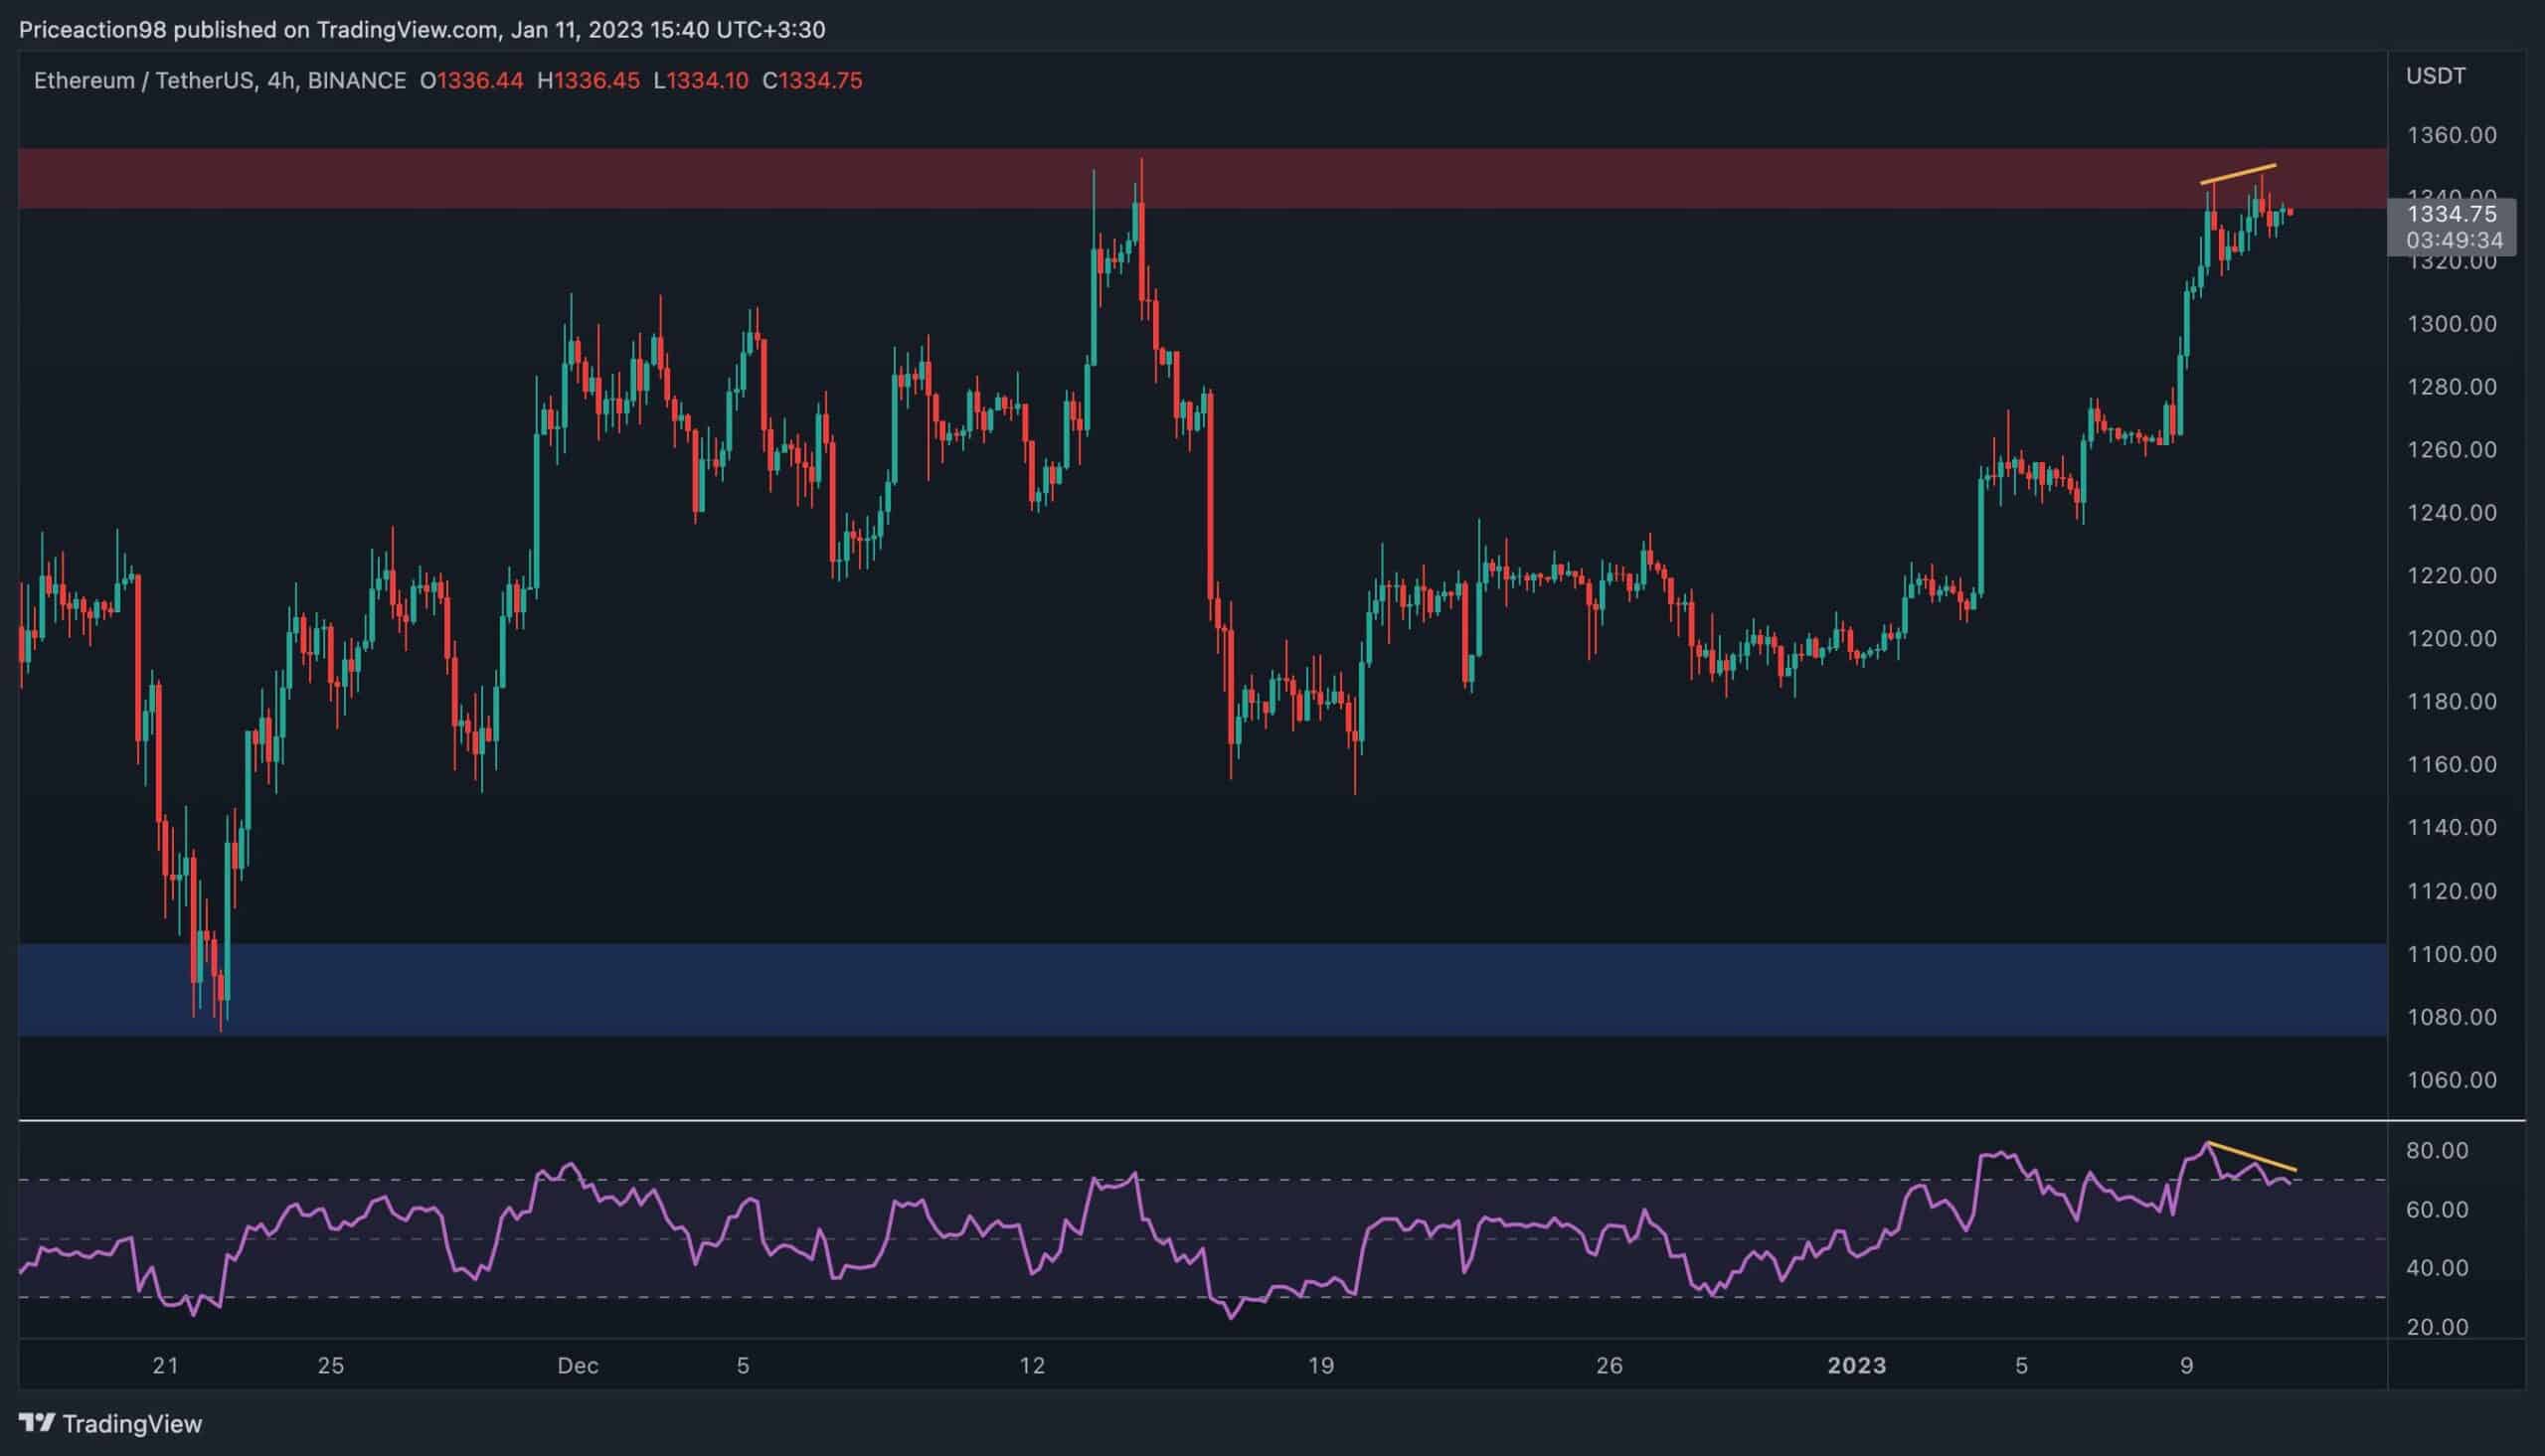
The 4-Hour Chart
Looking at the 4-hour timeframe, the momentum is seemingly fading away after a few bullish days, as the price is struggling to break above the $1350 resistance level.
The RSI indicator, which has been flashing an overbought signal for a while now, is also demonstrating a bearish divergence between the two last price highs. Therefore, there is a significant probability of a bearish pullback or even a reversal around the current level.
In the event of a reversal, a rapid decline toward the $1100 support area would be expected. The $1100 level would be the bulls’ last resort, which a breakdown from would likely lead to a massive crash and further elongation of the bear market.
Onchain Analysis
By Shayan
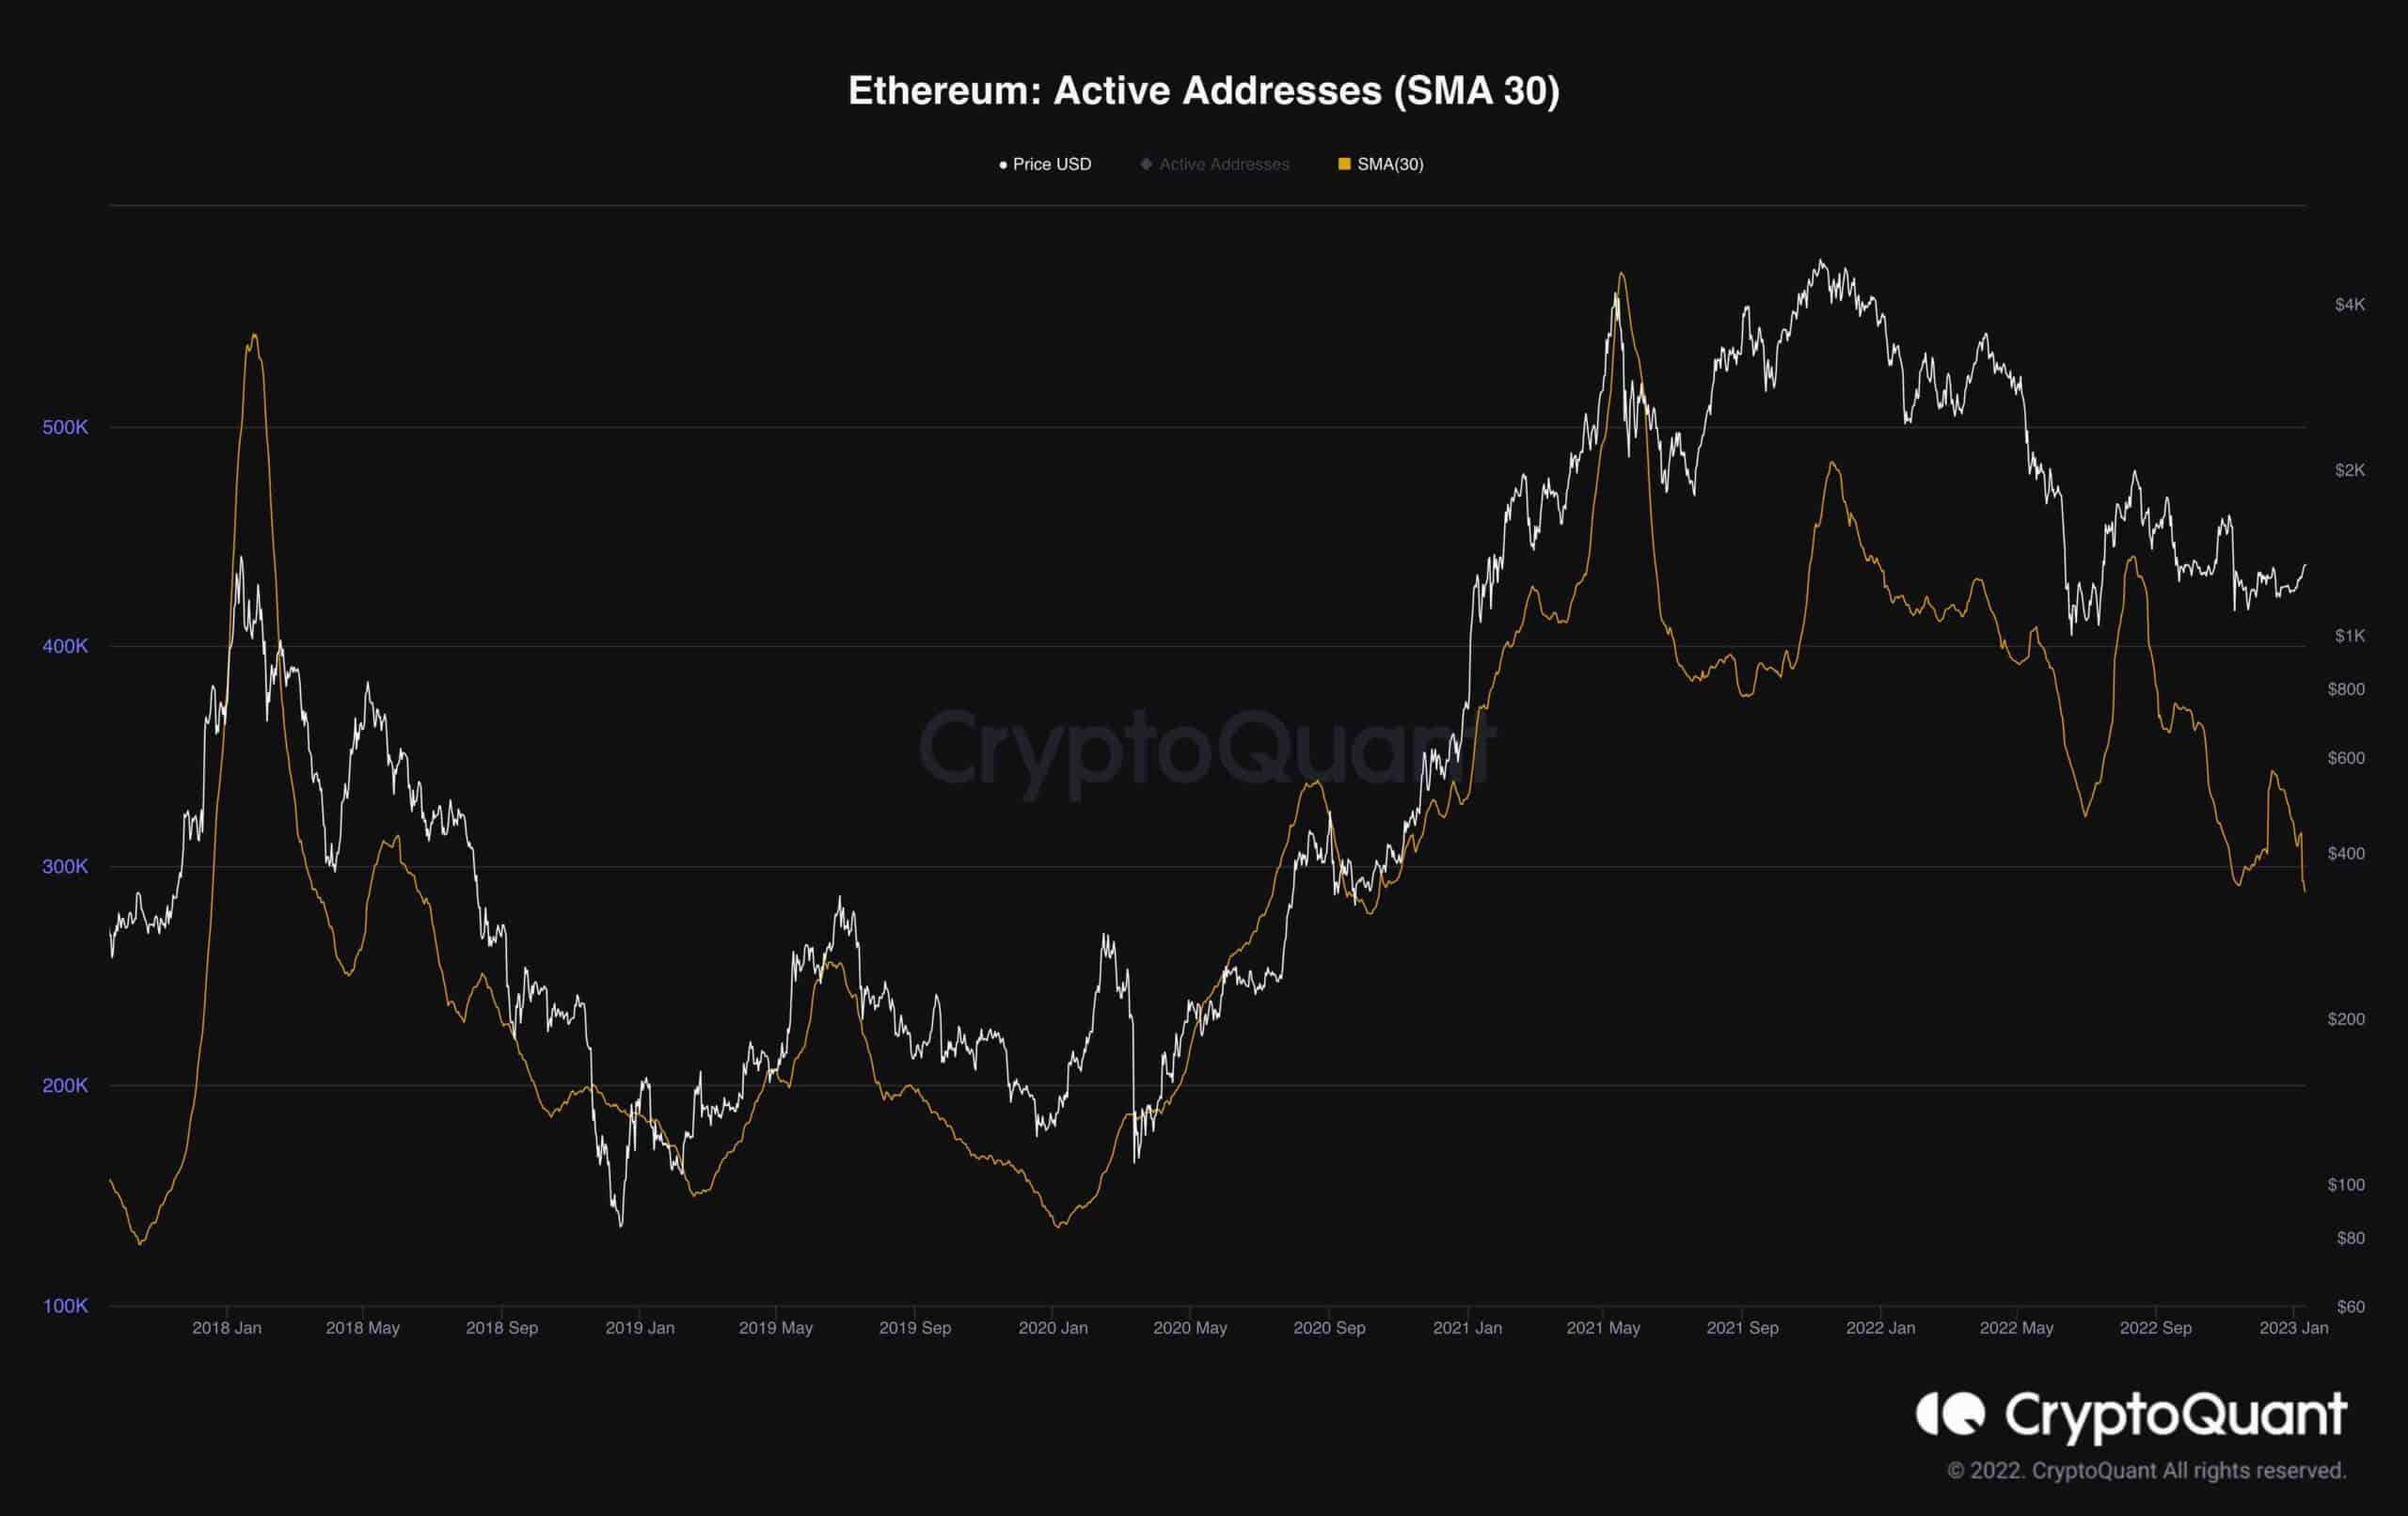
A bull market is always accompanied by an uptrend in the Active Addresses metric as more people get interested in cryptocurrencies when their prices jump significantly. Hence, the market faces higher activity, with more people sending and receiving coins.
In contrast, during the bearish stage of the market, people start to realize massive losses and leave as the prices are declining rapidly. As a result, the market faces lower activity, and the Active Addresses metric starts to plummet substantially.
The following chart demonstrates the Active Addresses metric(30-day MA) alongside ETH’s price. As is evident, the metric has been declining during the recent bearish stage of the market and has dropped to new yearly lows. This signifies a notable lack of activity and interest among market participants.
Overall, Ethereum is going through a significant capitulation state, and the next bull market won’t be anticipated unless the capitulation is over.
The post Here’s the Next Target for Ethereum if $1,300 Holds (ETH Price Analysis) appeared first on CryptoPotato.