Here’s the First Support in Case BTC Corrects Following the Surge Above $52K (Bitcoin Price Analysis)
After experiencing heightened buying pressure and a robust surge, Bitcoin’s price has breached a significant resistance region, notably the psychological threshold of $50K and the upper boundary of the multi-month ascending channel.
This signals a notable bull market, with investors eyeing the possibility of Bitcoin reaching new all-time highs in 2024.
Technical Analysis
By Shayan
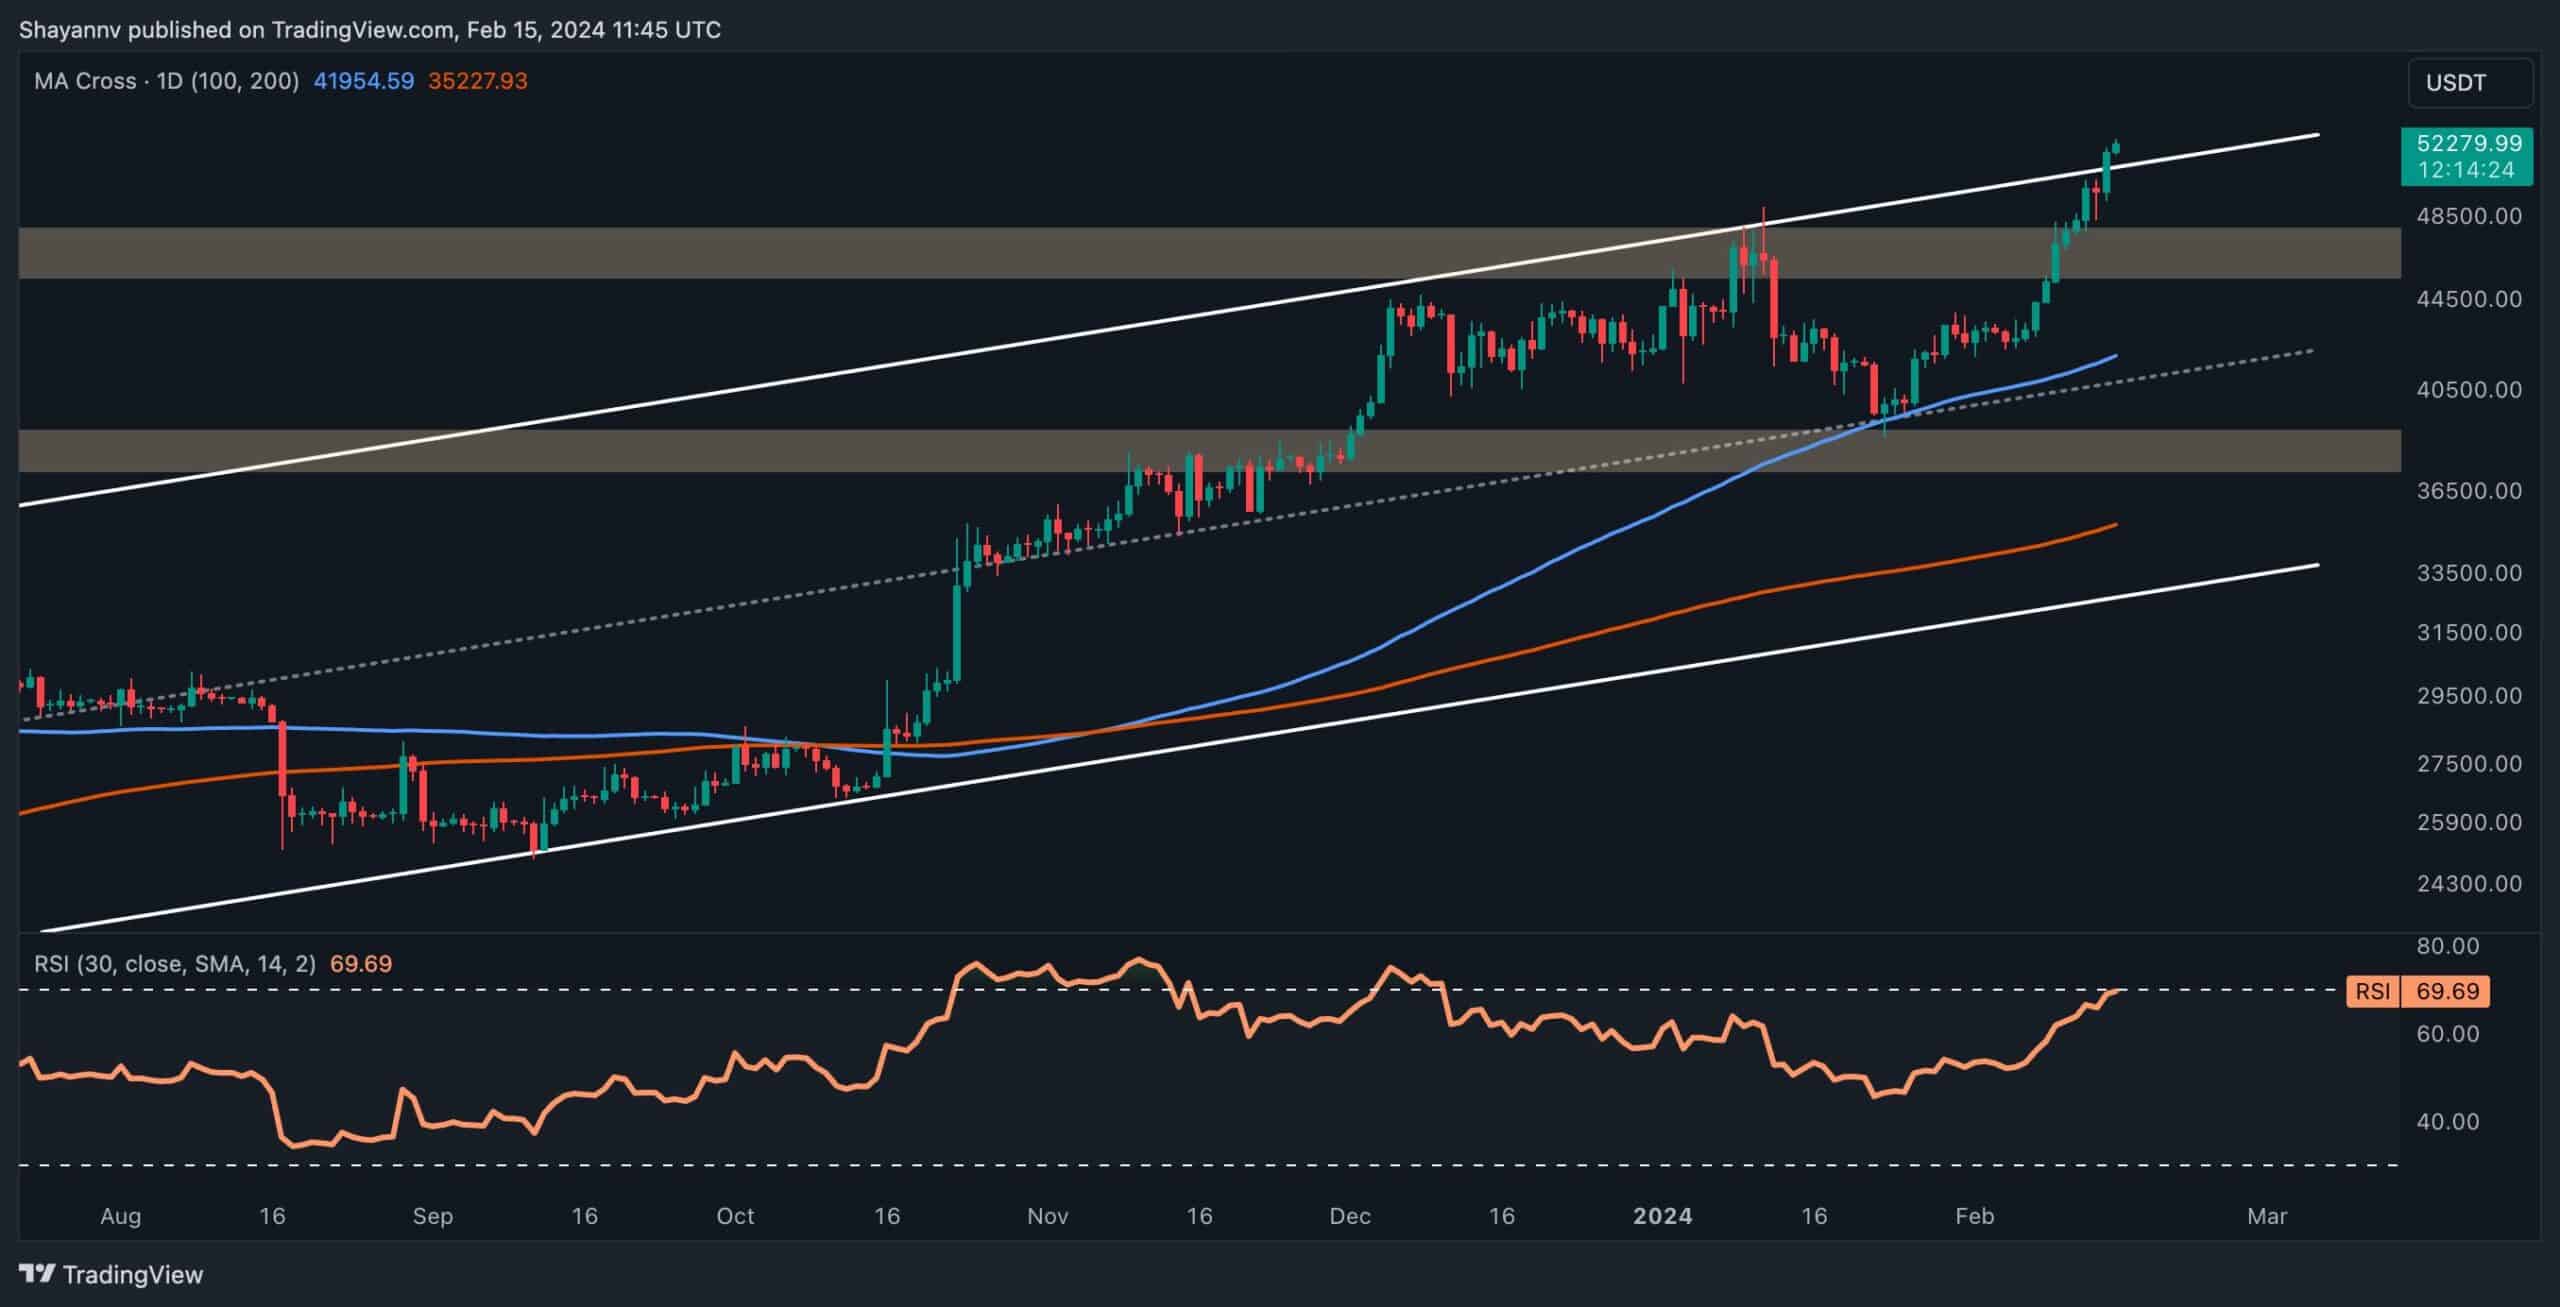
The Daily Chart
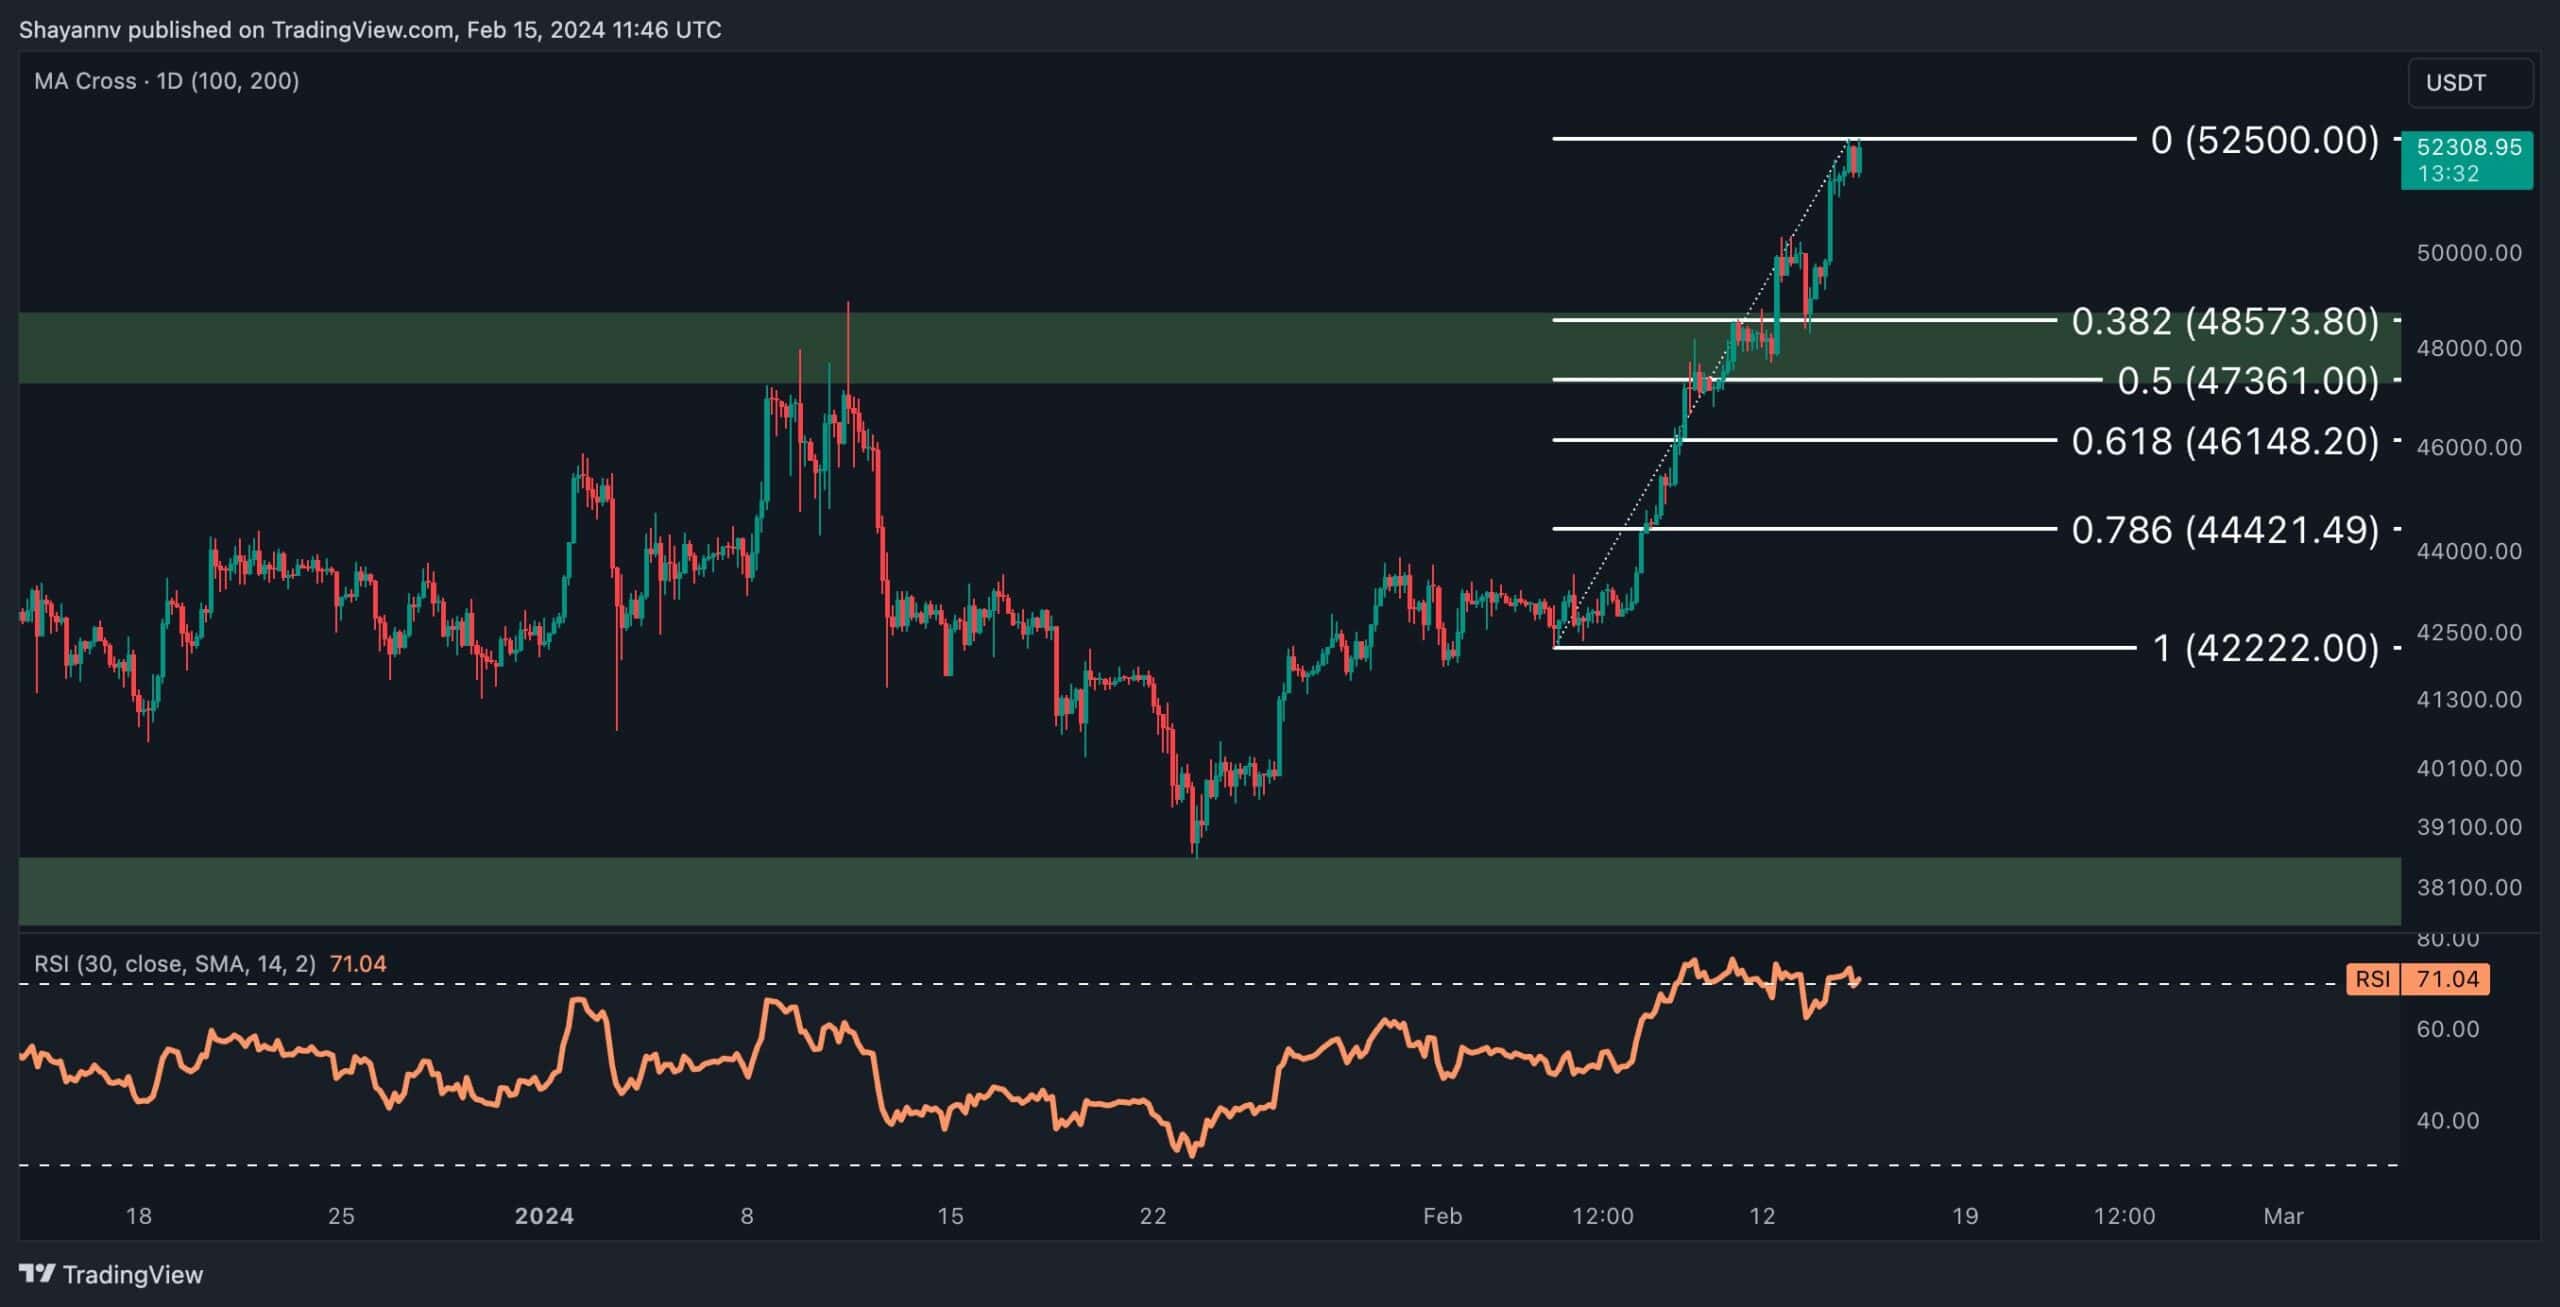
Upon careful examination of the daily chart, it’s clear that Bitcoin’s price has embarked on a remarkable, bullish surge, successfully reclaiming the substantial $50K resistance region and surpassing the upper boundary of a long-standing ascending channel.
This indicates a prevailing bullish sentiment among market participants, with anticipation mounting for Bitcoin to set new records in the year ahead.
However, as is typical of healthy market dynamics, periods of corrective movements are necessary following impulsive trends. Therefore, it’s expected that Bitcoin will undergo a corrective phase soon, allowing investors to realize profits and providing the market with an opportunity to consolidate.
This corrective phase will likely lead to a successful pullback to the previously breached resistance levels, paving the way for a new bullish trend targeting higher price thresholds.
The 4-Hour Chart
An analysis of the 4-hour chart reveals a notable bullish reversal driven by increased buying pressure, propelling the Bitcoin price above the significant resistance level of $50K, which also corresponds with a previous swing high.
However, in anticipation of a successful pullback to the breached level, renewed demand is expected to flood the market, fueling another significant bullish movement. Nonetheless, considering the recent impulsive surge, a short-term corrective retracement, resulting in a pullback to the $50K threshold, may precede the next upward surge toward the $58K resistance level.
In such a scenario, the correction target would likely be near the crucial support range, confined between the 0.5 ($47,361) and 0.618 ($46,148) levels of the Fibonacci retracement.
On-chain Analysis
By Shayan
Bitcoin’s recent rapid price surge has left investors optimistic about the emergence of a significant bull market. However, delving into on-chain metrics can offer valuable insights into the market’s actual trajectory.
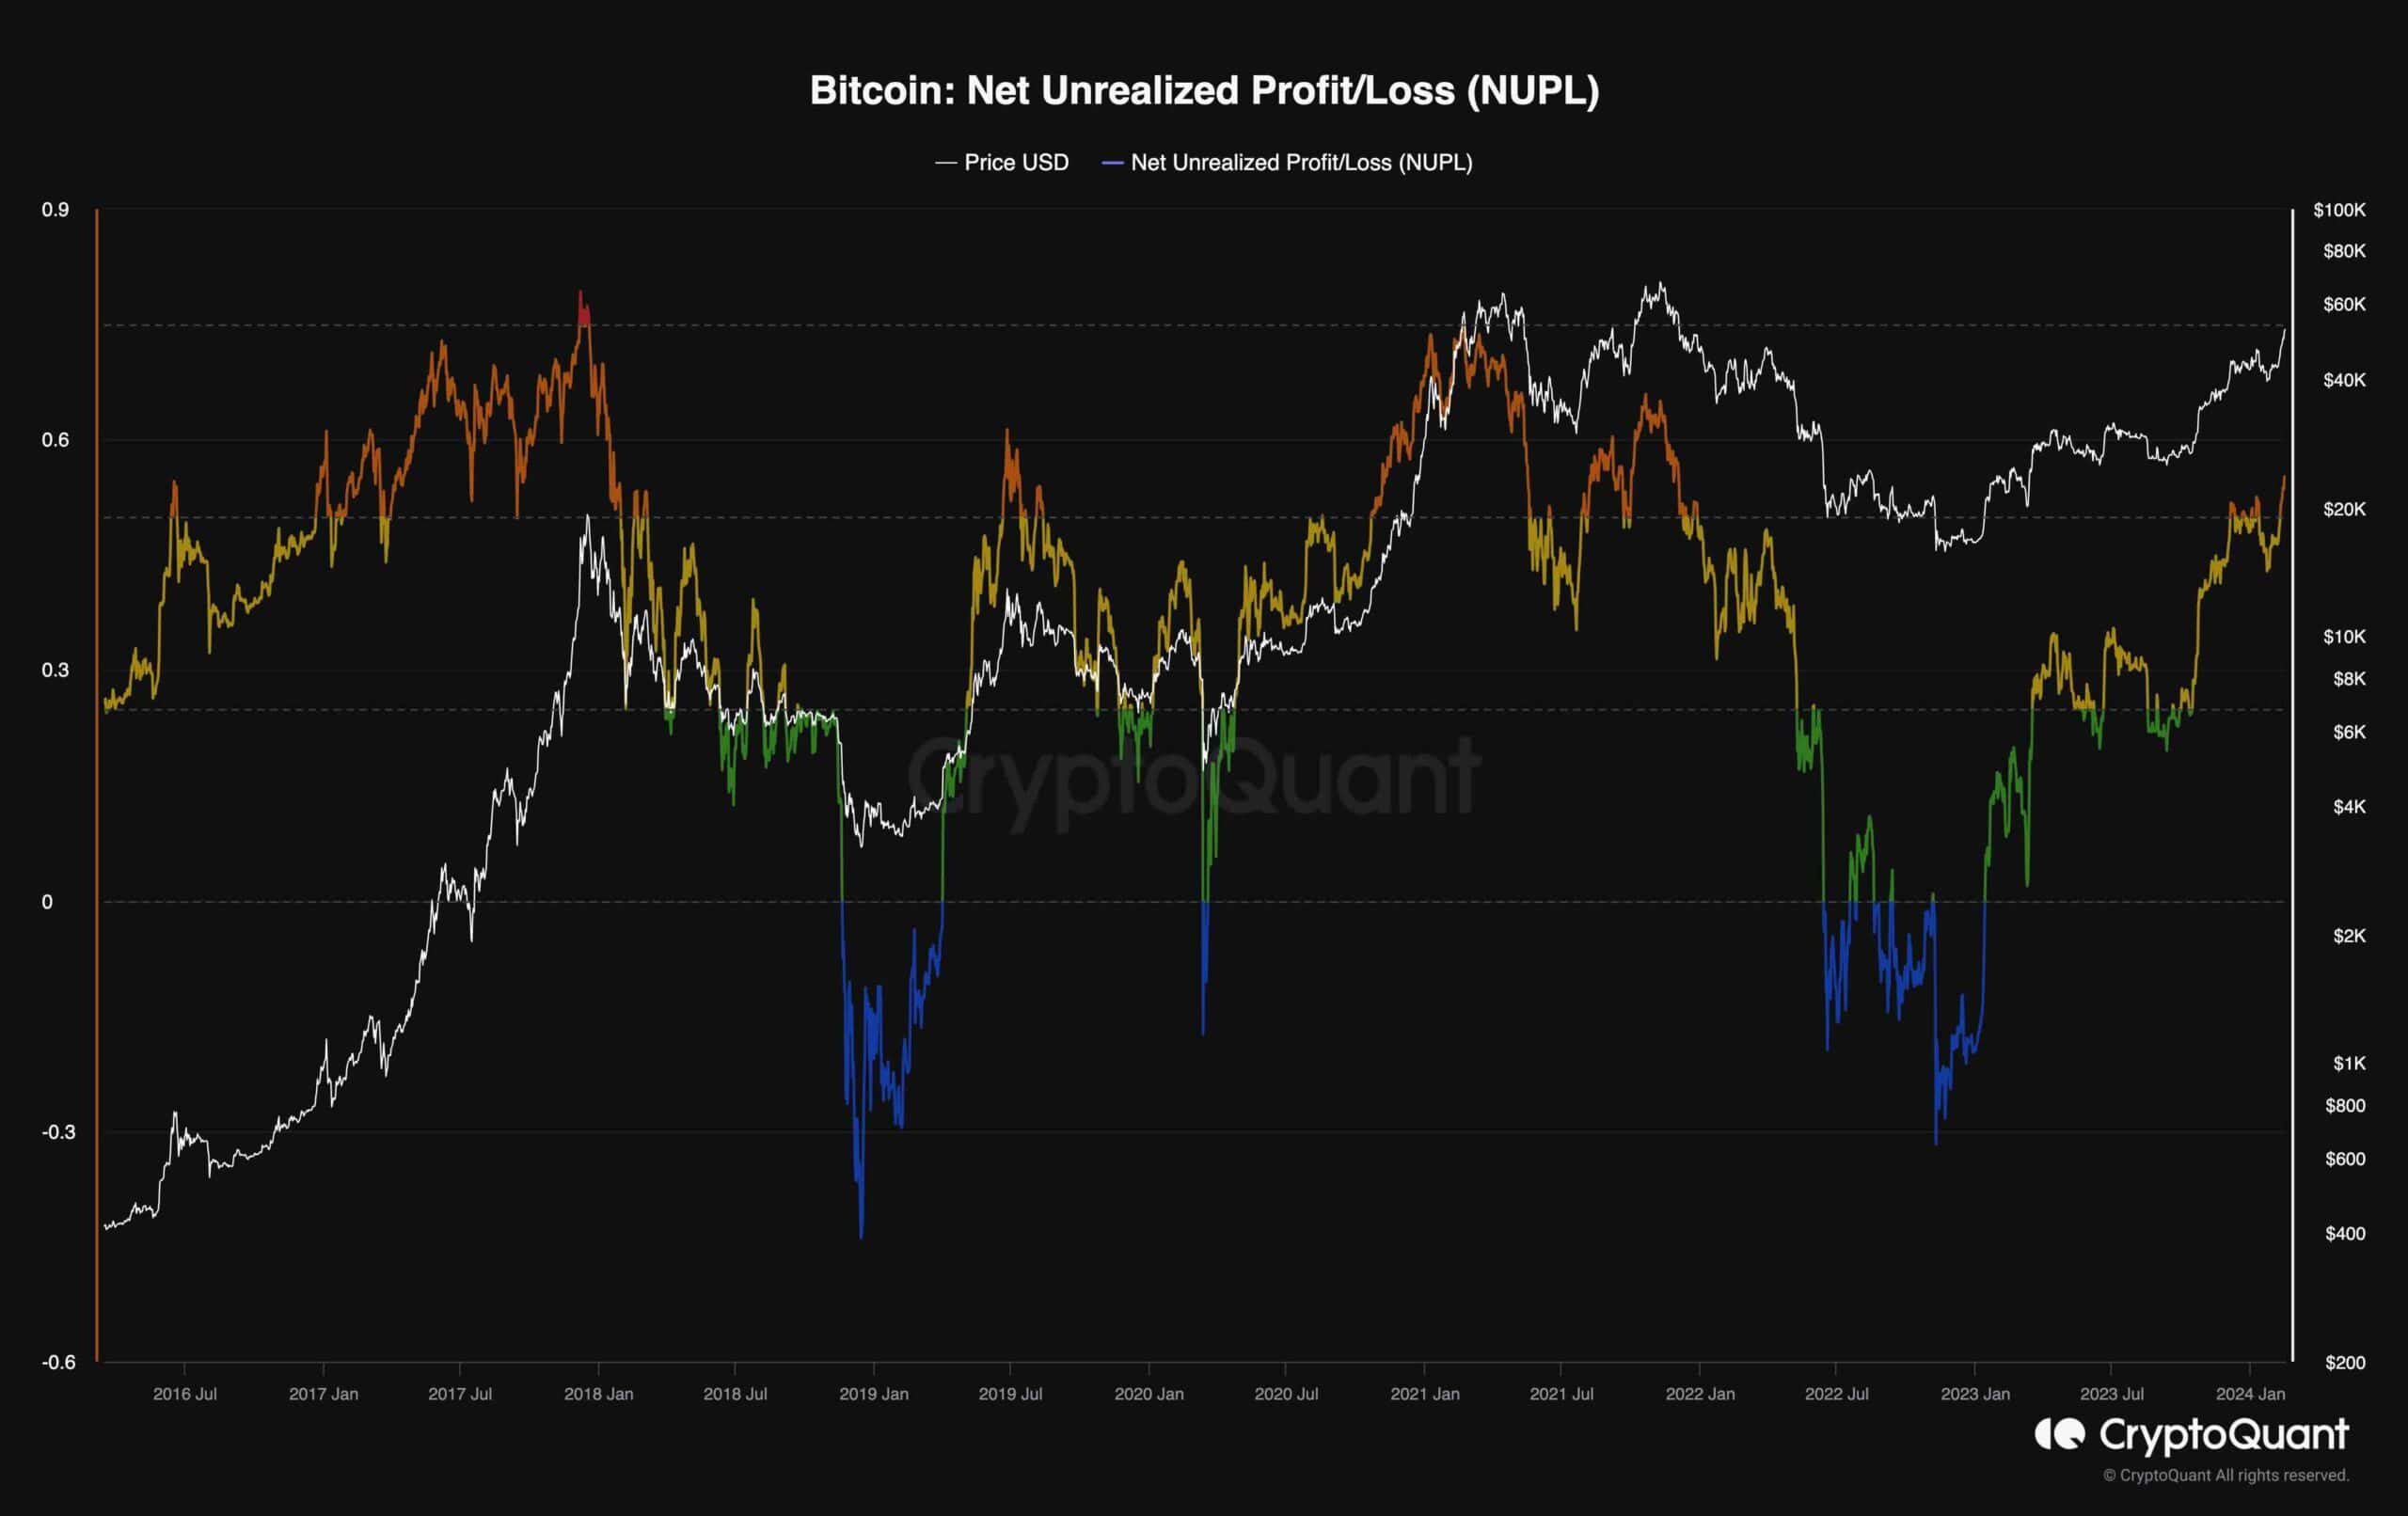
The following chart showcases the net unrealized profit/loss (NUPL) metric, which gauges the collective unrealized profits or losses of all market participants. Following the recent price surge, it’s evident that a considerable number of investors are now holding their coins in profit. This typically aligns with the characteristics of a bull market. However, it’s noteworthy that the metric has entered the orange region, historically associated with a robust bull market.
While this may suggest favorable conditions, it also raises concerns about potential profit realization by investors. Such actions could flood the market with additional supply, exerting downward pressure on prices and potentially leading to a short-term correction. Consequently, while Bitcoin may be on the path to achieving new all-time highs, it’s prudent for investors to exercise caution, as a correction may be imminent in the near term.
The post Here’s the First Support in Case BTC Corrects Following the Surge Above $52K (Bitcoin Price Analysis) appeared first on CryptoPotato.