Here Are Two Possible Outcomes for Bitcoin This Week: BTC Price Analysis
Bitcoin’s price is currently situated in a critical area, and its reaction in the next few days will likely determine the market’s direction in the coming weeks.
Technical Analysis
By Edris
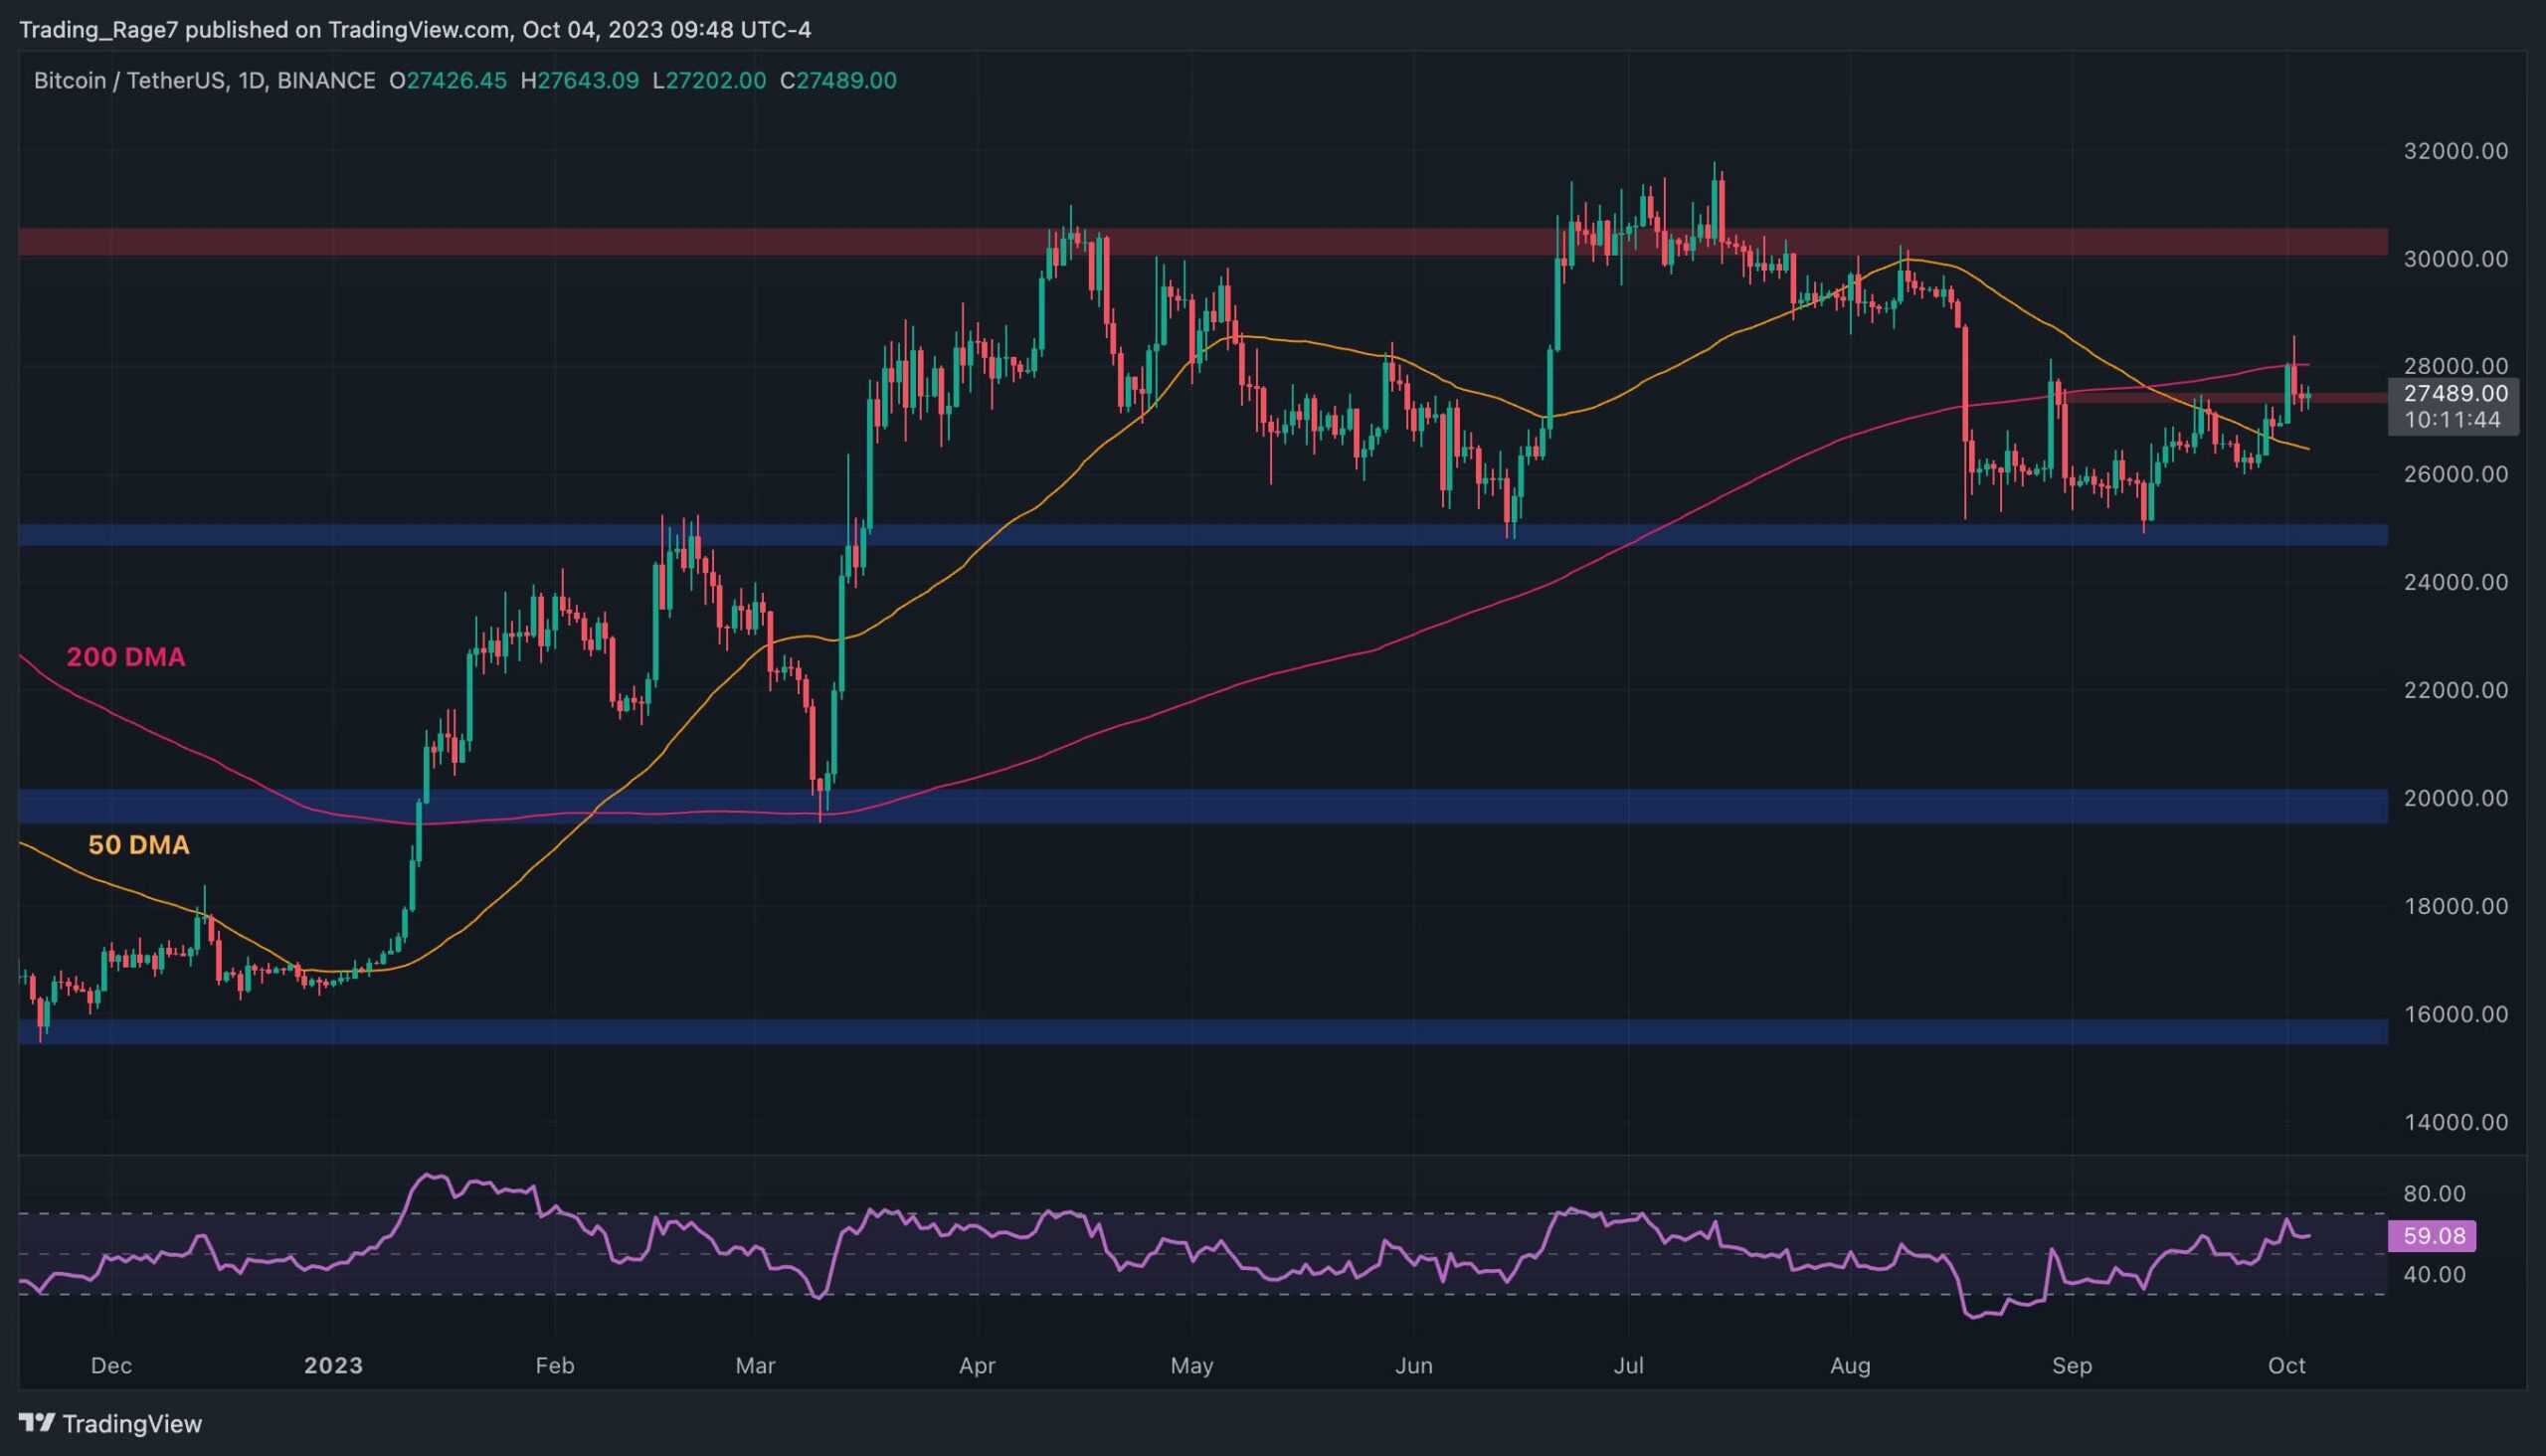
The Daily Chart
The price has recently surpassed the $27,500 resistance level on the daily timeframe after breaking above the 50-day moving average around the $26K mark. However, the price has been rejected by the 200-day moving average near the $28K level, leading to a pullback to the broken $27,500 level.
If this level holds and the market rises above the 200-day moving average, a rally toward $30K and beyond becomes highly probable. However, failing to do so could result in a potential crash towards the $20K support zone.
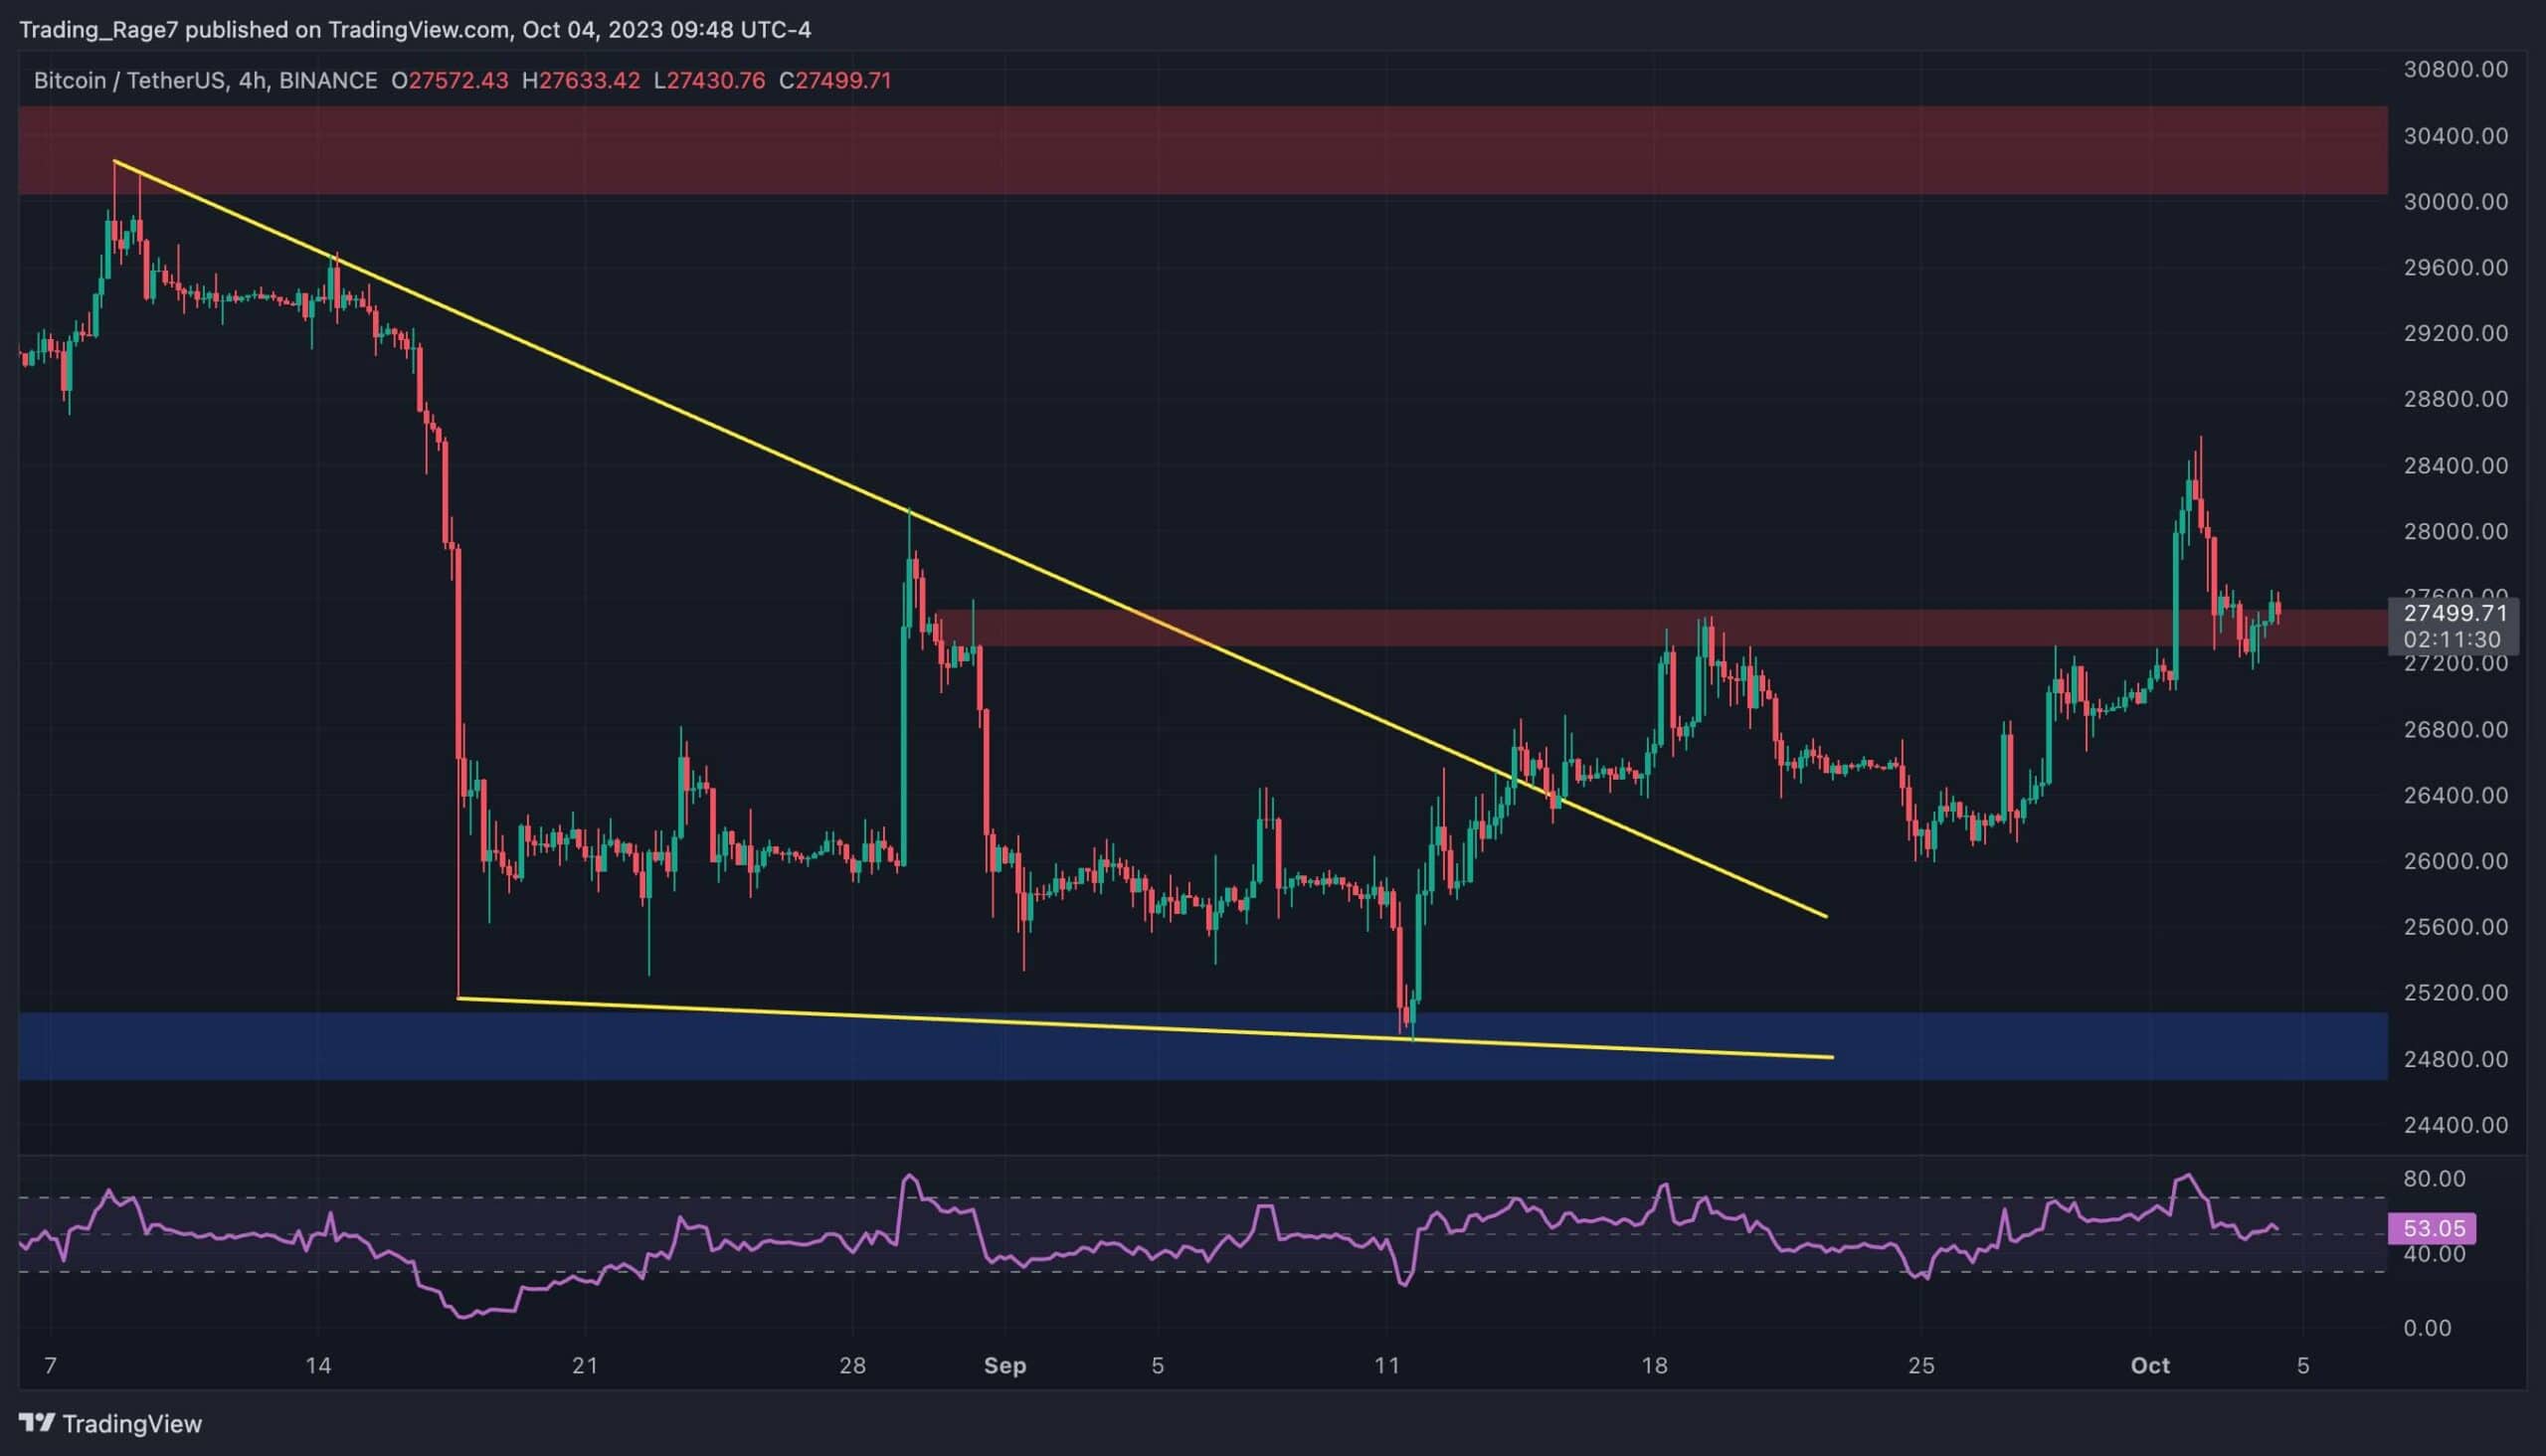
The 4-Hour Chart
Examining the 4-hour chart provides further clarity on recent price action. Since breaking out from the large falling wedge pattern, the price has been climbing higher, surpassing the $27,500 resistance level.
However, it is currently retesting this level, and if the pullback is valid, the market may be preparing to rally towards $30K. Conversely, if the pullback fails, the recent move would be considered a false breakout and could lead to a rapid drop towards $25K and below.
On-Chain Analysis
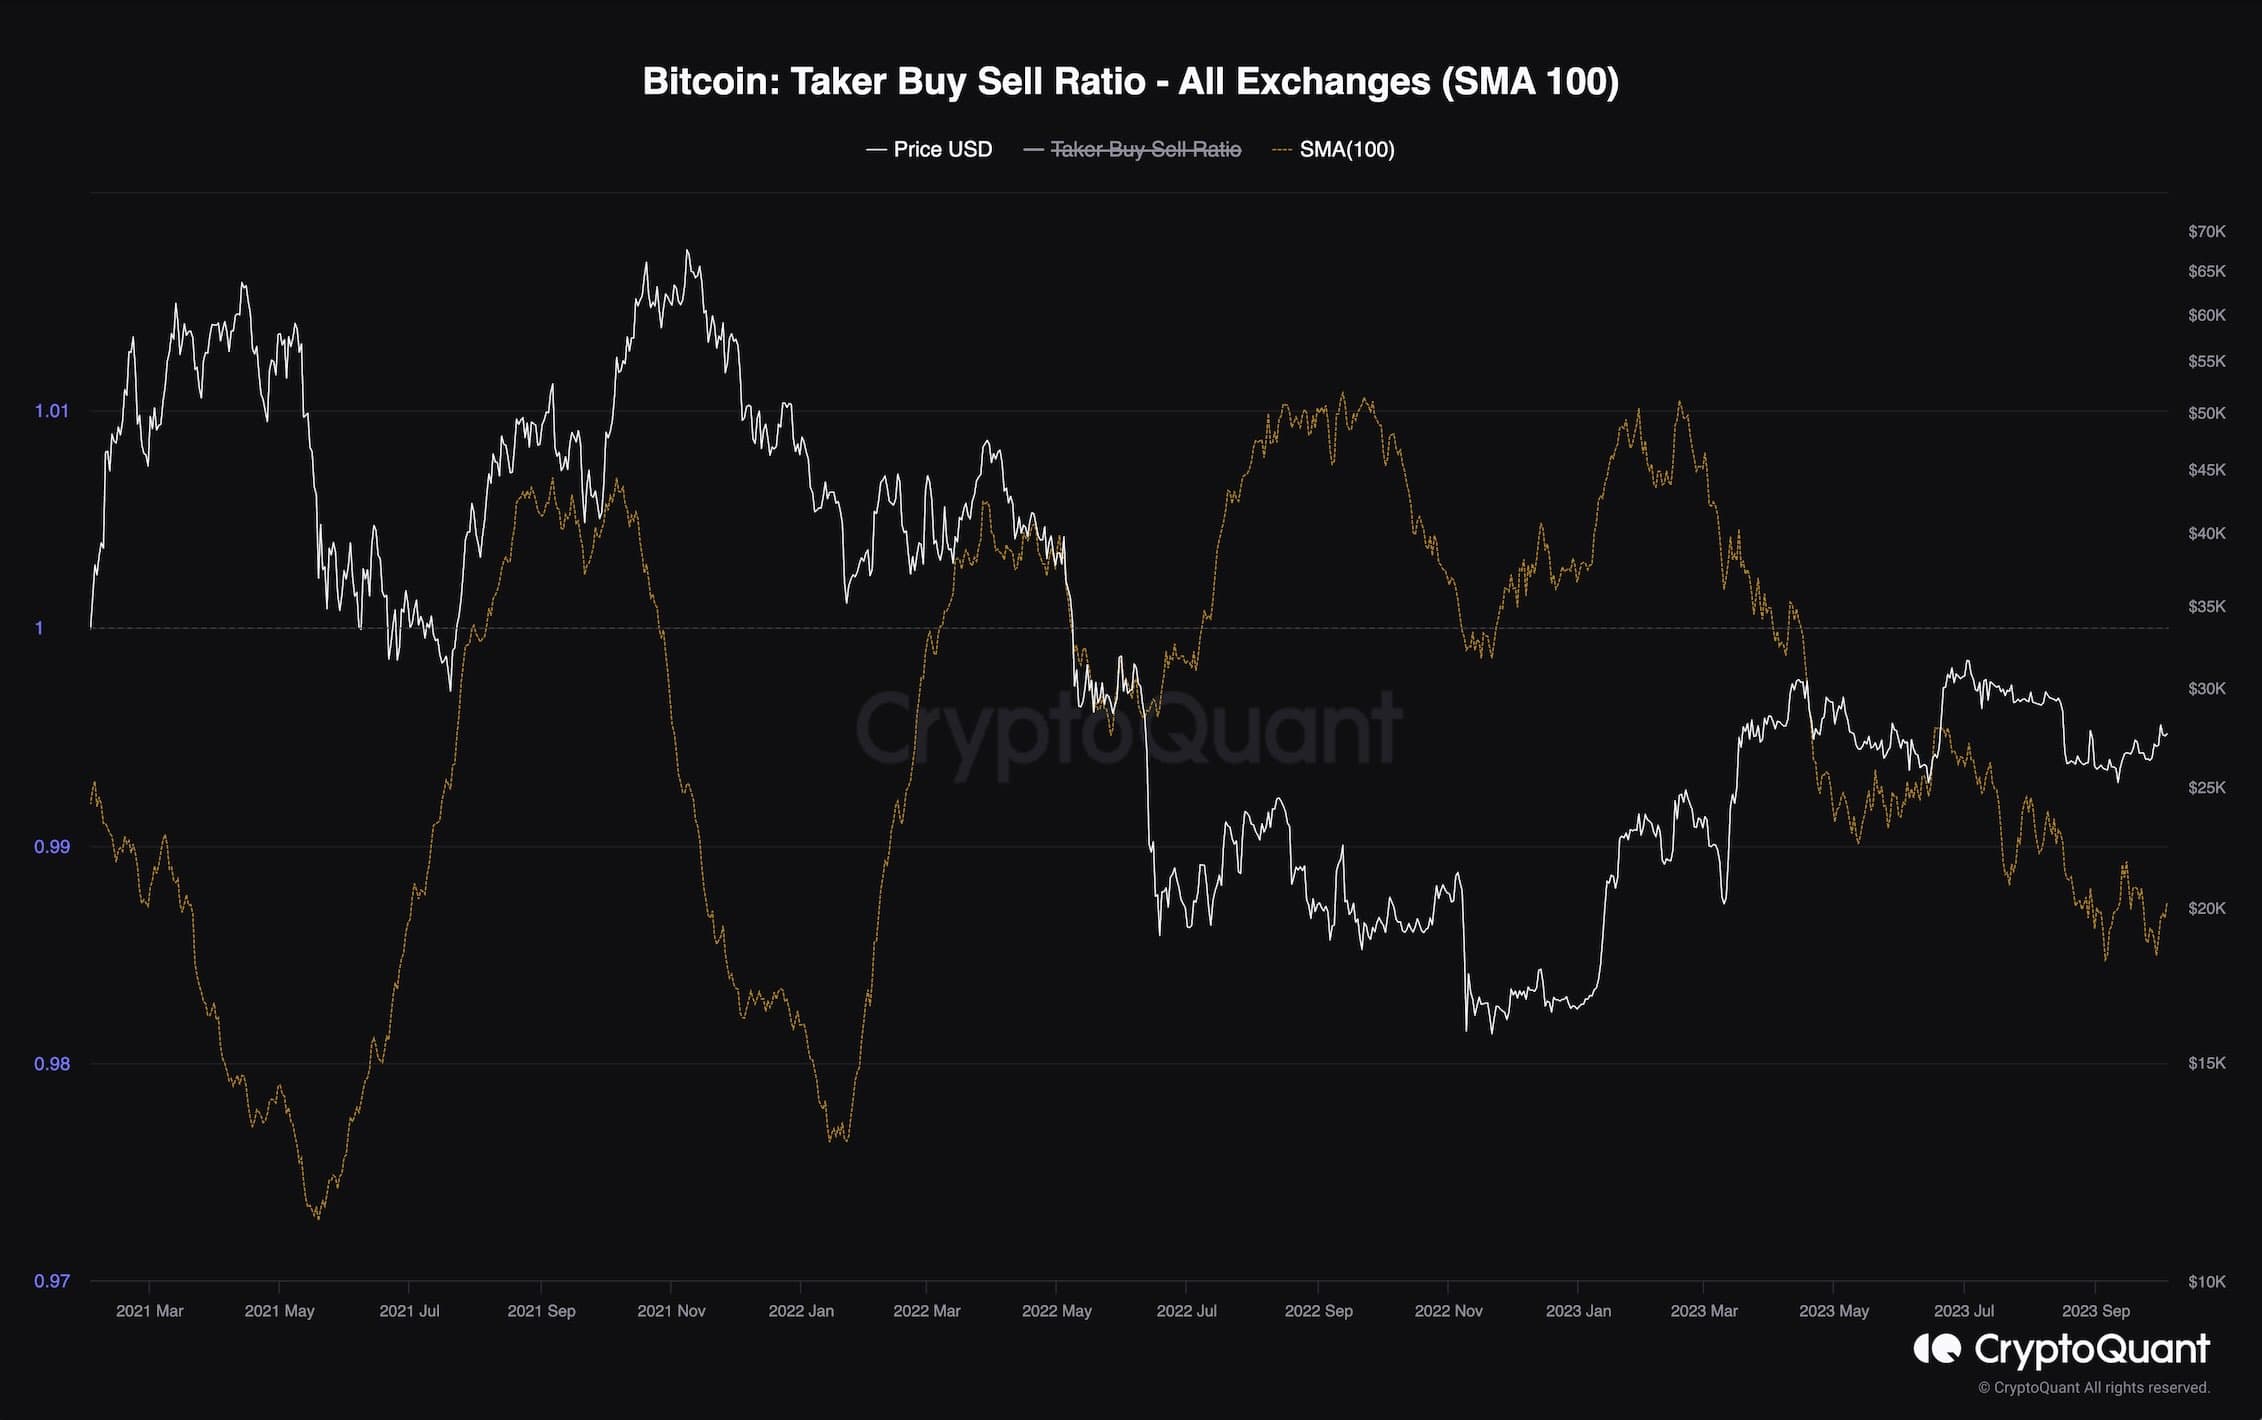
Taker Buy-Sell Ratio
By Edris
The futures market has played a significant role in determining Bitcoin’s price action in recent years. Therefore, for a sustainable uptrend to occur again, the futures market needs to be prepared.
This chart displays the 100-day moving average of the Bitcoin Taker Buy Sell ratio, a valuable metric in evaluating sentiment in the futures market. This metric indicates whether buyers or sellers are executing more aggressive orders overall. Values above one are considered bullish, while values below 1 are bearish.
As shown in the chart, the taker buy-sell ratio has been below 1 for some time now, coinciding with the recent consolidation and inability of the price to move higher. If this metric starts to rise and surpasses 1, it can be expected that a bullish continuation will occur in the short term. Otherwise, any bullish movement would likely be unsustainable.
The post Here Are Two Possible Outcomes for Bitcoin This Week: BTC Price Analysis appeared first on CryptoPotato.