From Bad to Worse as Chainlink Crashes 30% in 2 Weeks, Where’s the Bottom? (LINK Price Analysis)
- Chainlink dropped by 3.2% today as it hits the $10.40 support once again.
- Against Bitcoin, LINK dropped through the crucial 0.001 BTC support as it trades around 0.00097 BTC.
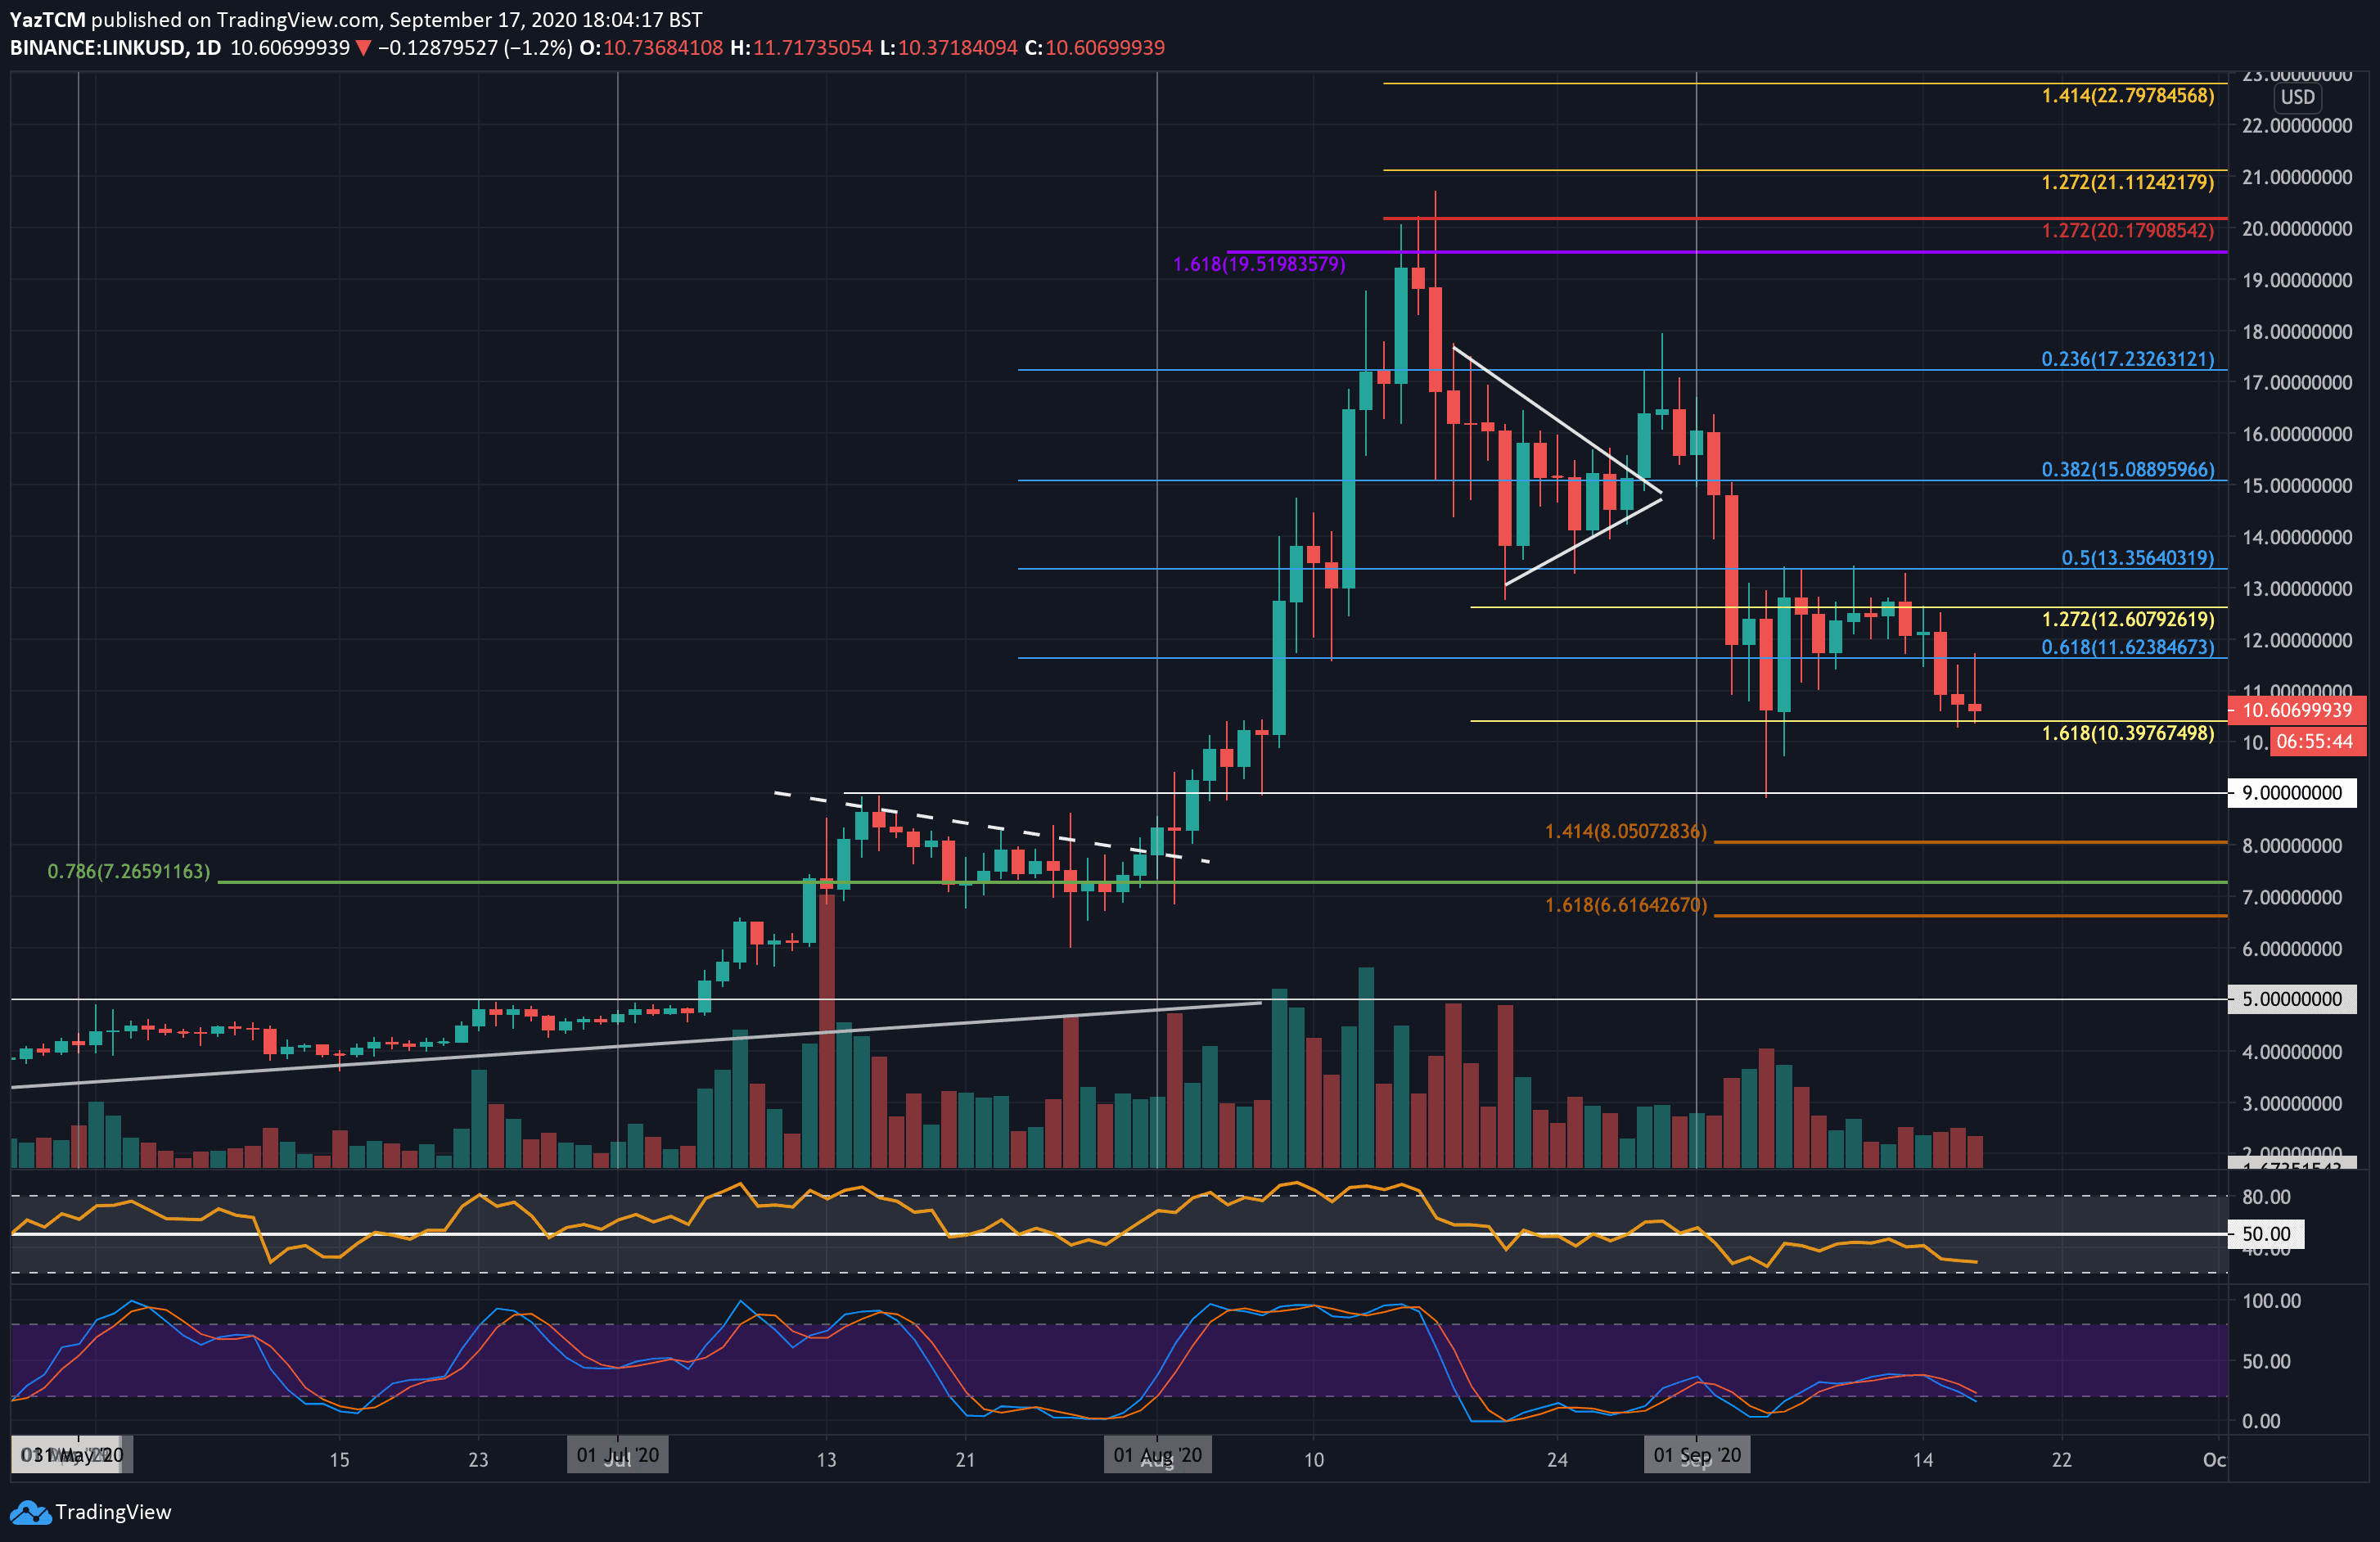
LINK/USD – Bulls Nowhere To Be Seen
Key Support Levels: $10.40, $10, $9.00.
Key Resistance Levels: $11.62, $12.60, $13.35.
LINK has been quite dire during trading in September. In fact, it has been struggling since mid-August when it fell from $20 with the bulls nowhere in sight to curb the drop. In September, LINK dropped from $16 to hit as low as $9.00.
Luckily, the buyers managed to regroup and close the September-low day candle above the $10.40 level, where support is provided by a downside 1.618 Fib Extension level. Since hitting this support, LINK has been rangebound between here and $13.35.
Over the past 5-days, LINK dropped from the upper boundary of this range and has returned to the lower border.
LINK-USD Short Term Price Prediction
If the sellers continue beneath $10.40, the first level of support lies at $10. This is followed by support at $9.00, $8.00 (downside 1.414 Fib Extension), and $7.25 (long term .786 Fib Retracement). Added support is then found at $6.61 (downside 1.618 Fib Extension) and $6.00.
On the other side, resistance first lies at $11.62. This is followed by $12.60 and $13.35.
The RSI is in the bearish favor and seems to be falling, which signifies that the negative momentum is increasing. It even still has room to dip further before becoming oversold.
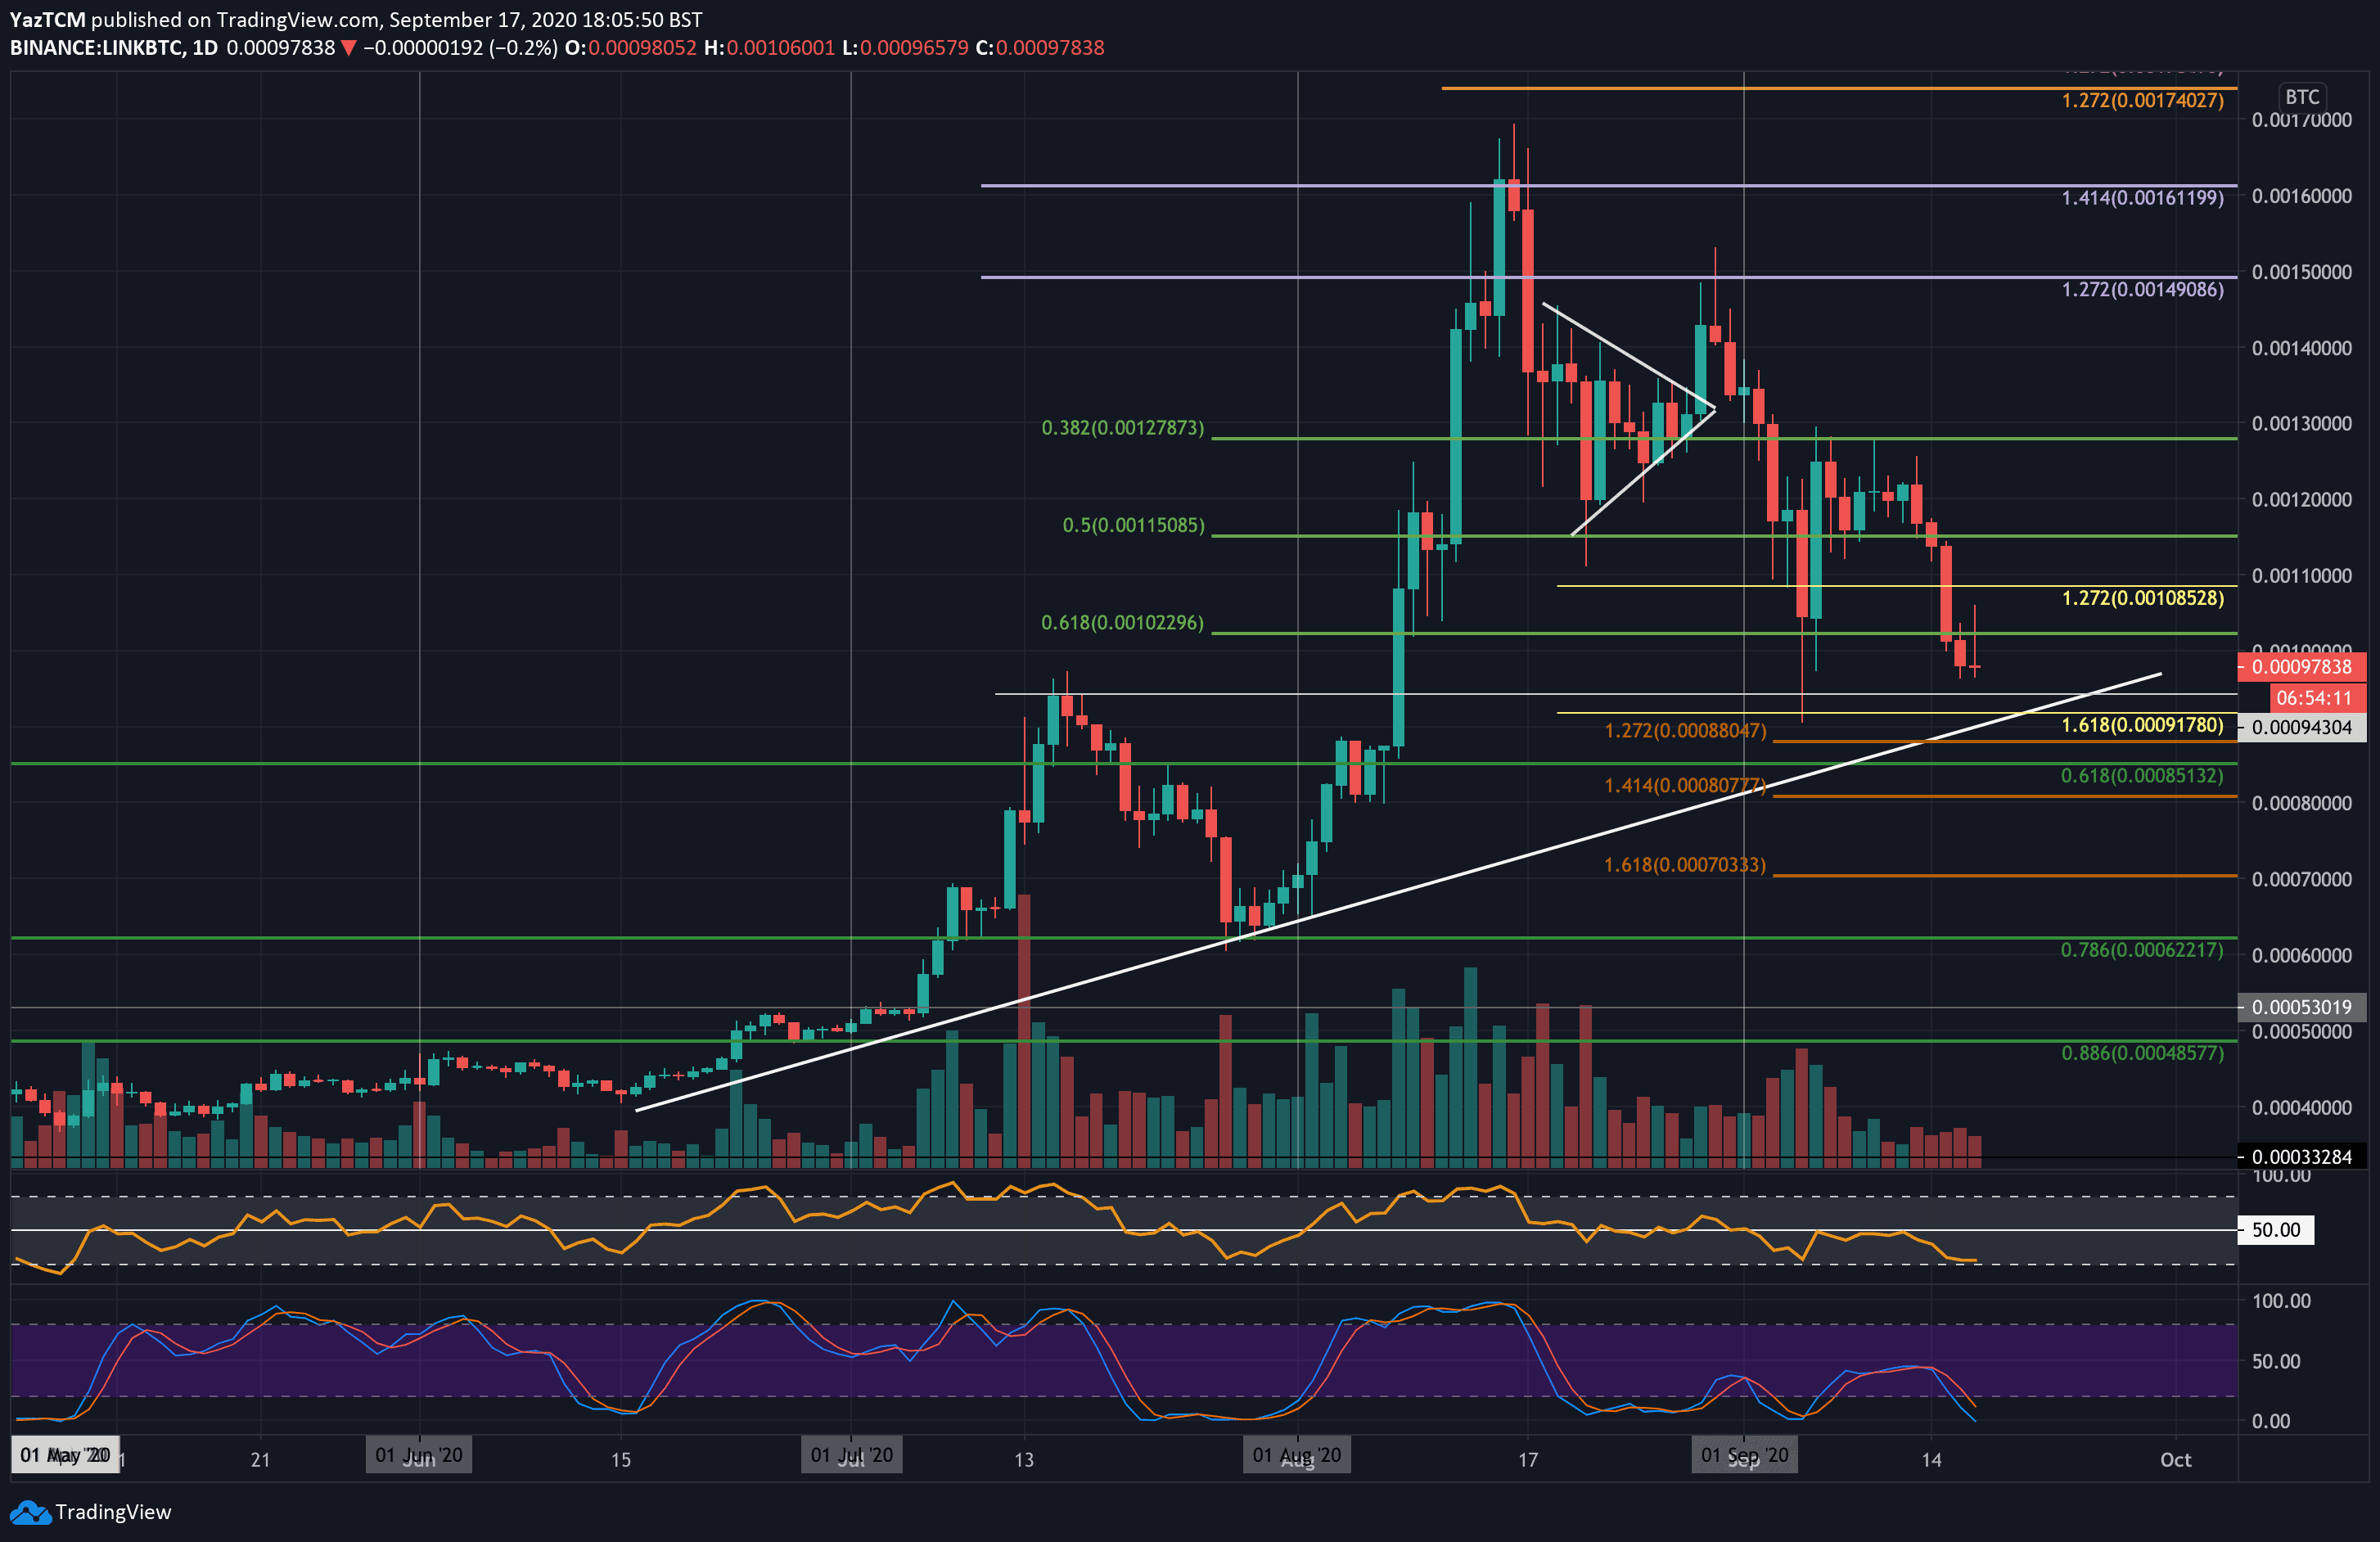
LINK/BTC – Bears Break Beneath Crucial 0.001 BTC Support.
Key Support Levels: 0.000943 BTC, 0.00088 BTC, 0.000851 BTC.
Key Resistance Levels: 0.001 BTC, 0.00108 BTC, 0.00115 BTC.
LINK is in a similar situation against Bitcoin as it broke beneath the support at 0.001 BTC to reach the current 0.00097 BTC level. The sellers have pushed LINK/BTC down by around 30% in just September 2020. It is down by a total of 42% from the August 2020 high.
Luckily, there is strong support ahead at a rising trend line, but a break beneath this could be disastrous for LINK.
LINK-BTC Short Term Price Prediction
Looking ahead, if the sellers continue to drive LINK lower, the first level of support lies at 0.000943 BTC. This is followed by support at the rising trend line, 0.00088 BTC (Downside .1272 Fib Extension), and 0.000851 (.618 Fib Retracement).
On the other side, resistance lies at 0.001 BTC, 0.00108 BTC, and 0.00115 BTC.
The RSI is at the oversold level for LINK/BTC, suggesting the sellers are a little overextended now. This could amount to a rebound for LINK/BTC over the next day or two.
The post From Bad to Worse as Chainlink Crashes 30% in 2 Weeks, Where’s the Bottom? (LINK Price Analysis) appeared first on CryptoPotato.