Bitcoin has received support at the crucial 50-day moving average, located at $27,000. This has led to a rally that aims to break through the significant resistance level of $30K. Despite the cryptocurrency’s overall bullish outlook, there is potential for rejection from this price range.
Technical Analysis
By Shayan
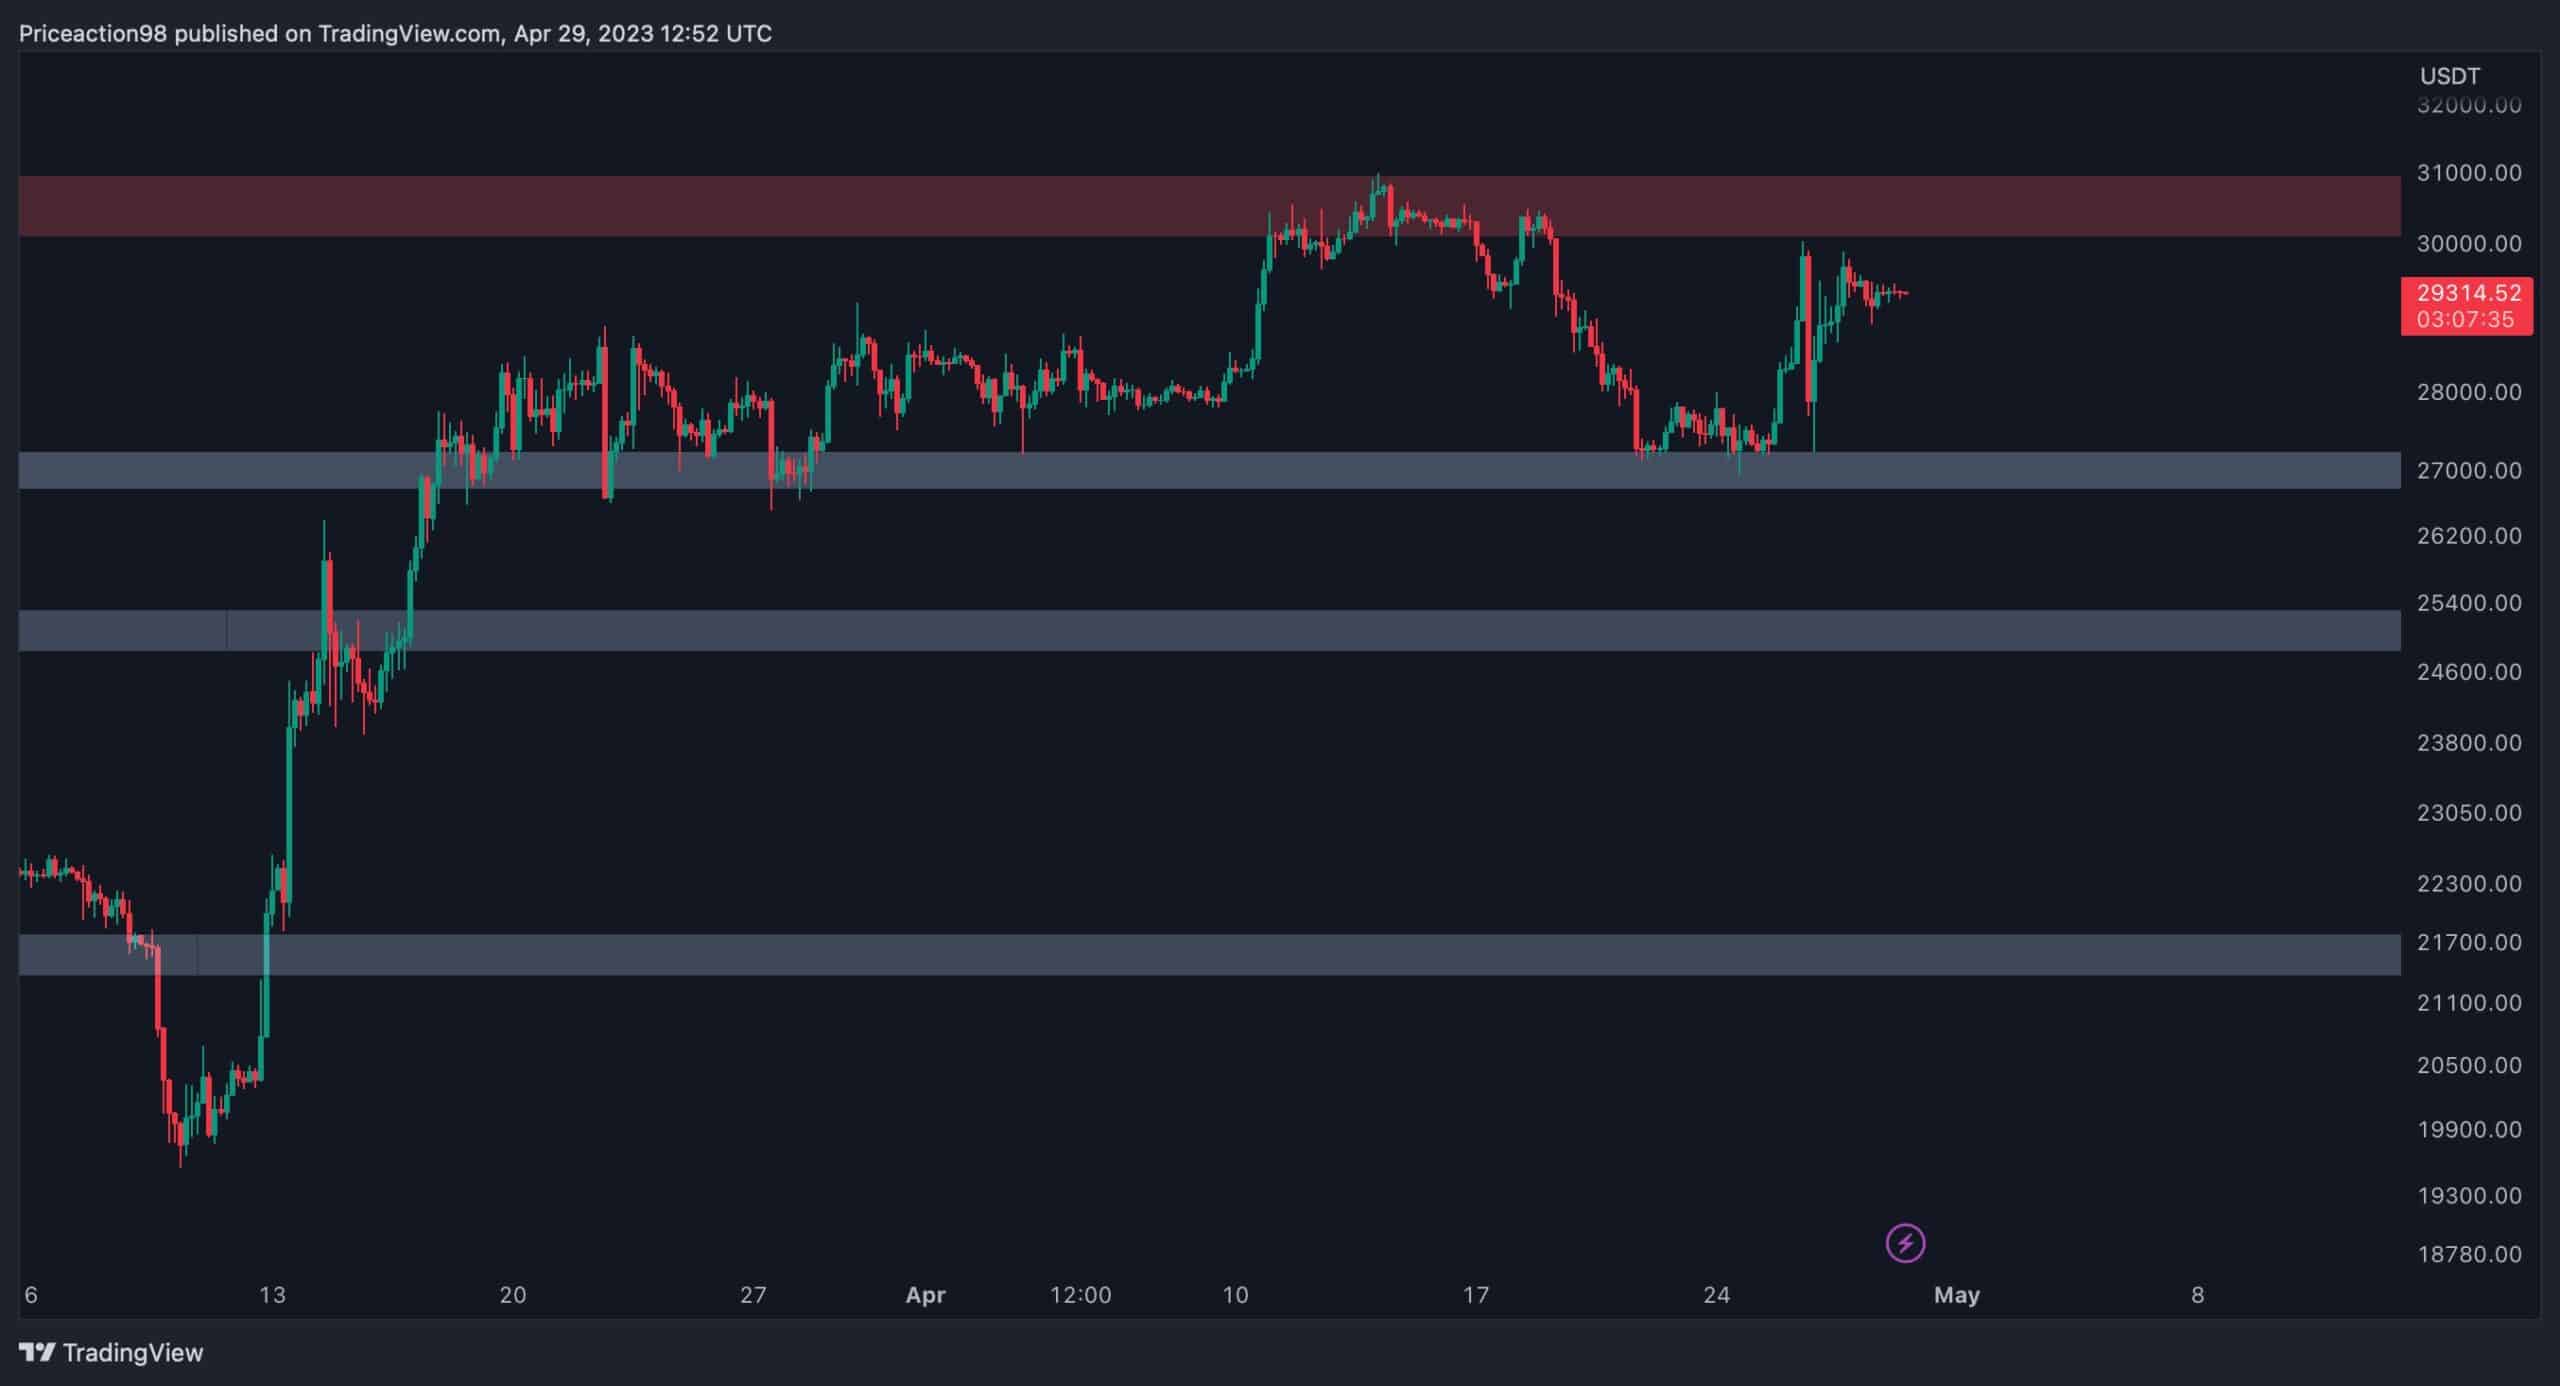
The Daily Chart
Following a short-term correction, Bitcoin found support at the 50-day moving average, presently found at $27,300, resulting in another uptrend. This brought back the bullish sentiment.
However, Bitcoin’s recent price action indicates signs of weakness, as the positive sentiment appears insufficient to break through the next significant resistance region. If BTC manages to claim this crucial price level, an extended bullish rally could likely be anticipated.
Source: TradingView
The 4-Hour Chart
Bitcoin’s price has entered a critical range which lies between the powerful support level of $25,000 and the significant resistance region of $30,000. In recent times, the price has experienced substantial volatility within this range, resulting in massive red and green candles.
Despite this, the price is expected to consolidate within this crucial area in the short term. A breakout may potentially indicate the direction of Bitcoin’s upcoming trend.
Source: TradingView
On-chain Analysis
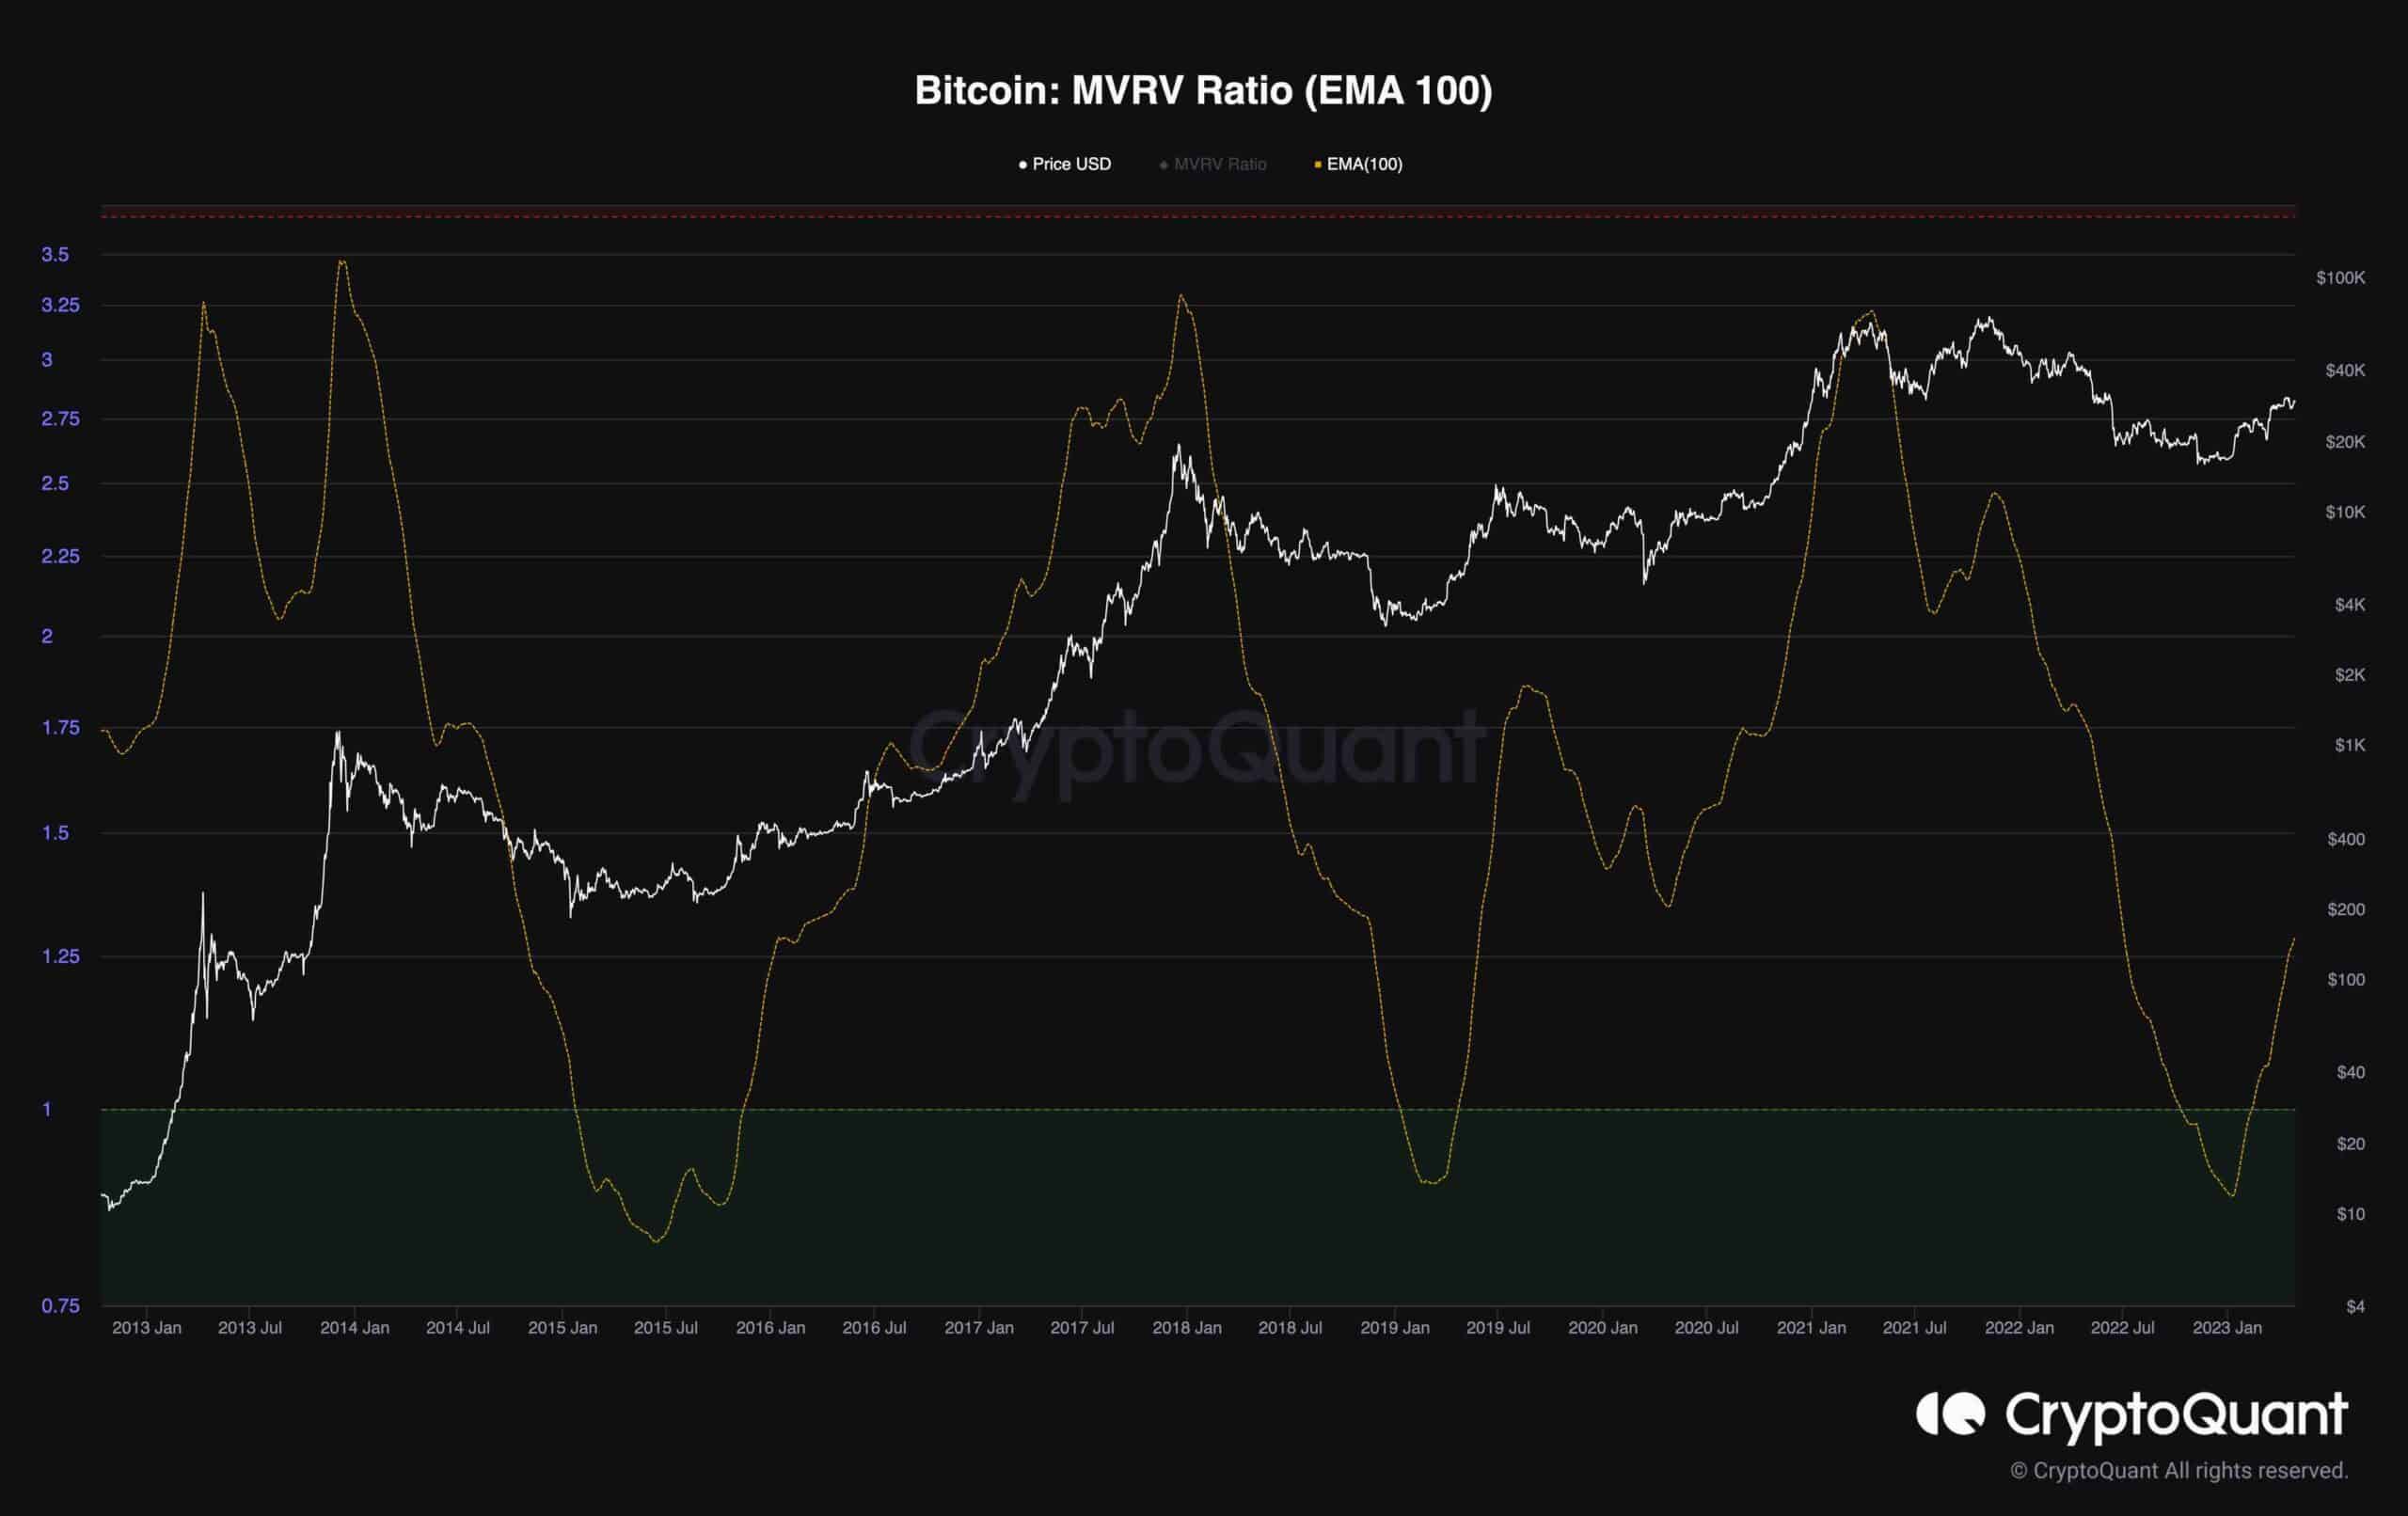
The following chart provides an excellent overview of Bitcoin’s price cycles alongside the MVRV metric, which represents the ratio of the coin’s market cap to its realized cap. This metric is used to determine if the price is overvalued.
Historically, the MVRV metric falls into the green zone during bearish market phases, indicating that Bitcoin is trading in the undervalued section and the cycle’s bottom is forming. However, as the chart clearly demonstrates, each time the MVRV metric has spiked above 1, Bitcoin has experienced a surge, initiating the bull market.
Bitcoin’s recent impulsive rally has caused a sharp increase in the MVRV metric. Therefore, the market may have entered a bullish mid-term stage, which could be followed by unexpected moves and high volatility.
Source: CryptoQuant
The post Following Massive Volatility, Will BTC Finally Break Above $30K? (Bitcoin Price Analysis) appeared first on CryptoPotato.
For the first time, a Bitcoin conference bringing together advocates and critics. Beyond the price volatility, the adoption of Bitcoins continues at a rapid pace. At BayernLB in Munich international experts discuss the value of Bitcoin and its potential impact on businesses and the world economy. Munich, Germany, April 29, 2019 — Senior decision-makers must…
Bitcoin fell back to $22,000 on Thursday shortly after the Securities and Exchange Commission (SEC) laid charges against Kraken for the unregistered offering of its staking services. Kraken agreed to halt the service and pay $30 million in disgorgement, prejudgment interest, and civil penalties, without admitting to or denying any wrongdoing. According to the SEC’s…
Ethereum dropped a steep 12% over the last 24-hours as it sinks into support at $205. The cryptocurrency initially climbed into the $250 resistance before severely rolling over and crashing toward the 100-days exponential moving average. Against Bitcoin, Ethereum also dropped but found support at the 0.0247 BTC level. Key Support & Resistance Levels ETH/USD:…
Bitcoin and cryptocurrencies have been a hot topic ever since their prices boomed back in 2017 and the total market cap surged past $800 billion. However, a recent Twitter poll presented an interesting statistic, showing that the number of involved investors might not be as high as we thought. On the bright side, it also…
Self-sovereign financial services provider BonqDAO has been exploited through an oracle hack leading to the theft of $110 million in crypto from the protocol. During the exploit, the attacker managed to manipulate the price of AllianceBlock wrapped tokens (wALBT) and made away with 100 million wALBT worth over $10 million. What Happened? An analysis by…
The United States has finally joined the bandwagon of countries testing a central bank digital currency (CBDC), Thursday reports revealed. Governor Lael Brainard said during a virtual technology event yesterday that the US Federal Reserve, in collaboration with research teams from Boston Fed and Massachusetts Institute of Technology (MIT), is conducting experiments with a hypothetical…
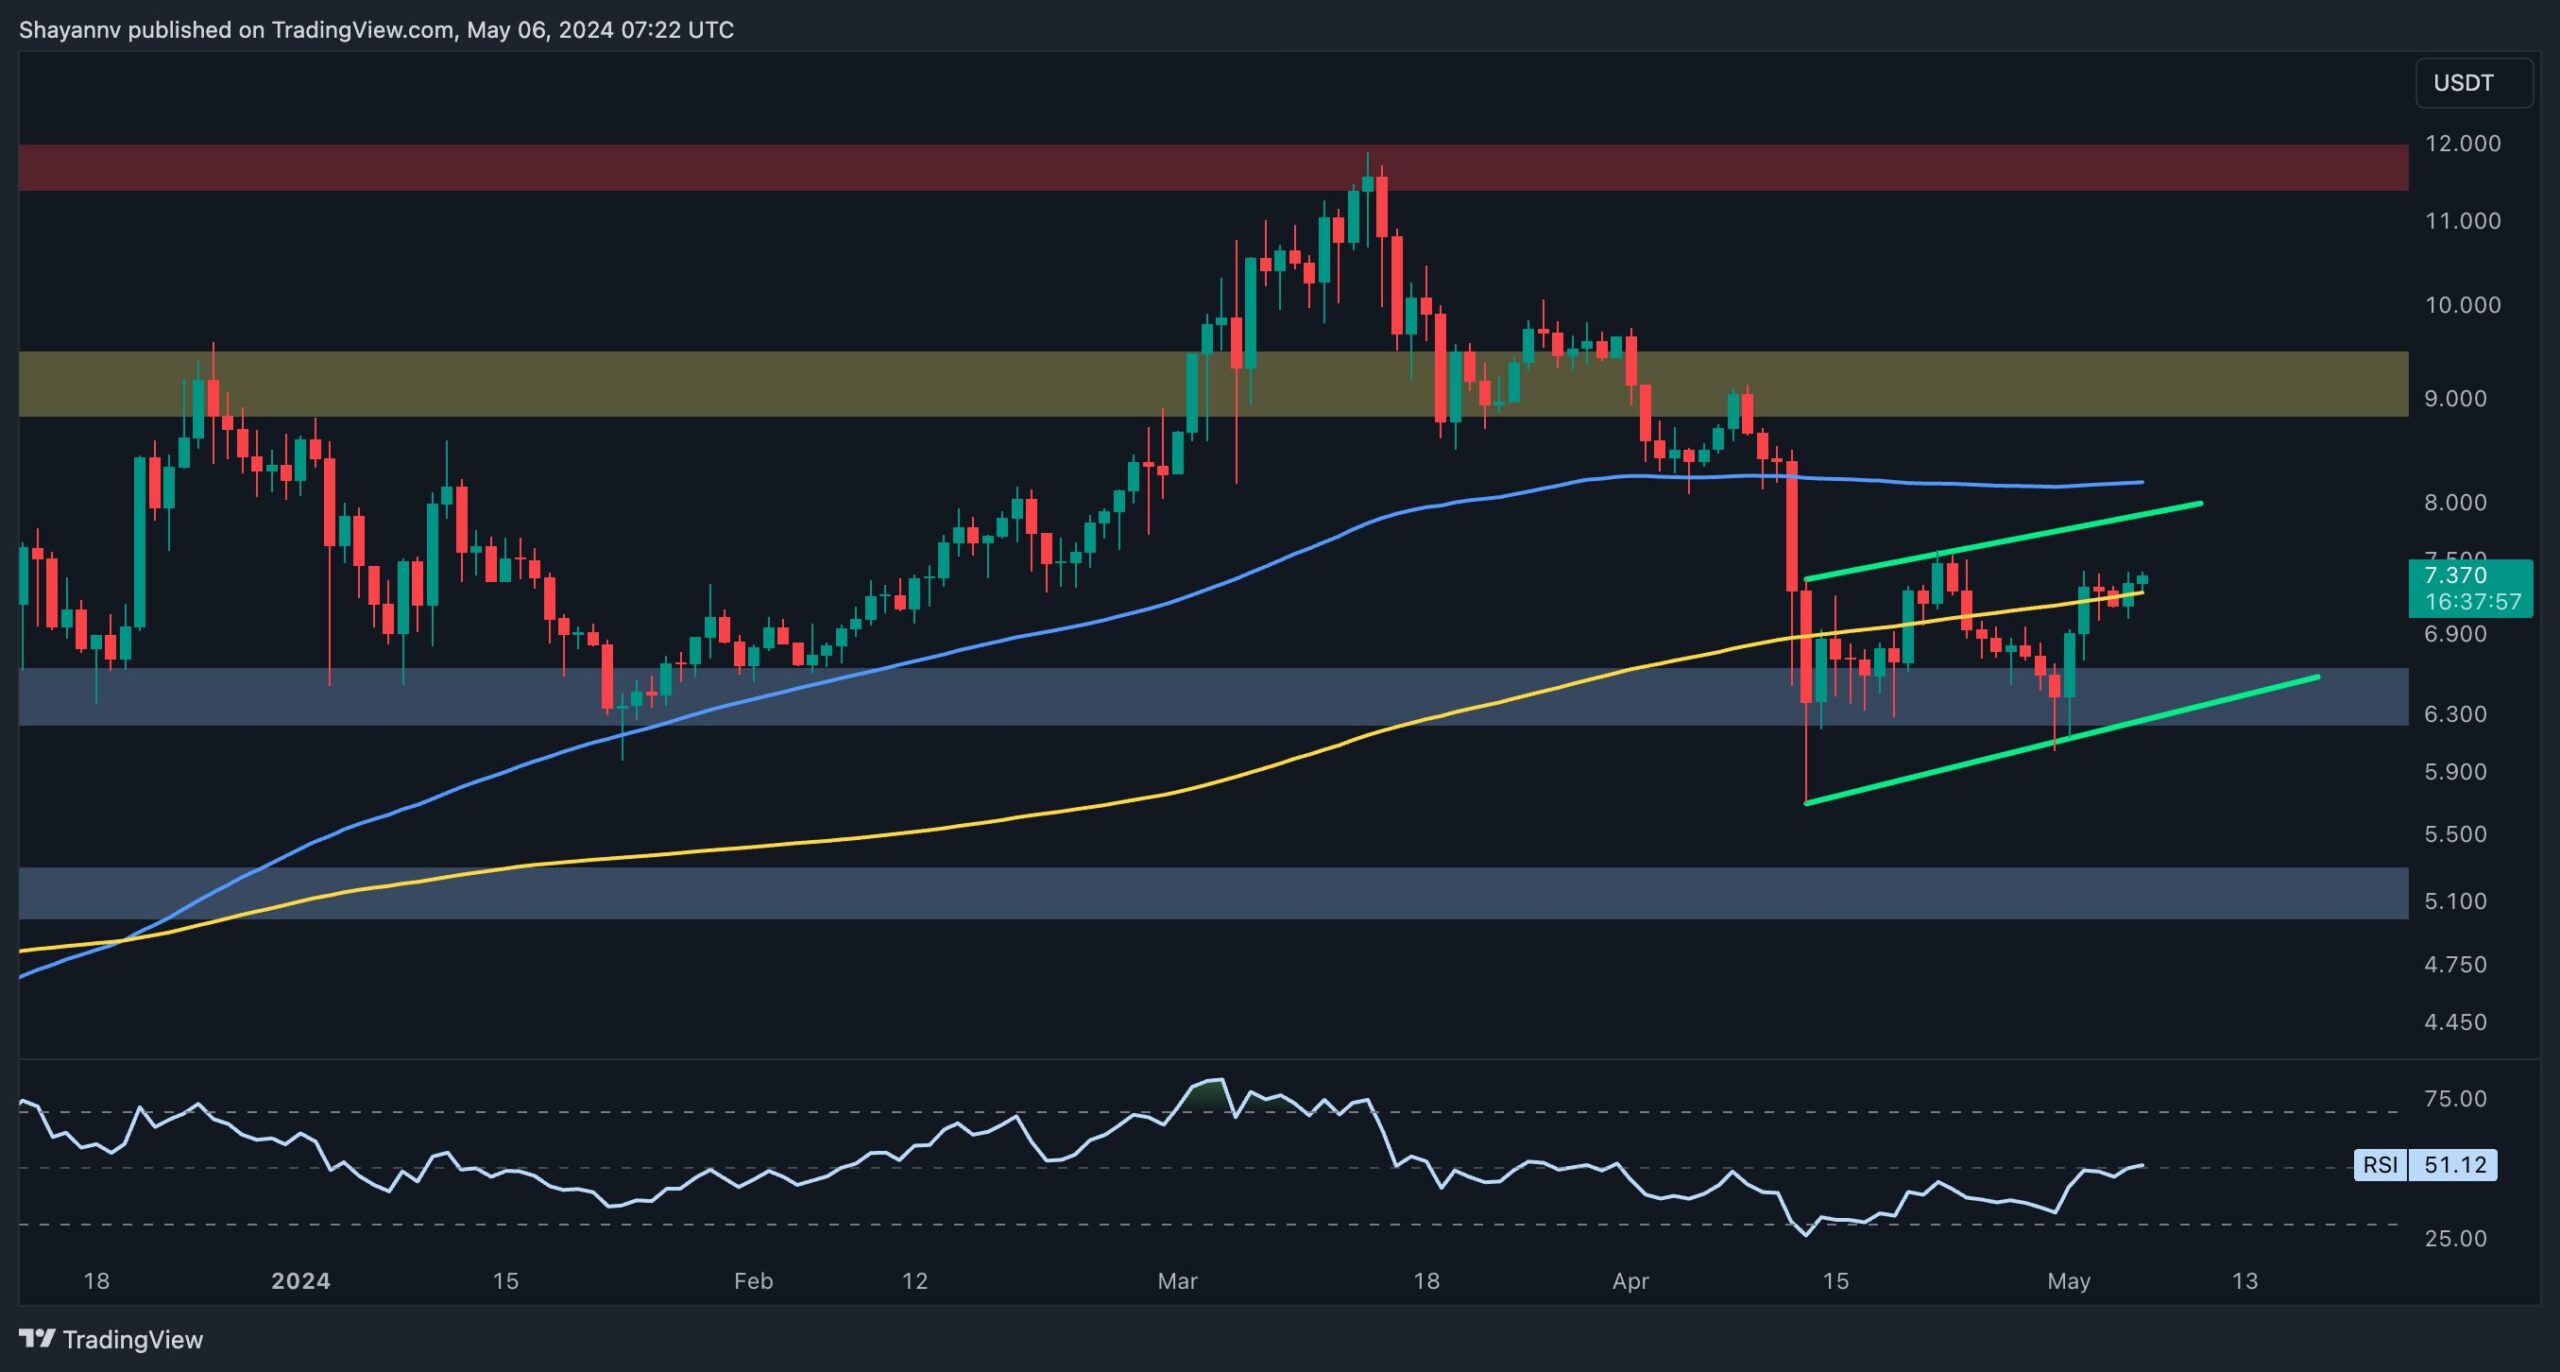
Polkadot has been mired in a prolonged consolidation phase, hovering around the pivotal 200-day moving average and the $6.3 mark, reflecting uncertainty regarding its future trajectory. However, a breach below this crucial support area could culminate in a decline towards the $5.1 threshold. Technical Analysis By Shayan The Daily Chart A detailed examination of the
Barclays has filed two patent applications relating to the transfer of digital currency and blockchain data storage, both published by the U.S. Patent and Trademark Office (USPTO) July 19. The first patent describes a system for transferring digital currency from payer to recipient that would securely authenticate the identities of both, as well as validating…
[PRESS RELEASE – April 27, 2022, HONG KONG ChainUp Group’s subsidiary Top Value is pleased to announce a partnership with Huobi Technology Holdings Limited (Stock code: 1611.HK)’s wholly-owned subsidiary Huobi Asset Management (Hong Kong). Together, they will launch an IPFS infrastructure mining fund, an important step in Web 3.0 development. This new fund product is currently…