Following a Slight Recovery, Here’s the Major Level for XRP Bulls to Target (Ripple Price Analysis)
Ripple has increased by 4% as the crypto market began to recover over the last two days. One explanation for this can be found in the DXY index reaching a stiff resistance. However, the sentiment across risk-on markets continues to be bearish.
Technical Analysis
By Grizzly
The Weekly Chart
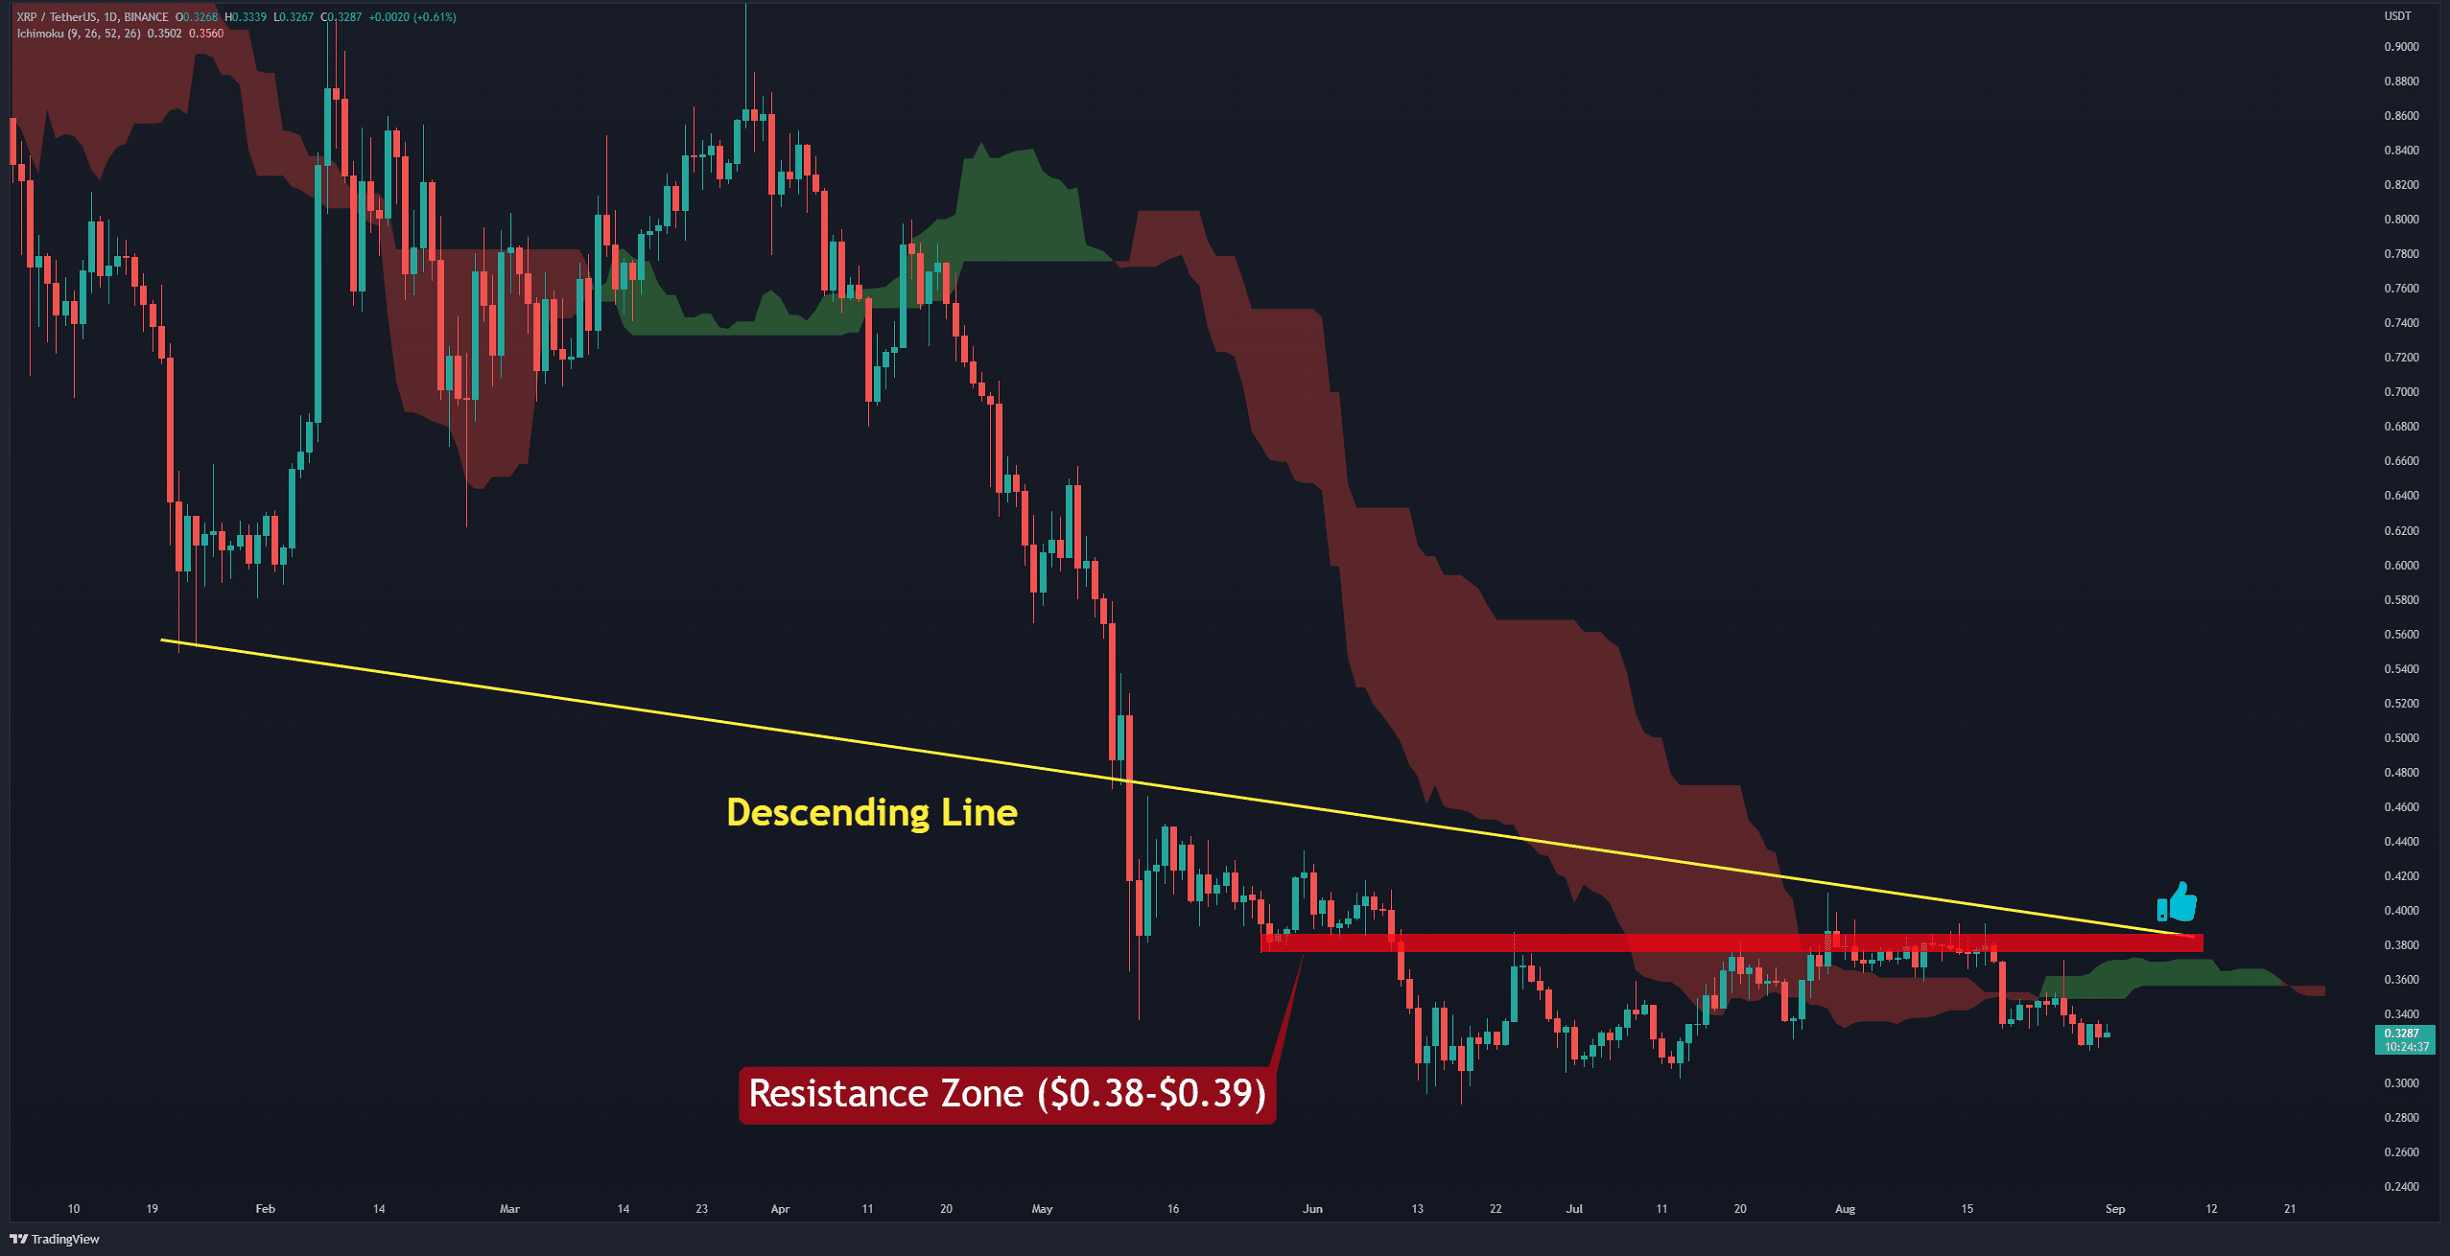
The trend structure became bearish after the formation of a lower high and lower low on the daily chart. After failing to push the price above the horizontal resistance at $0.39 (in red), the bulls are now on the defense and should prevent the price from falling further.
Although the price increased slightly yesterday, it is not yet significant enough to start a rally. The recovercould begin when the bulls can flip the resistance zone in the range of $0.38-$0.39 by passing through Ichimoku Cloud. This will likely coincide with clearing the resistance of the descending line (in yellow). However, this is a level that the asset has been stuck below for over 100 days.
Due to current macroeconomic conditions and fear of recession, high-risk assets will probably experience expanded volatility. Until the Federal Reserve reduces its hawkish policies, it seems unlikely for the crypto market to start recovering convincingly.
Key Support Levels: $0.33 & $0.28
Key Resistance Levels: $0.36 & $0.39
Daily Moving Averages:
MA20: $0.35
MA50: $0.35
MA100: $0.36
MA200: $0.53
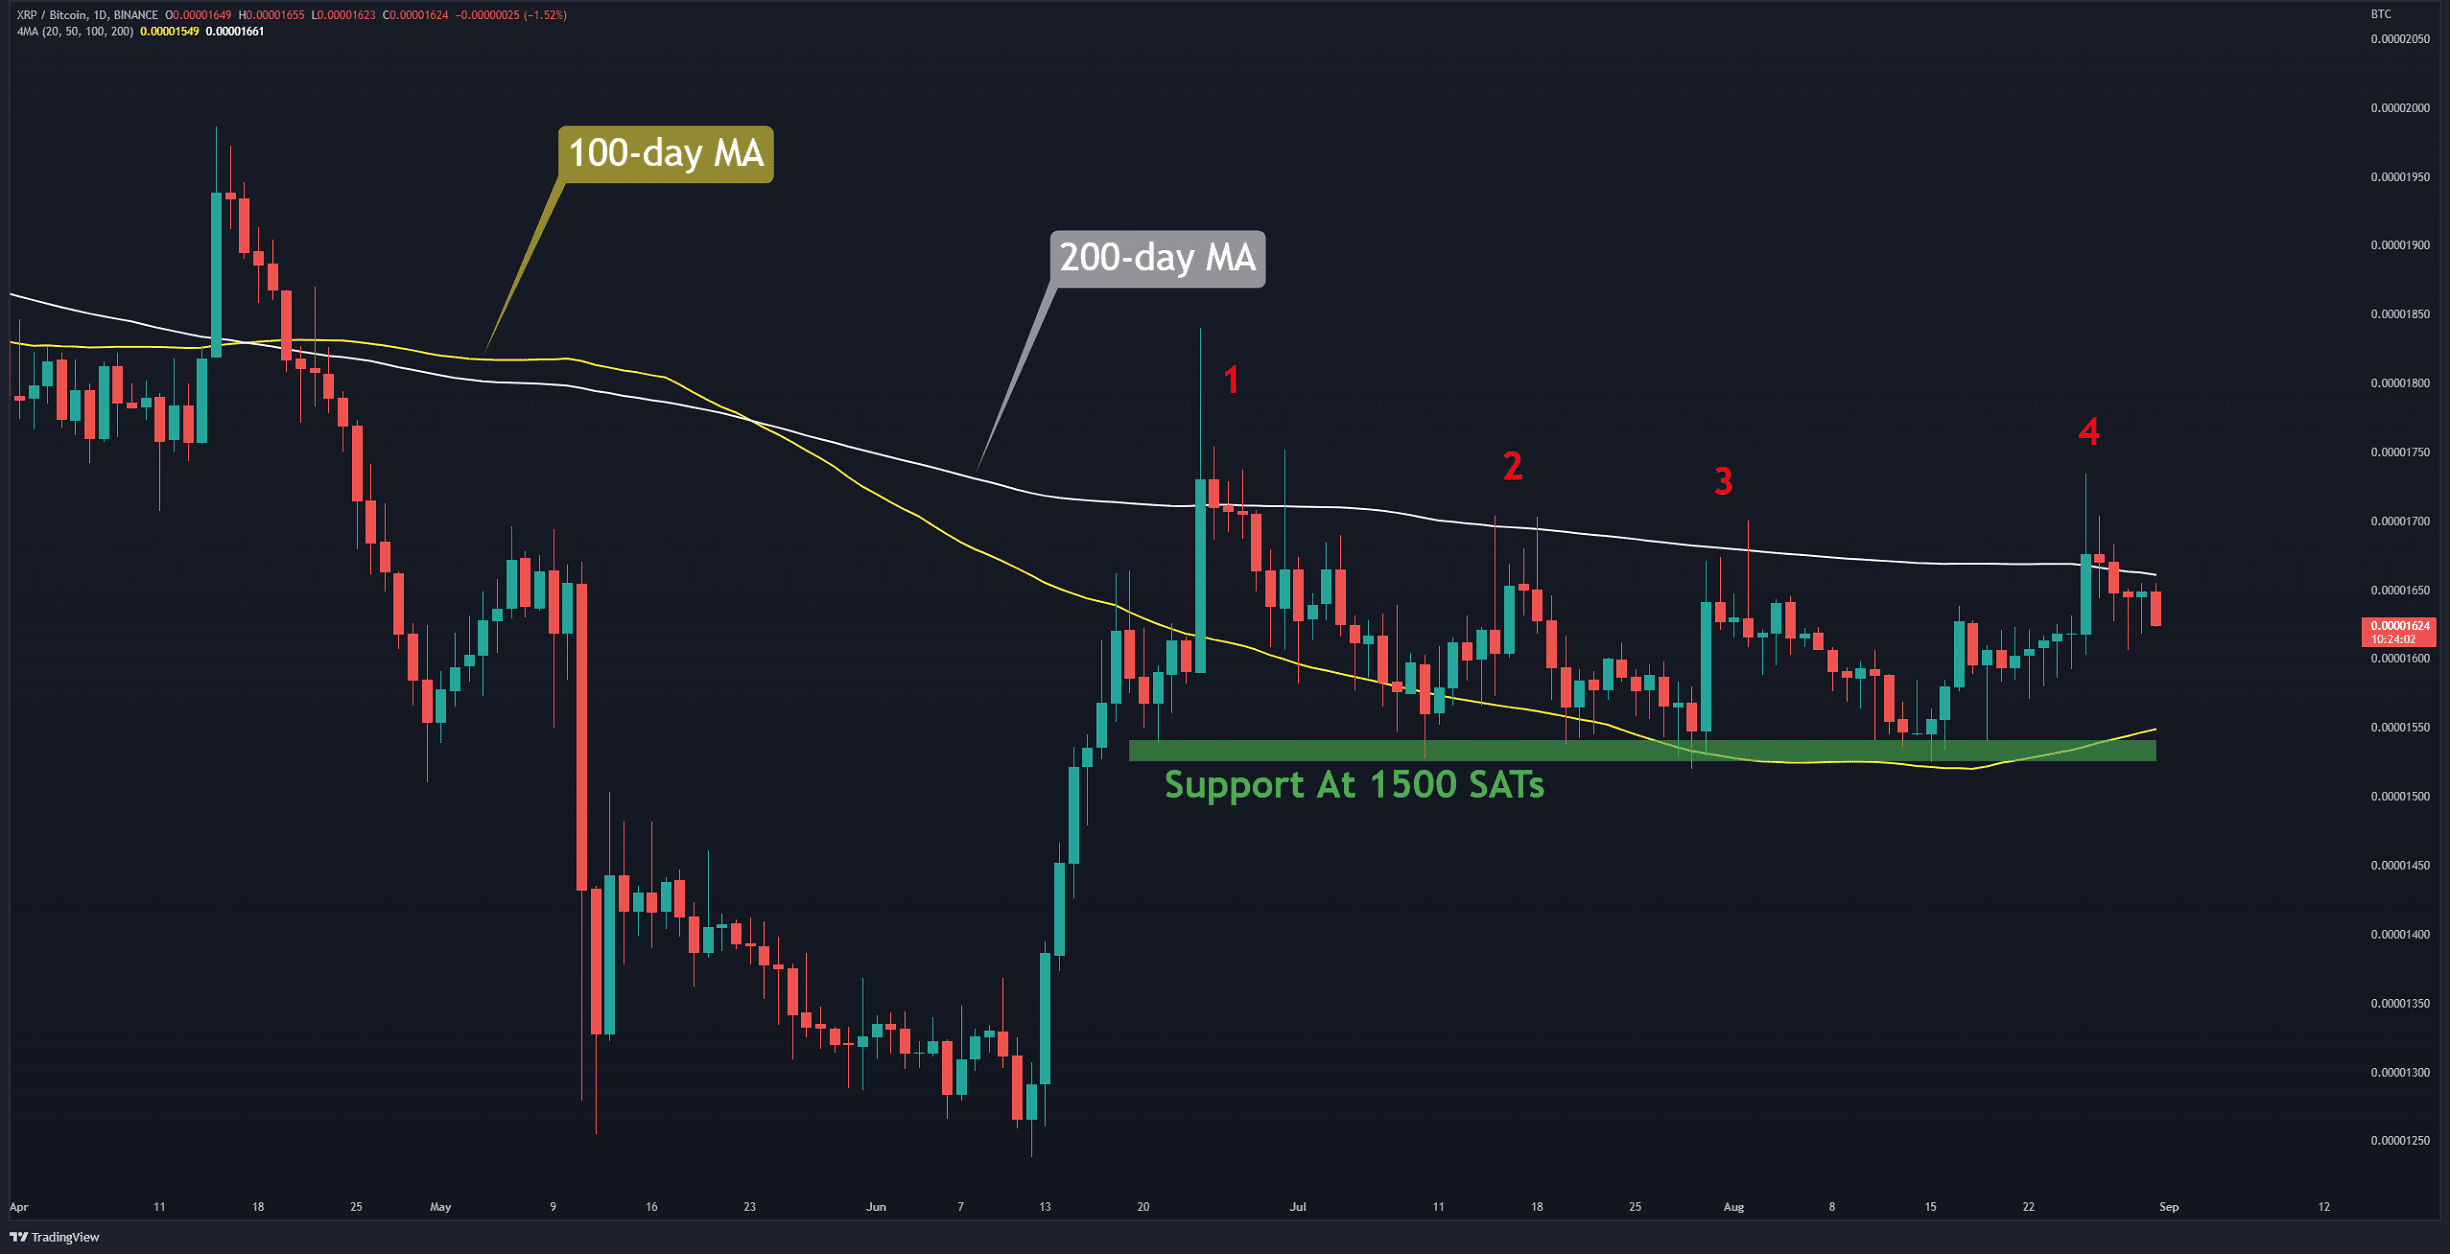
The XRP/BTC Chart
Against Bitcoin, the bulls could not keep the price above the 200-day moving average (in white) for the fourth time in the last two months. It is worth noting that in previous instances, the price extended up to the 100-day moving average (in yellow).
If the same pattern is repeated this time, the 100-day MA, which lies at 1500 SATs, has the potential to support XRP. If this level cracks, the next support will be found at 1370 SATs.
Key Support Levels: 1500 SATs & 1370 SATs
Key Resistance Levels: 1700 SATs & 2100 SATs
The post Following a Slight Recovery, Here’s the Major Level for XRP Bulls to Target (Ripple Price Analysis) appeared first on CryptoPotato.