Following 10% Gains, BNB Is Targeting Its All-Time High: Binance Coin Price Analysis Mar.12
The scheduled maintenance period on the Binance Exchange has not stopped the endless rally of Binance Coin. As reported yesterday, there was an 8-hour planned maintenance period on Binance exchange early today, in which there was an anticipation that some traders may liquidate their positions to retain control of their trades. Besides, during maintenance and off-line periods, Bitcoin whales love to initiate price manipulations.
However, as soon as trading re-opened this morning, the BNB market had continued its surge higher as the price increased by 6% over the past 24 hours. The coin is now aiming for its Bitcoin’s all-time high at around 0.004 BTC per coin. Binance Coin is currently trading at a price of $15.22 followed by a $2.15 billion market cap value, which leaves BNB on the 7th place of the largest cryptocurrencies by market cap.
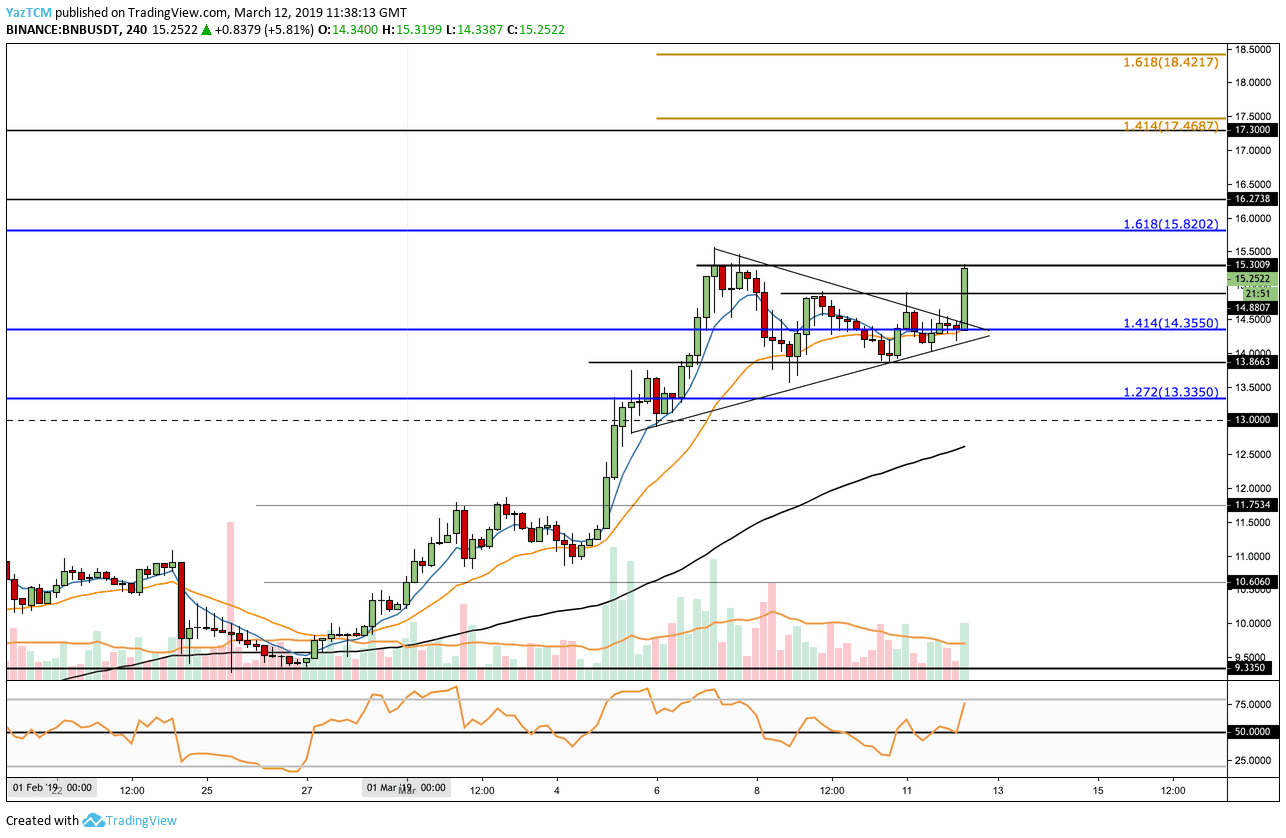
Looking at the BNB/USD 4-Hour Chart:
- Since yesterday’s BNB/USD analysis, we can see that Binance Coin had approached the apex of the short term triangle and proceeded to break above the upper boundary with a reasonable green candle. The breakout had surged BNB back above $15 to where it is currently trading, ahead of the $15.30 resistance mark.
- From above: The nearest resistance above $15.30 lies at $15.82 and $16.27. In case the bulls can break above $17.00, then further resistance lies at $17.30 and then at the 1.414 ($17.46) and 1.618 ($18.42) Fibonacci Extension levels (marked in gold).
- From below: The nearest support lies at $14.88 followed by $14.25. Below this, $13.86 provides some strong support followed by $13.35. If the sellers manage to push the market below the support at $13.00 we can expect further next targets at $12.00, $11.76 and $10.66.
- The RSI is also back above the 50 zones as the bulls take control of the momentum. The RSI is not yet reached the overbought area which indicates that there is space to go even higher.
Looking at the BNB/BTC 4-Hour Chart:
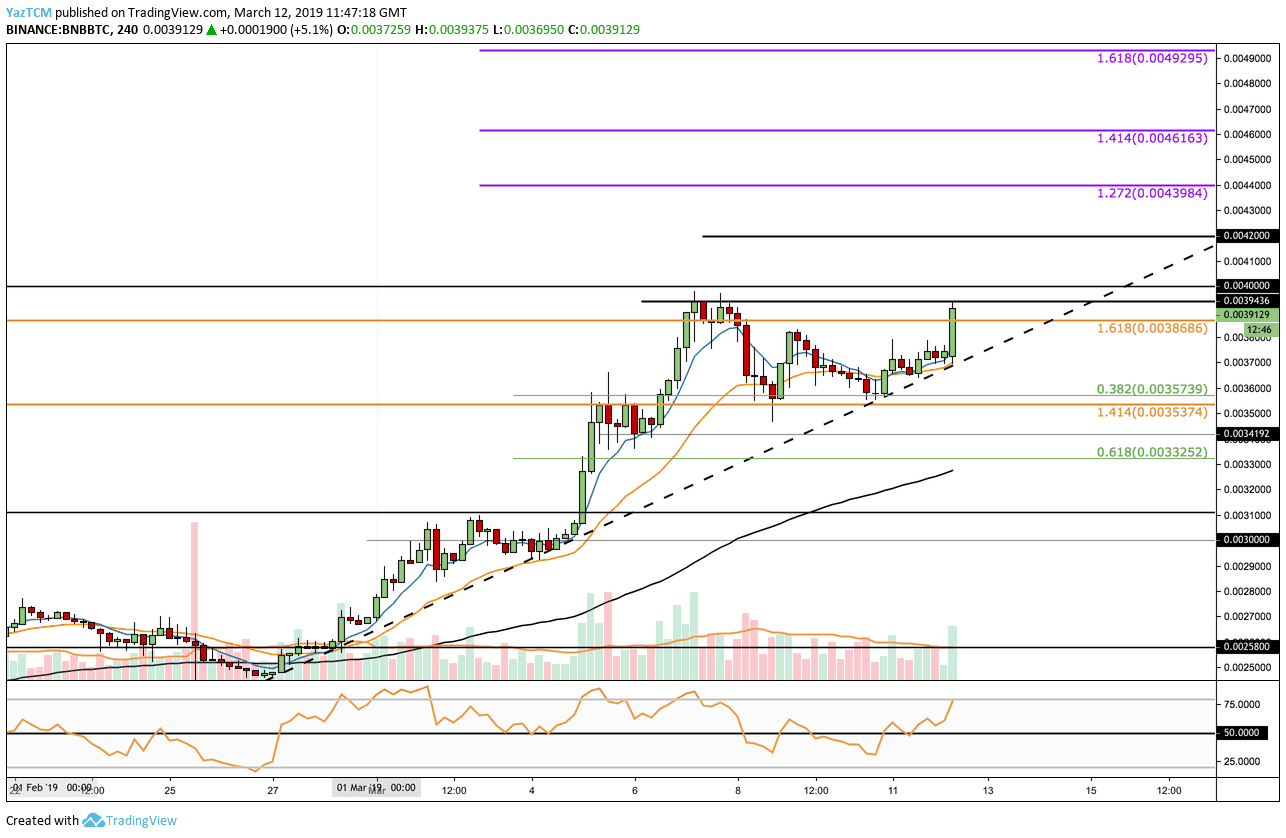
- Following our previous BNB/BTC analysis we can see that the coin had continued to rise according to the ascending supporting trend line. The market is retesting resistance of the BNB/BTC all-time high around 0.00394 BTC.
- From above: The nearest resistance above the ATH lies close at the 0.0040 BTC area. Above we can expect immediate resistance higher at 0.0042 BTC. This is then followed by the 1.272 (0.004398 BTC) and 1.414 (0.004616 BTC) Fibonacci Extension levels (marked in purple).
- From below: The nearest level of support now lies at 0.00386 BTC. Below this, we can expect support at 0.003579 BTC, 0.0035 BTC, and 0.003325 BTC.
- The RSI has also recently broken into bullish territory as the bulls gain control of the momentum.
The post Following 10% Gains, BNB Is Targeting Its All-Time High: Binance Coin Price Analysis Mar.12 appeared first on CryptoPotato.