Ethereum Price Analysis Oct.10: A false breakout?
Two days ago was a pretty exciting day in the crypto magical world. The mini bull run we saw in Bitcoin and some other altcoins (such as ADA, ONT, TRX, and EOS) turned people bullish too soon.
BTC was trying to accomplish the mission of bullishly breaking the triangle formation that has been developed since February, but the bears had other plans and kept BTC inside the triangle territory, as for now.
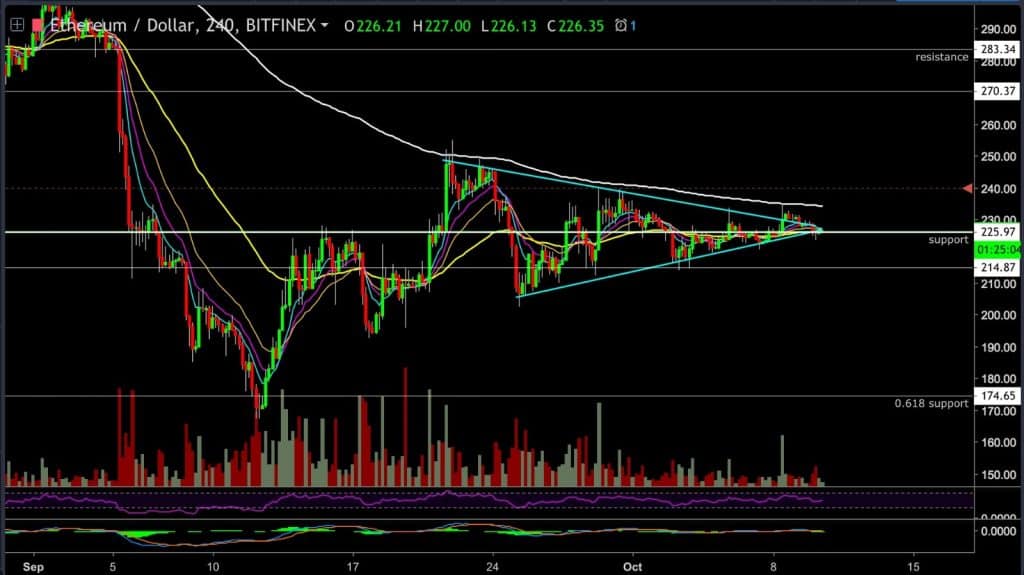
ETH, like Bitcoin, made an attempt to break the formation above, but only managed to spike the upper triangle’s trend-line and then turned immediately back in. The breakout took ETH to the $234.9 price level (Bitfinex price), but the 4-hours candle closed just below 230$ at 229.84$.
Notice that the long wick above the breakout candle was formed by a massive amount of limit sell orders placed above the triangle’s trend line. This was what we have warned about in our previous ETH price analysis. It wasn’t a clear “shooting-star” kind of candle (which is a bearish signal when it appears on the top of a possible movement), but it wasn’t for sure the kind of break out we wanted to see.
Looking at the 4 hours chart
ETH has re-drawn the triangle’s trend lines, and as we can see, ETH met the lower triangle’s trend-line one more time during the last 24 hours. From there, it spiked shortly afterward.
At the moment, the triangle formation doesn’t give enough clues to possible targets a breakout might take ETH to.
Our targets stay the same
– A substantial break out above the upper trend line with an impressive amount of volume (and holds the break until candle close) will be the sign of bulls winning. This will set the first mini target at 250$ and from there to the next resistance area at 270$.
– A strong move down past the $214 level will be a bearish sign, which could lead a much more bearish target at $170 – $180.
ETH/USD BitFinex 4 Hours chart
 Cryptocurrency charts by TradingView. Technical analysis tools by Coinigy.
The post Ethereum Price Analysis Oct.10: A false breakout? appeared first on CryptoPotato.