Ethereum Price Analysis Nov.25: ETH sets a new 2018 low at $100 (as expected)
The human behavior as a group of individuals is a very fascinating thing to observe. The financial markets are one of the best places where we can try to understand how we think and act as a group of humans.
By observing the bulls and bears constant fight over an asset’s price, we could learn a lot, Or in the case of crypto, we can also get confused…
Bitcoin price hit it’s current yearly low today at around $3400.
We can notice that the near-perfect technical bearish triangle formation that we had been following for so long on the daily chart played perfectly and broke down with extreme force, taking the BTC price down by 40% in a matter of 10 days.
We can also notice that the last day’s move was one the most radical declines since Bitcoin hit its ATH at the end of 2017. This move looks even steeper than the decline in February of this year.
Those radical moves usually form as wave 3 of the Elliott Wave theory count. It could be the 3rd wave of a 5 wave formation, or it could be a 3rd wave of the C wave (part of an ABC formation). However, either way the fact that the radical move crypto markets just experienced was probably a third wave. This might indicate that the floor of this move hadn’t reached yet since the move is missing wave 4 and 5.
The Crypto market total cap is currently worth $124 Billion. Most if not all Altcoins lost a big chunk of their value while BTC dominance is holding around 54.2%.
Back to Ethereum
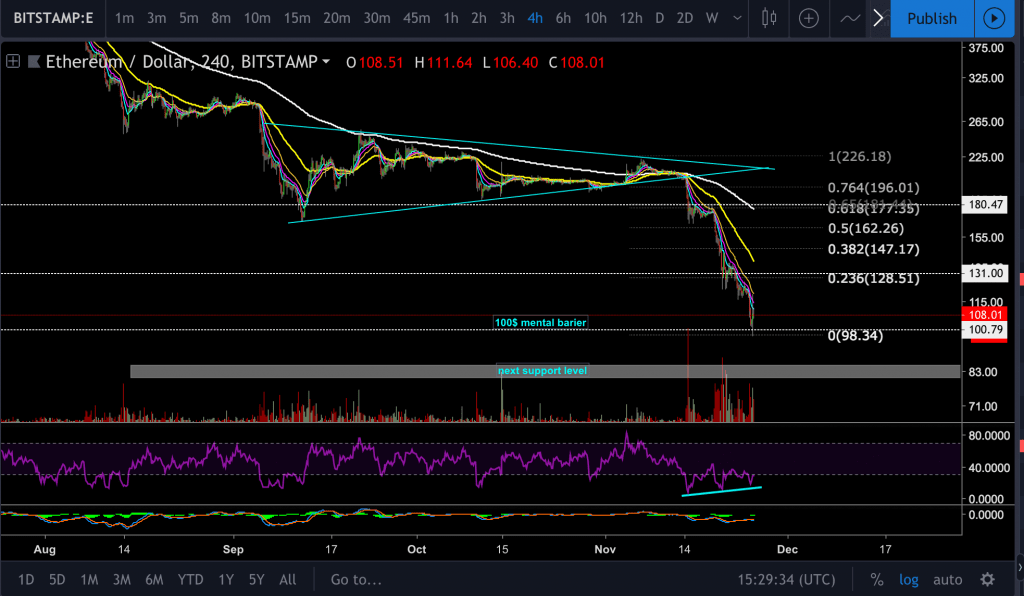
Ethereum price broke below the $100 mental barrier and hit the $98 price level as the current low.
Looking at the 4-hours chart
- The long green Doji candle that was formed precisely on the $100 price level is a positive sign that the bulls are trying to protect the $100 price mark.
- As explained in our last ETH analysis, the $100 price level is a mentally strong barrier where we would expect to find a wall of demand to be set
- If the $100 support holds, it could be a base for a corrective bounce upwards. But, as explained above, according to Elliot Waves there is a high chances of seeing lower in the mid-short
- The next target could be found at the $80 – $85 support area, and if those levels don’t hold, then the $50 price level will be the next target. It is to to discuss those levels as of now.
- The RSI indicator creates higher lows, while the price action creates lower lows, those positive diversions are a potential bounce back up signs.
- A possible bounce could hit the 0.236- 0.618 Fibonacci retracement levels which could send ETH price back to $128 (0.236), $147 (0.382), $161 (0.5) or the bullish scenario $180 (0.618 Fib retracement).
- The trading volume of the current decline is very high, the bulls will look to see those volume levels decrease significantly.
The weekly candle that started on November 19th still got some time on its way before its critical closure: If the bulls will manage to push the price above $155 and close this weekly candle as a long wick hammer candle, then it would be a much better scenario for a bullish continuation for ETH.
ETH/USD BitStamp 4-Hours Chart
Cryptocurrency charts by TradingView. Technical analysis tools by Coinigy.
The post Ethereum Price Analysis Nov.25: ETH sets a new 2018 low at $100 (as expected) appeared first on CryptoPotato.