Ethereum Price Analysis Nov.21: Is 100$ per ETH just around the corner?
The market is going through a massive decline, and the current value of the total crypto market is below $150 billion.
The bears took total control over the market and pushed the price of Bitcoin to a price as low as $4,000-$4,200 (depends on the exchange you are looking at).
This is a 30% drop in just a few days.
This plummet was most likely triggered by the massive triangle formation that would have been seen on the daily chart for months. The time it takes to develop these types of consolidations directly affects the number of limit orders that are being set below or above the formation breakup points, and the more orders that are set at these breaking points a stronger rally is triggered.
When these types of consolidations break, all traders join the same side.
– If the formation breaks to the low:
Short limit orders are triggered + ongoing long positions stop-losses are triggered, which adds more wood to the fire.
– If the formation breaks to the upper side:
Long limit orders are triggered + ongoing short positions stop-losses are triggered (to close a short position a trader needs to buy back). This adds more wood to the fire, and then we see a rally.
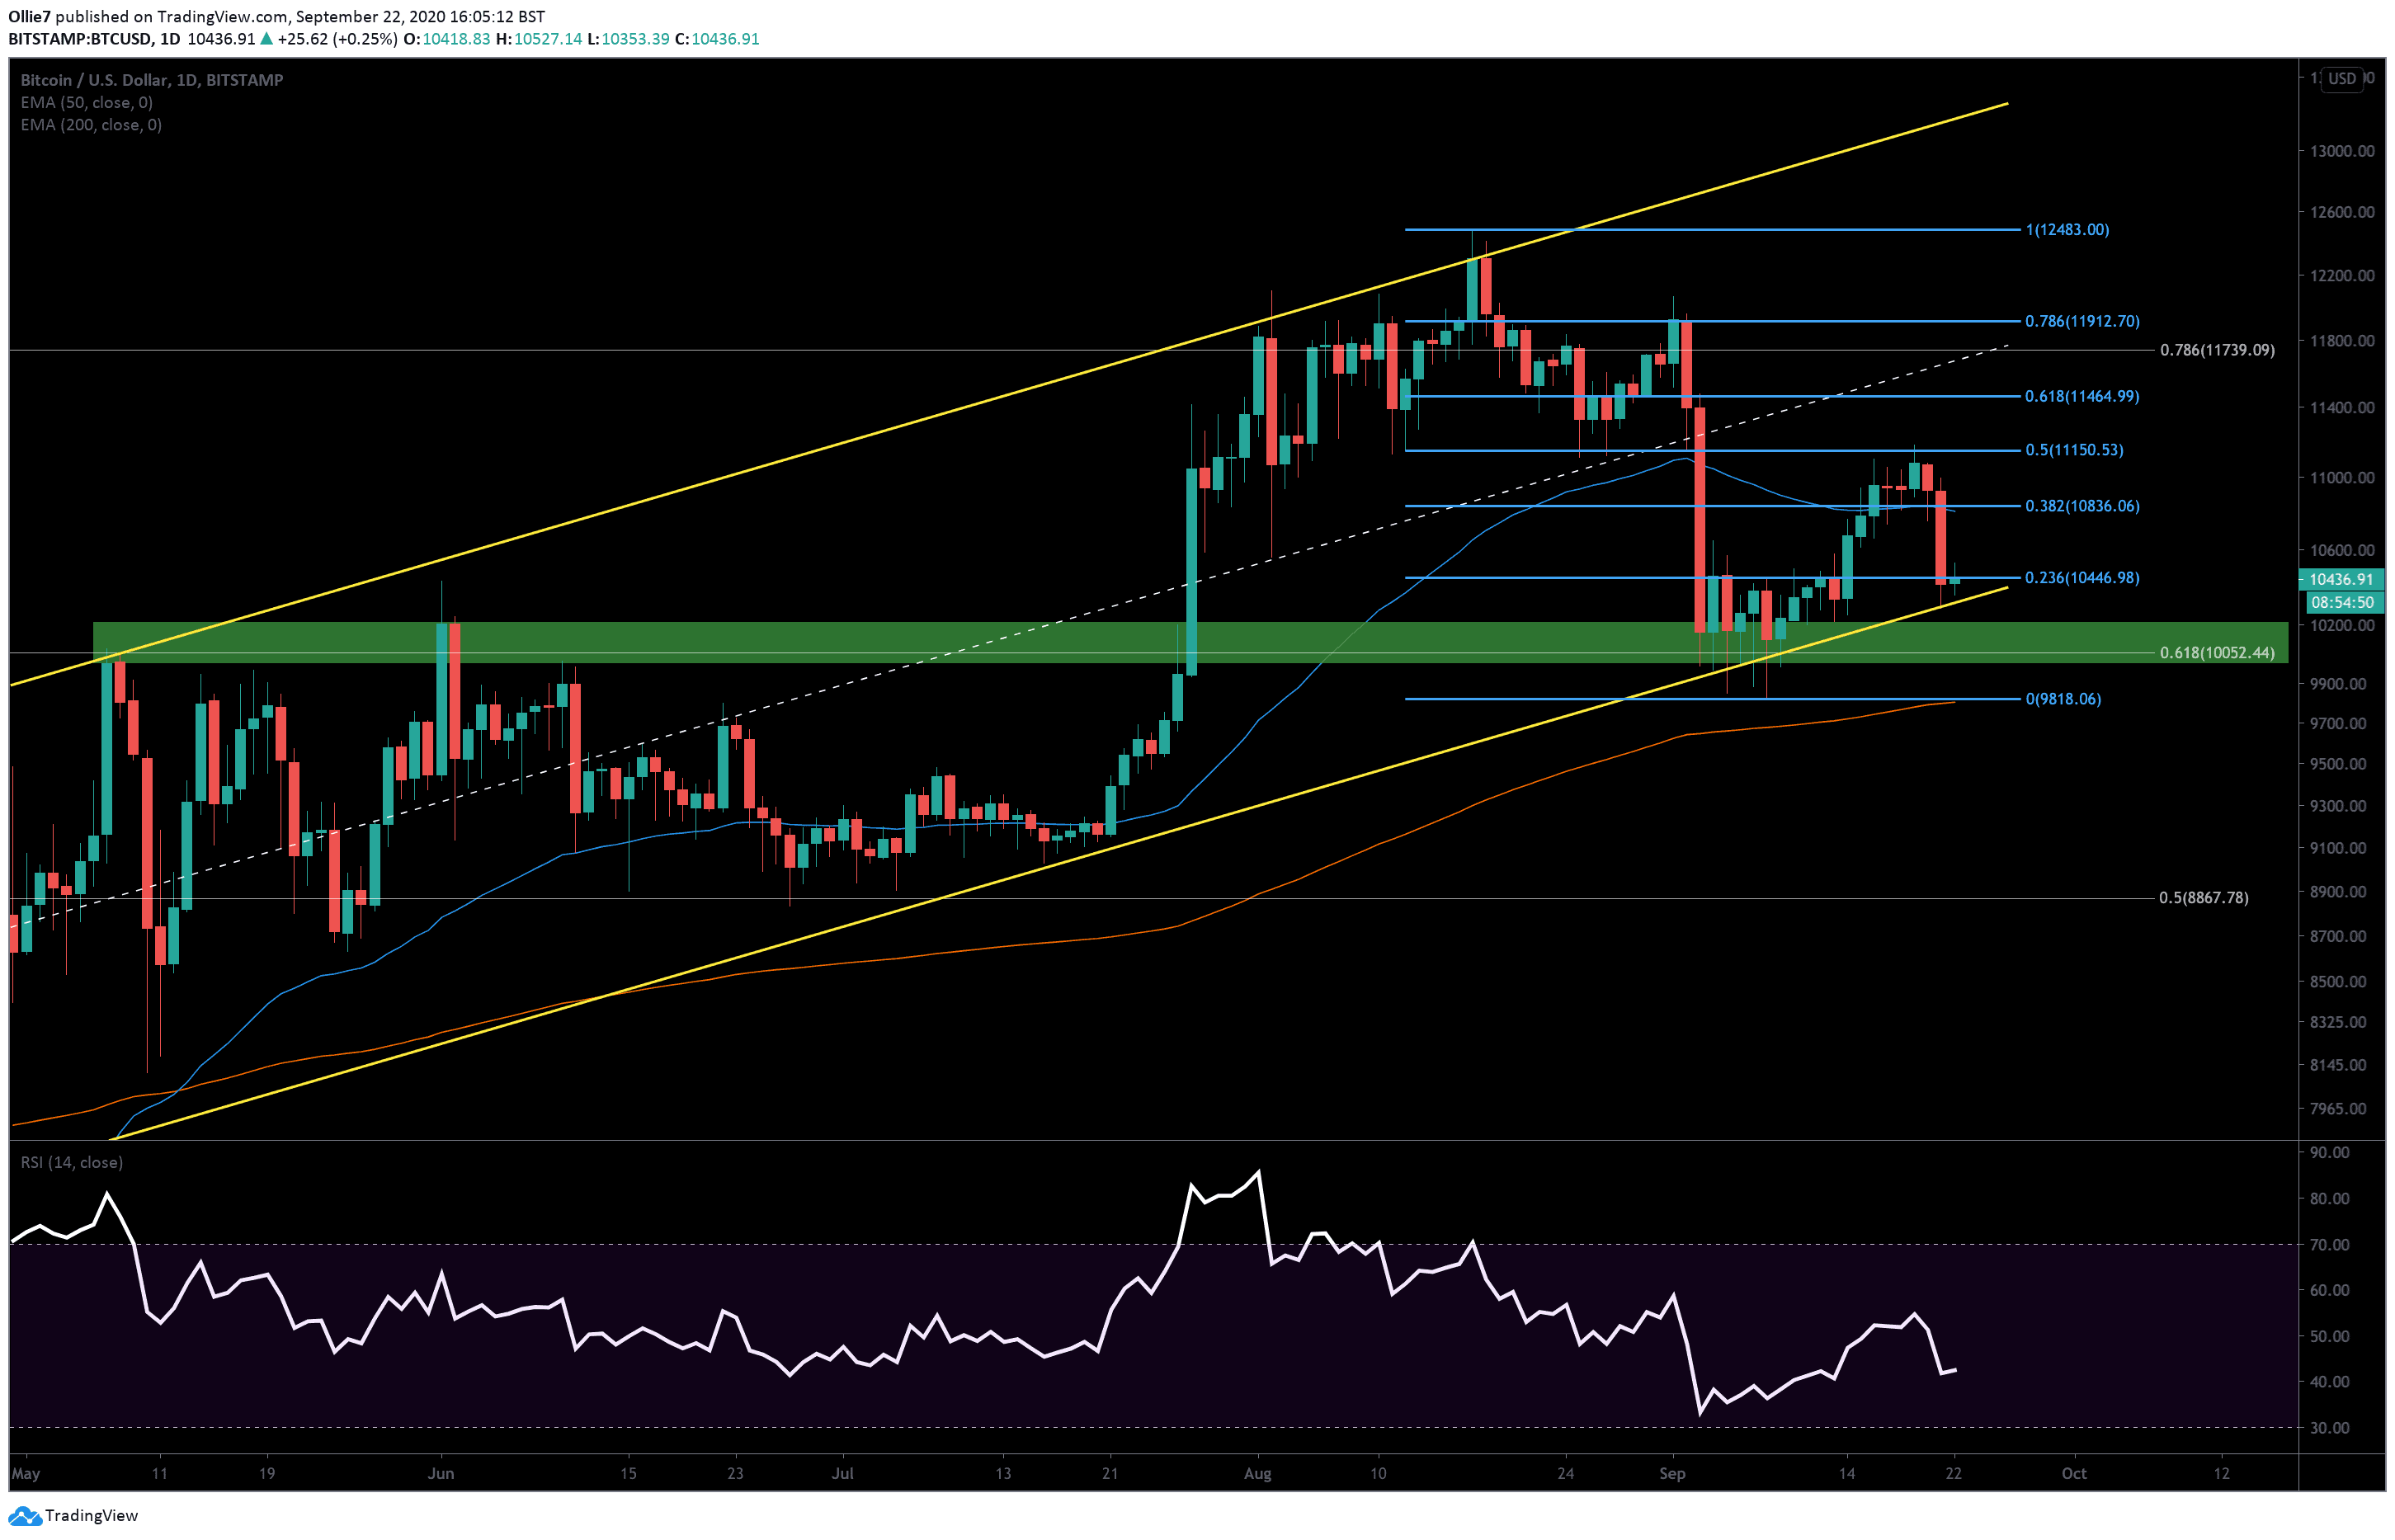
It is also important to note that the BTC daily chart RSI indicator’s value has declined to as low as 10, which is a very low value for the daily RSI and it should be taken into consideration.
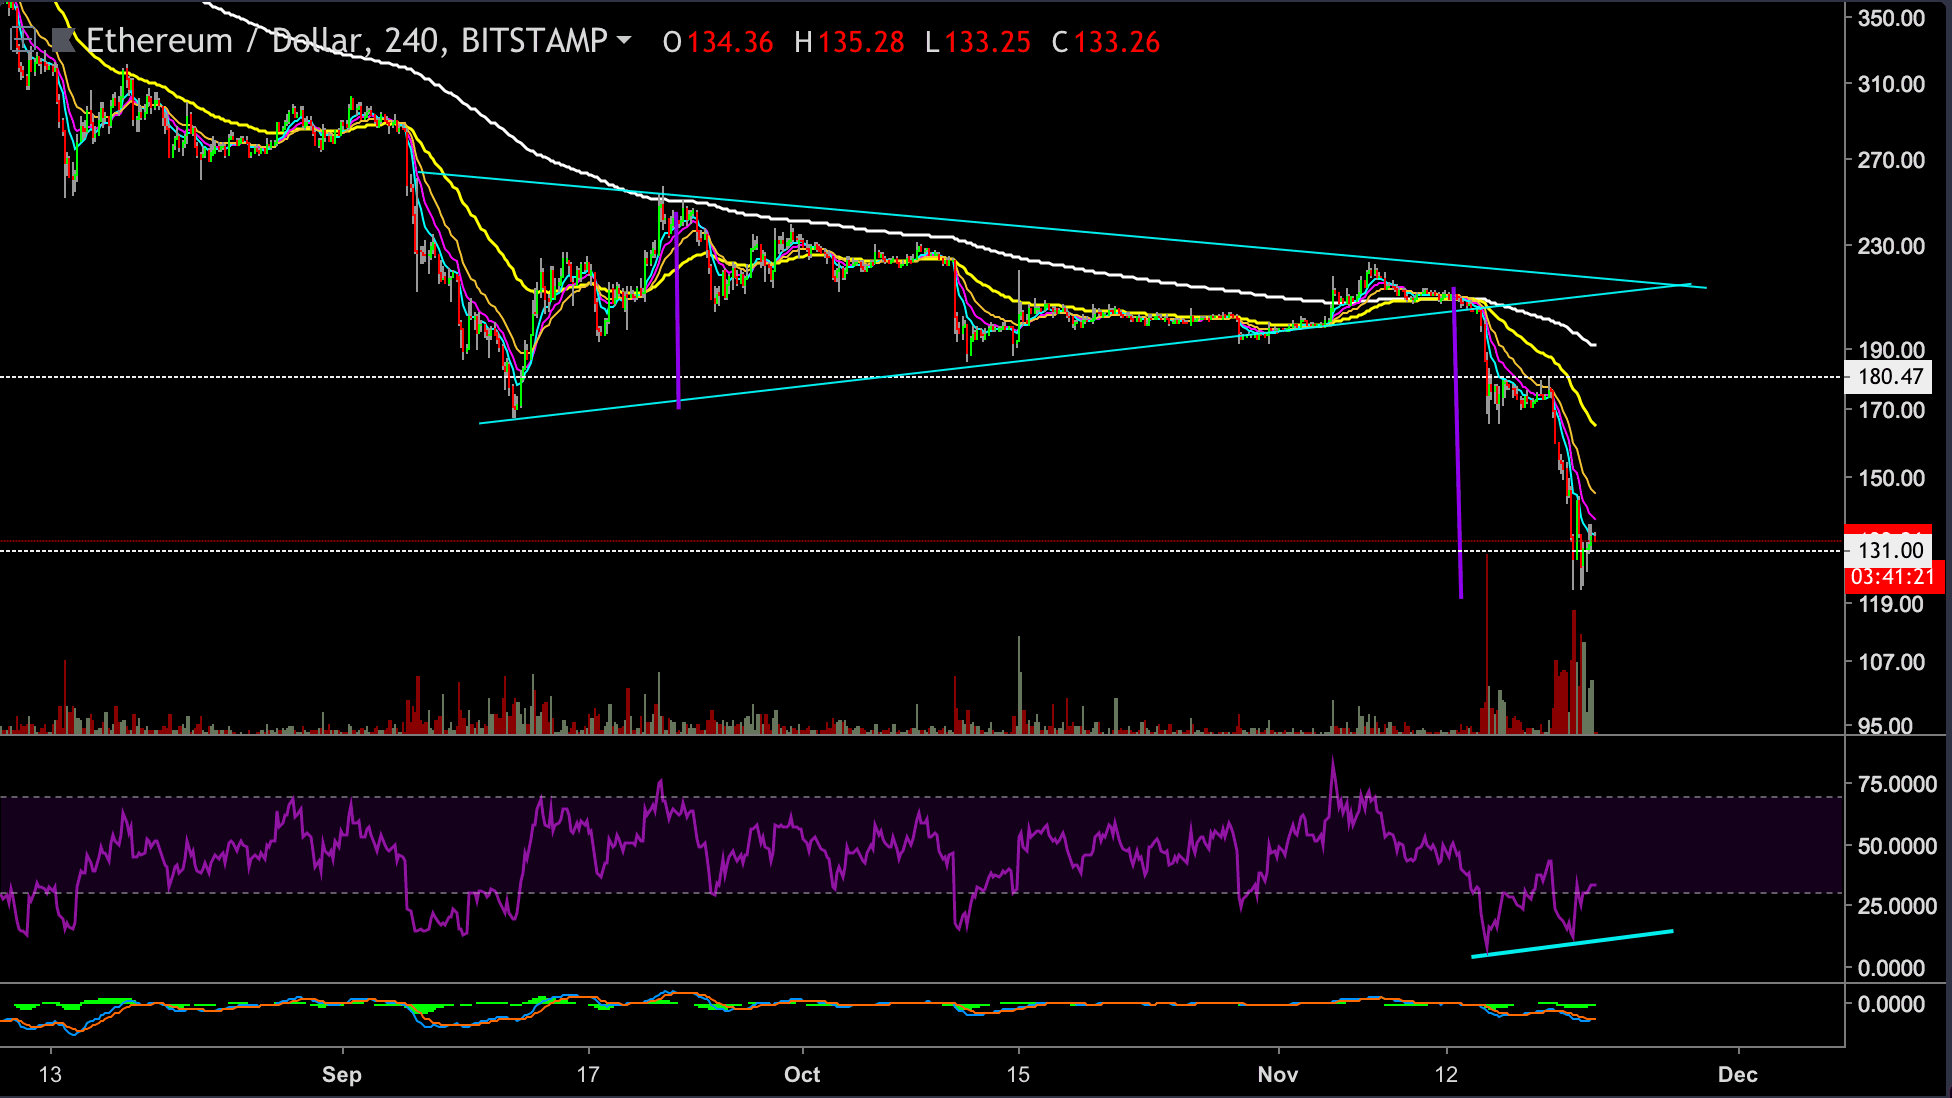
The Ethereum price has dropped by 25% since our last update ($121 lowest price) and is currently being traded at the $131 price level (Bitstamp).
Looking at the 4 hours chart:
– The ETH chart is currently getting supported on the $130-$135 horizontal support levels from the daily chart. We notice the 3 candles that spike below those support levels and climb back above them. This is a good temporary sign showing that the bulls are fighting to hold the ETH price at these levels.
– Also, please see that the triangle formation that was broken on the 12th of November had a target zone at around $125, which is exactly where the ETH chart found the support that stopped the free fall ( lowest price $121).
– If this support level holds, then we might see a bounce up to the $146 price level (0.382 Fibonacci retrecament level) or even higher toward the $153 ( 0.5 Fibonacci retrecament level and 200EMA). The current positive diversions that can be seen in the oversold regions of the 4-hour chart RSI indicator supports this view.
– However, if the bears manage to break the current support level, then the downward rally will continue with the next possible target at 100$ ( a mentally strong number where bulls might try to jump in).
– If the $100 price level doesn’t hold, then the next support level could be found at the $85 price level area (historic support level from May 2017).
ETH/USD BitStamp 4-Hours Chart
The post Ethereum Price Analysis Nov.21: Is 100$ per ETH just around the corner? appeared first on CryptoPotato.