Ethereum Price Analysis Nov.15: Will Support Hold?
After long months of sideways consolidation, the market has finally chosen a direction, and as it appears the bears have won the battle.
BTC has lost more than 14% in the past two days, and all of the other altcoins are following in even worse drops. The total market crypto market capitalization has declined to as low as $176 B.
Pay attention to the 12-hour RSI indicator which declined to the lowest level since July 2016 and is currently at 6… Notice that the RSI movement range is between 0-100 which should give some indication regarding the markets immediate sentiment.
Traders have been waiting for the long triangle formation from the daily chart to breakout to one of the sides, and it finally did break, so what now?
For BTC the next reasonable support level could be found at 5000$ and lower at $4000 and even 3000$ if this blood rally continues.
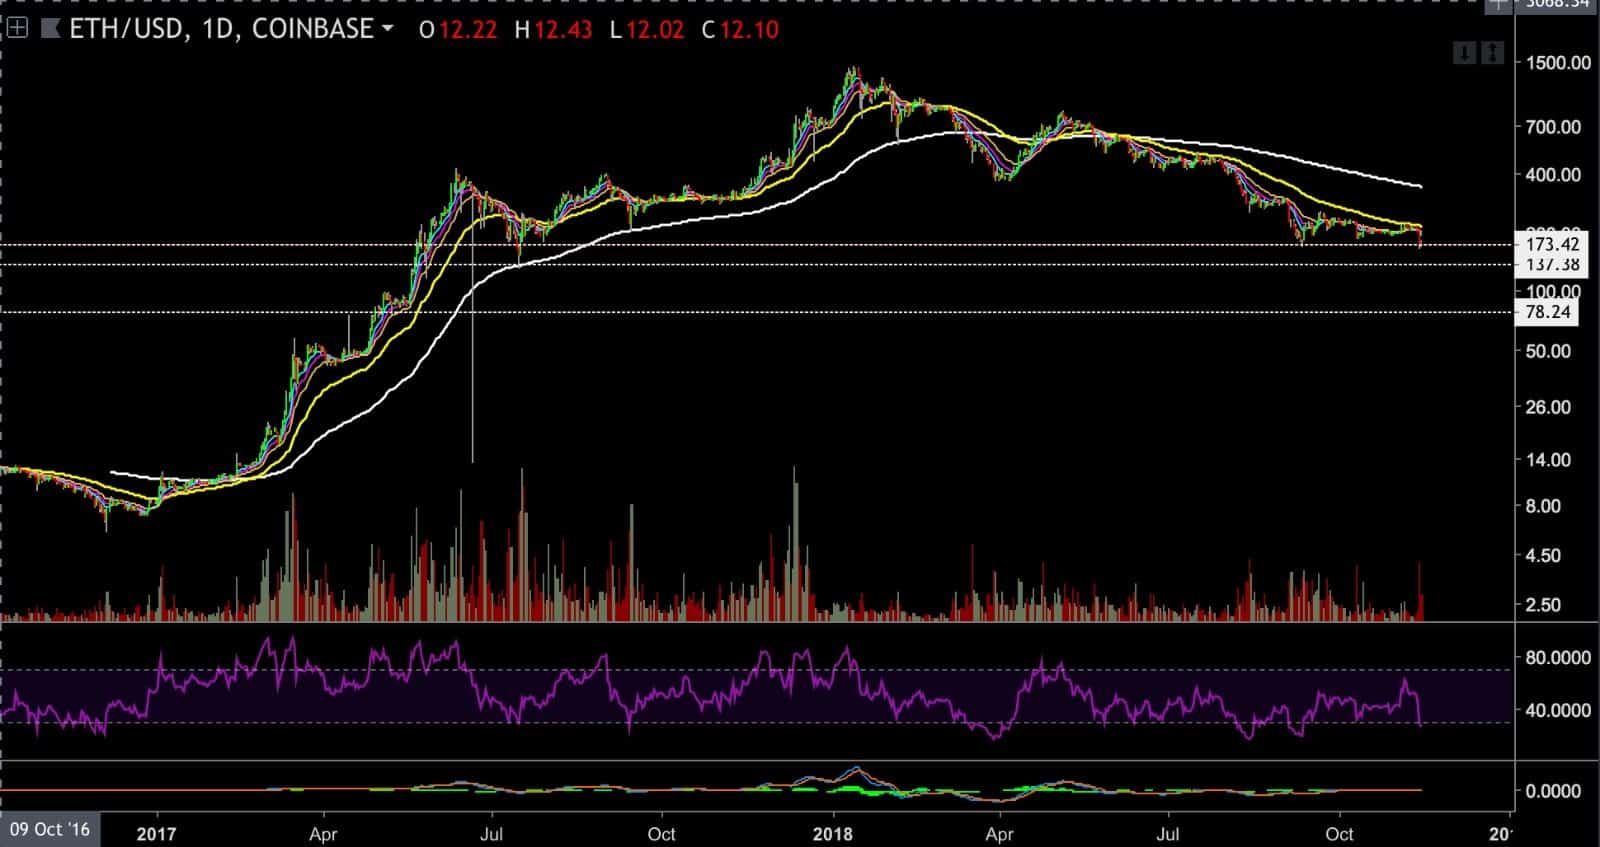
Back to Ethereum: ETH price is currently around 168$ level (according to Bitstamp) and falling rapidly.
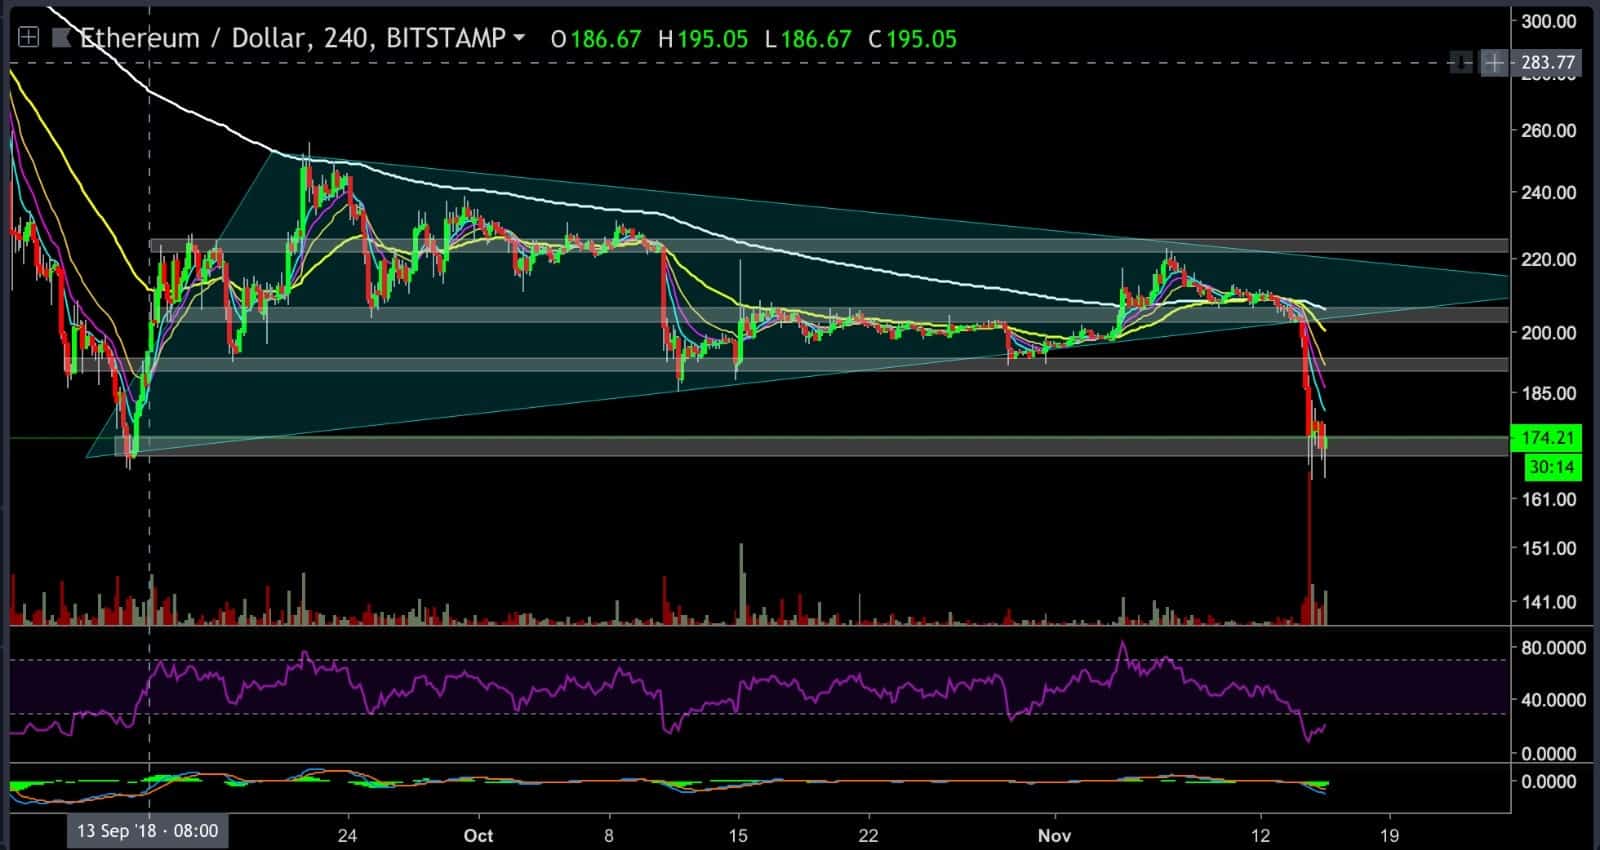
Looking at the 4 hours chart
- as we mentioned in our previous analysis, if the bears manage to break the 206$ support level that was held nicely in the past week or so, then we might see a fast move downward, and this is precisely what happened.
- Ethereum broke through all of its support levels with high volume in a single red candle. Ethereum is currently maintaining support at the $167 price level, the lowest support level on the following 4 hours chart.
- At the time of writing, there is an intense fight around this support level, and the bears currently appear to have the hand stronger.
- The next support level lies at the $126 – $130 price level or even lower – at the $80 price level area (in case that the round number of $100 won’t trigger some bulls action).
- The 4 hours chart RSI is currently at 25 in the oversold areas and as it seems it could keep on dropping much lower.
Please take extra caution these days and protect your funds.
ETH/USD BitStamp 4-Hours Chart
ETH/USD Coinbase 1-Day Chart
Cryptocurrency charts by TradingView. Technical analysis tools by Coinigy.
The post Ethereum Price Analysis Nov.15: Will Support Hold? appeared first on CryptoPotato.