Ethereum Price Analysis May 2: ETH Rebounds To Face Crucial Resistance at $160
Ethereum has seen a slight rebound during the end of April 2018 toward $170. The cryptocurrency has seen an impressive 90-day price increase of 50%. However, the coin has struggled over the past month as the ETH price was steady and decreased against Bitcoin.
Despite this sluggish price movement, Ethereum remains ranked in 2nd place in the top coins by market cap as it currently holds a $17 billion market cap value.
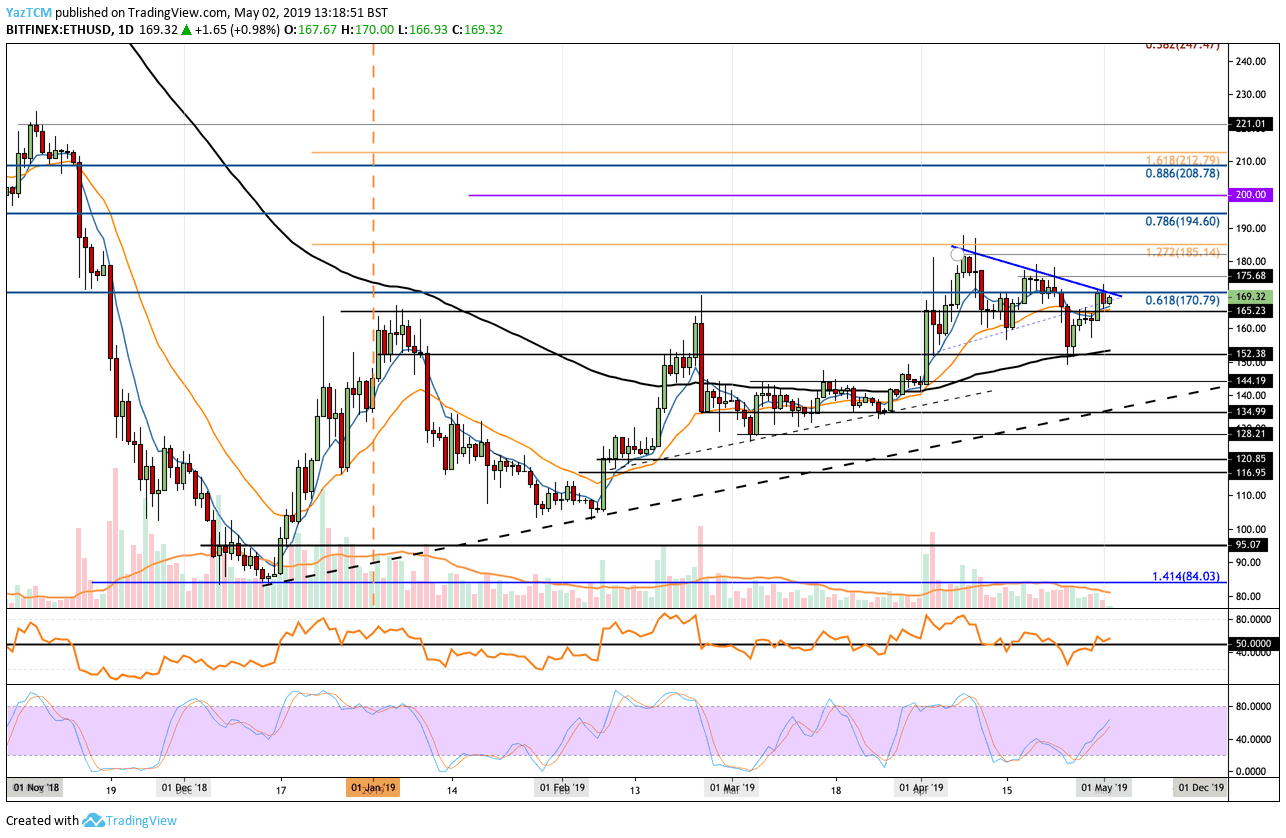
Looking at the ETH/USD 1-Day Chart:
- Since our previous ETH/USD analysis, we can see that the market had broken beneath our previously highlighted short term symmetrical triangle pattern. After breaking below, the coin found support at $152, along with the 100-days moving average line. And since then, rebounded. ETH/USD is now trading at resistance around $170 as it attempts to break above a short-term descending trend line marked in blue.
- From above: If the bulls can break above $170 (on Bitfinex) and the descending trend line, higher resistance lies at $175, $180 and $185. Above $185, higher resistance lies at $194, where lies the long term bearish .786 Fibonacci Retracement, and $200. If the buyers continued above $200, further resistance lies at $208 and $221.
- From below: Initial support lies at $165 and $152. Beneath $150, further support lies at $144, $140 and $134, along with the long-term trend line ascending trend-line, currently lies between $140-$134.
- The Stochastic RSI has recently had a crossover above in the oversold territory which might be triggering a positive correction. The RSI has also recently managed to rise back above the 50 level which indicates that the selling momentum may have ceased down.
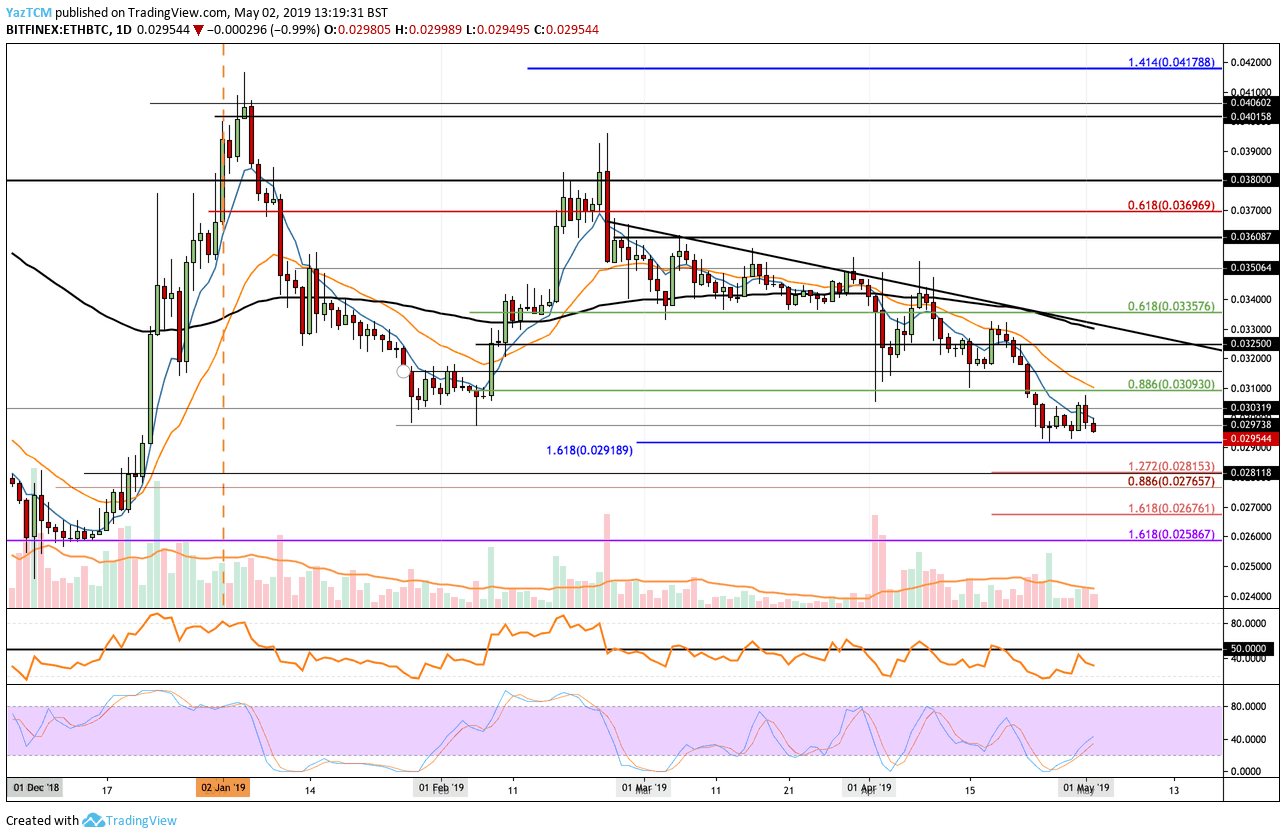
Looking at the ETH/BTC 1-Day Chart:
- Following our last ETH/BTC analysis, we can see that the market had continued to break further below the support at 0.02973 BTC to create a new 2019 price low at 0.02918 BTC. The support at 0.02918 BTC, which had contained a downside 1.618 Fibonacci Extension level, held up the ETH price and since then it rebounded slightly.
- From above: The nearest level of resistance now lies at 0.030 BTC. If the bulls break above, further resistance then lies at 0.031 BTC and 0.0325 BTC.
- From below: The nearest level of support now lies at 0.02918 BTC. Beneath this, more support lies at 0.02815 BTC, 0.02765 BTC, and 0.0267 BTC.
- The Stochastic RSI has also recently gone through a crossover above in the oversold area. However, the RSI remains below 50 as the bears remain in control of the market momentum.
The post Ethereum Price Analysis May 2: ETH Rebounds To Face Crucial Resistance at $160 appeared first on CryptoPotato.