Ethereum Price Analysis: ETH Forms a Bearish Divergence, is a Short-Term Correction Coming?
ETH/USD – Ether Bearish Divergence Continues At $3300
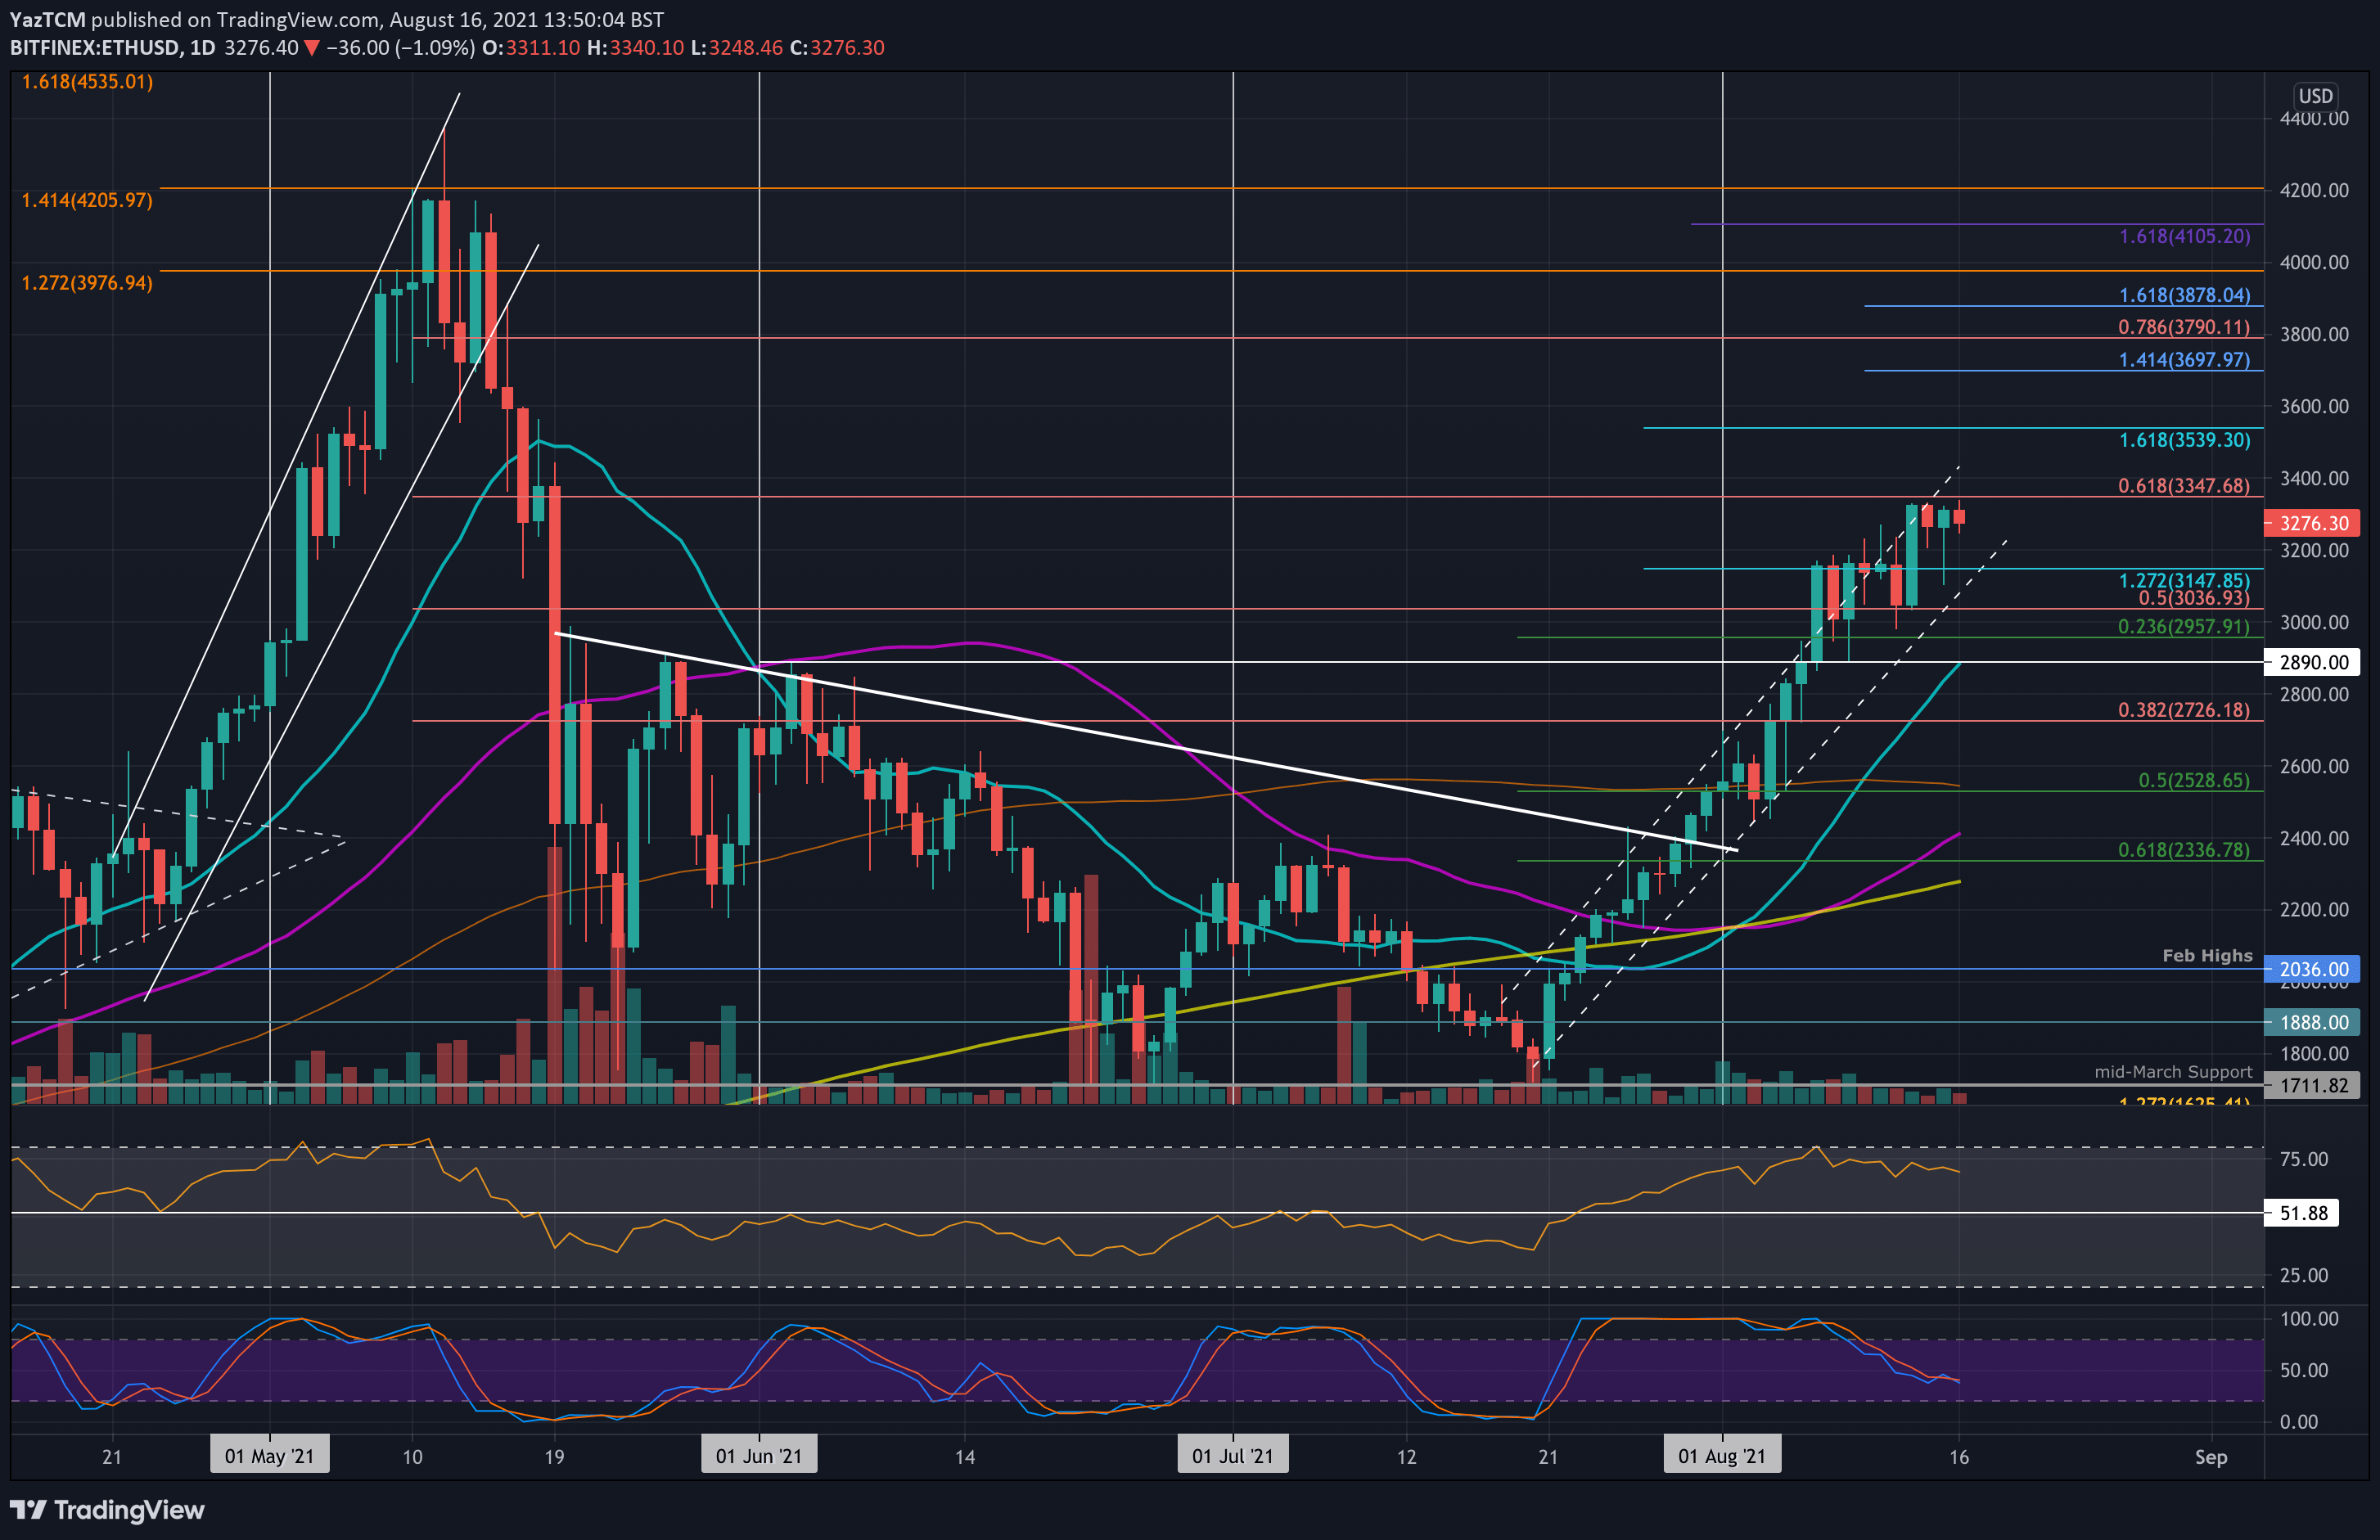
Key Support Levels: $3150, $3035, $3000.
Key Resistance Levels: $3350, $3400, $3540.
Ethereum saw some positive price developments toward the end of last week as it surged above the previous $3150 resistance on Friday. It continued to climb as high as $3330 over the weekend but could not break above it.
Yesterday, ETH dipped as low as $3100 but quickly rebounded to heads back toward $3300 when the candle closed.
Unfortunately, there are hints of bearish divergence between price action and the RSI, suggesting that the market could see a short-term retracement.
ETH-USD Short Term Price Prediction
Looking ahead, the first resistance lies at $3350 (bearish .618 Fib). This is followed by $3400, $3540 (1.618 Fib Extension), and $3700.
On the other side, the first support lies at $3150. This is followed by $3035, $3000, and $2960 (.236 Fib).
As mentioned, there is a bearish divergence between price action and the RSI as it makes lower highs while the price makes higher highs. This could suggest a retracement is imminent.
ETH/BTC – ETH Forms Short-Term Symmetrical Triangle Pattern
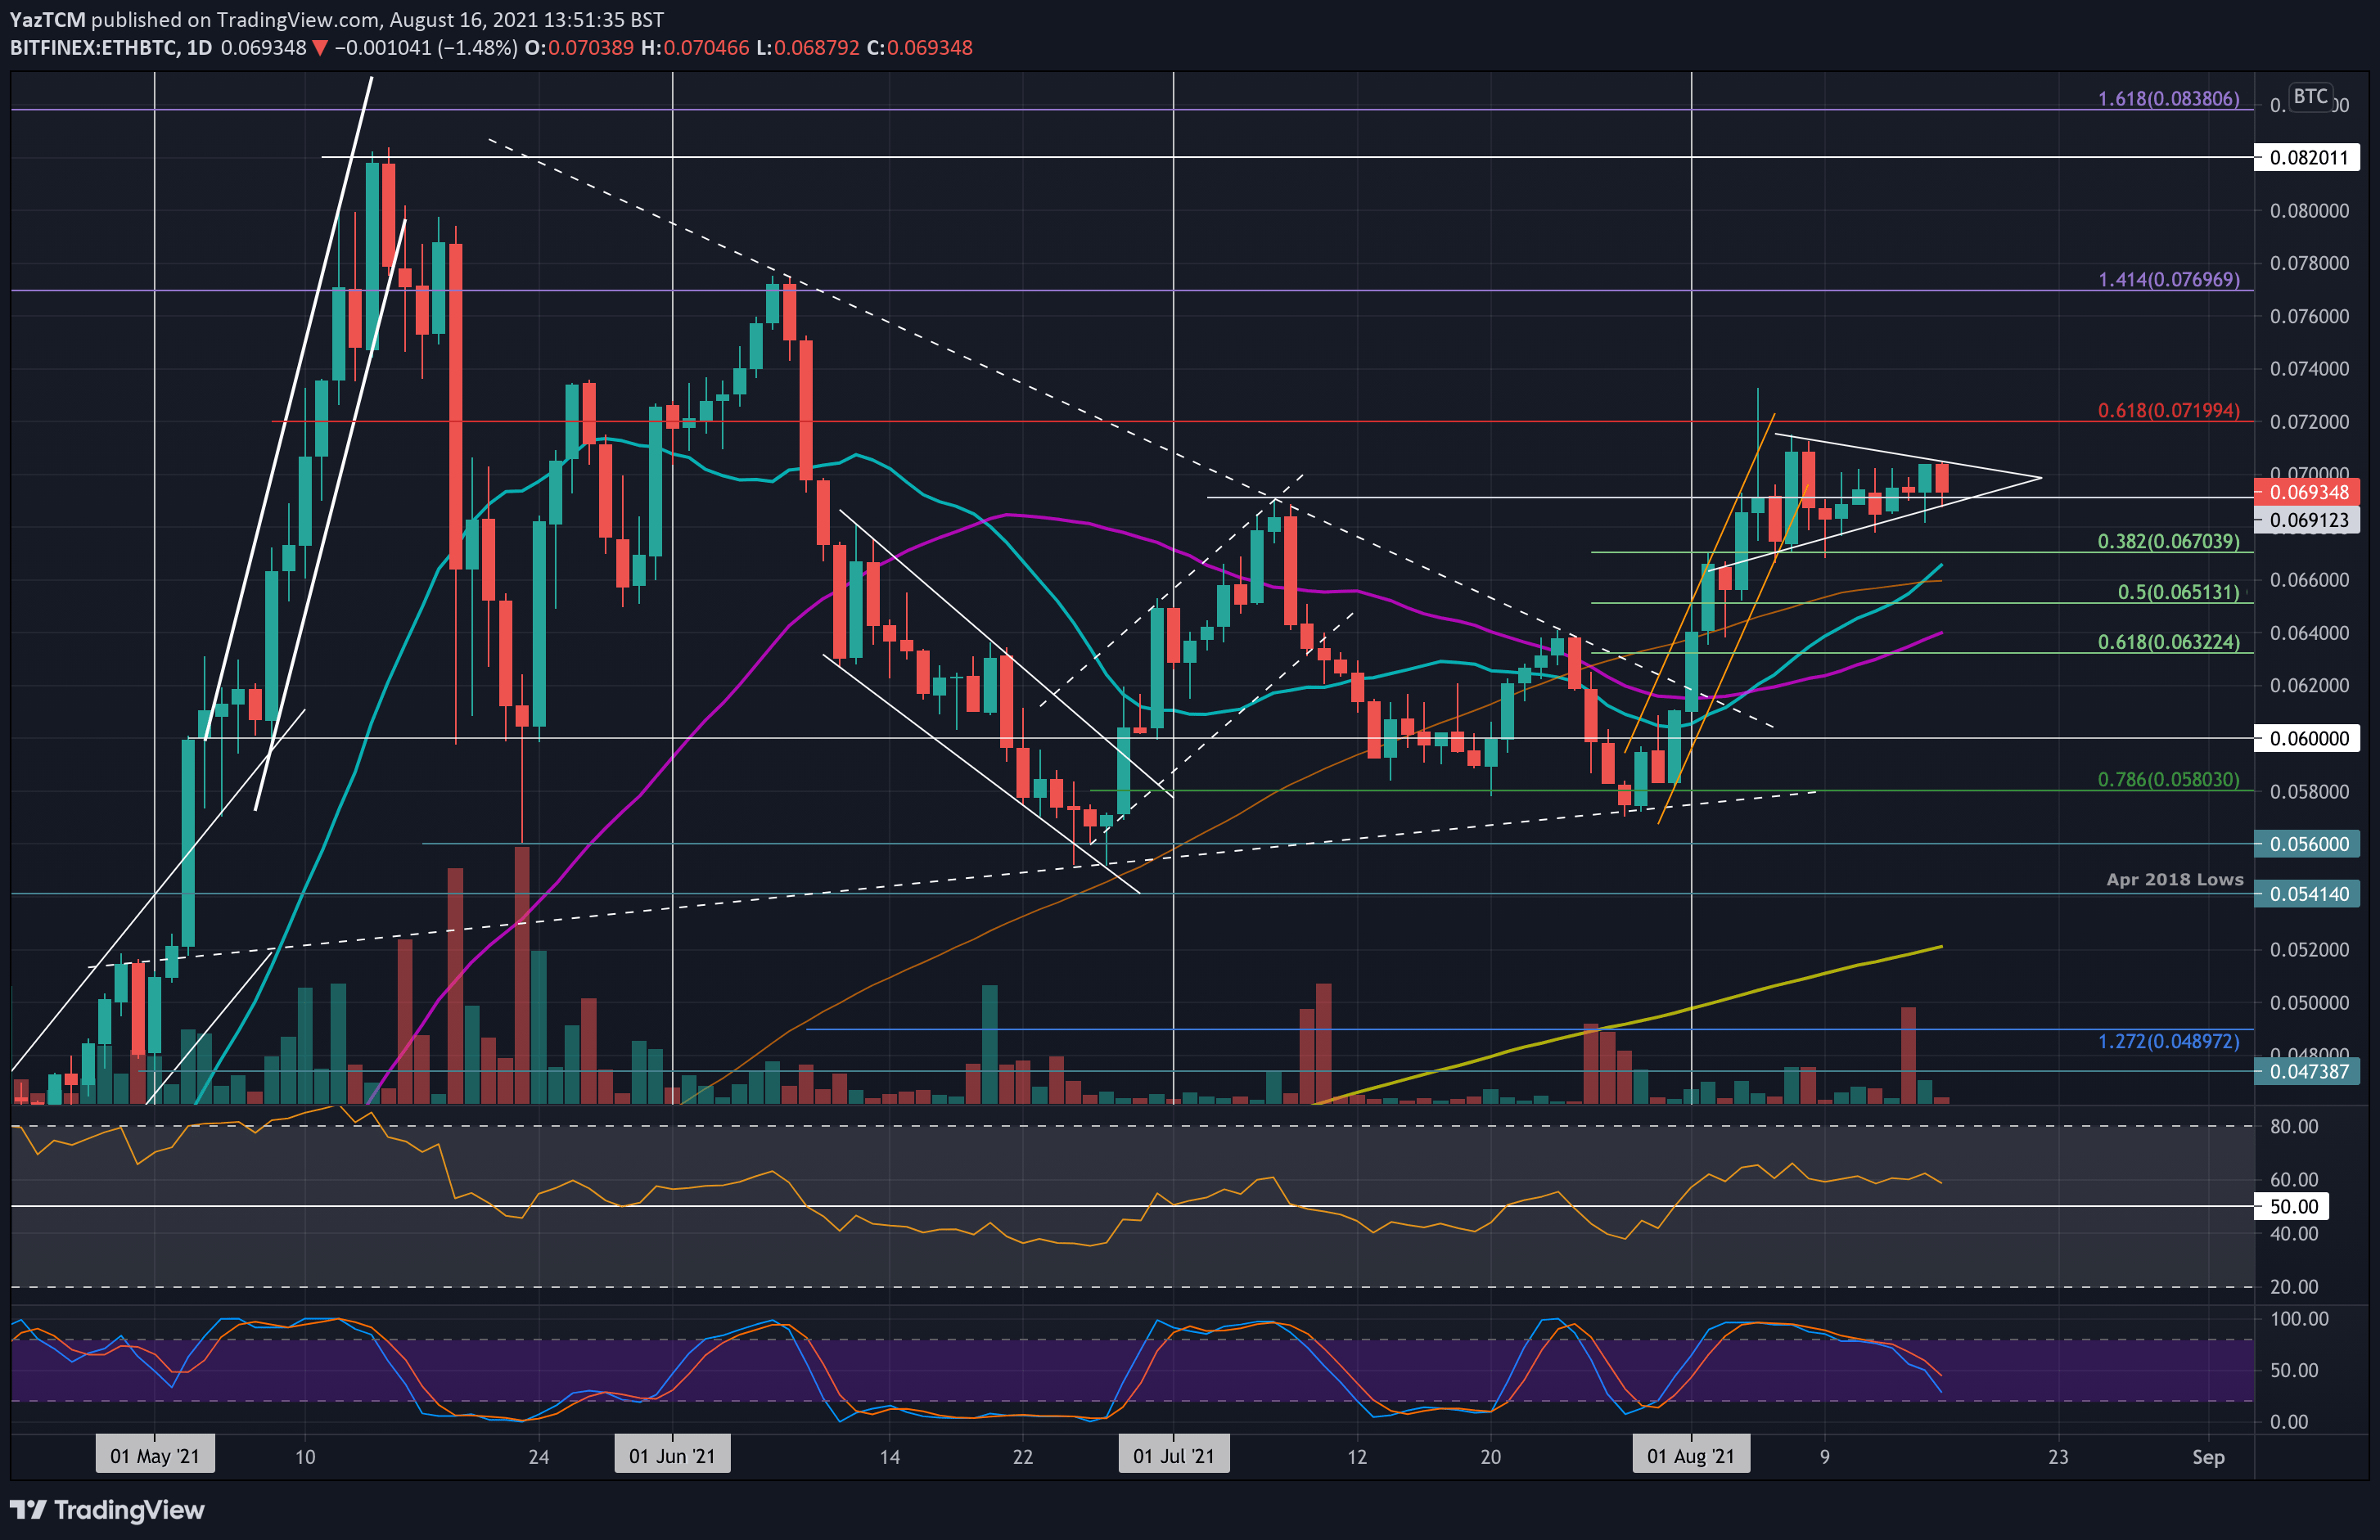
Key Support Levels: 0.069 BTC, 0.067 BTC, 0.066 BTC.
Key Resistance Levels: 0.07 BTC, 0.072 BTC, 0.074 BTC.
Ethereum is consolidating against bitcoin as it moves sideways inside a symmetrical triangle formation. The cryptocurrency surged higher at the start of August after breaking a long-term symmetrical triangle. It reached as high as 0.073 BTC but started to head lower from there.
The market is quickly approaching the triangle’s apex, where a breakout can be expected to dictate the next direction for ETH.
ETH-BTC Short Term Price Prediction
Moving forward, the first resistance lies at the upper angle of the triangle, around 0.07 BTC. This is followed by 0.072 BTC (bearish .618 Fib), 0.074 BTC, and 0.076 BTC (1.414 Fib Extension).
On the other side, the first support lies around 0.069 BTC (lower angle of the triangle). This is followed by 0.067 BTC (.382 Fib), 0.066 BTC (100-day MA), and 0.0651 BTC (.5 Fib Retracement).
The RSI is marginally above the midline, indicating weak bullish momentum.